Schematic overview of the cellular and molecular mechanisms involved in the cancer progression, including the proposed cellular and molecular mechanisms in cancer cells trajectory. AT1: alveolar type 1 cells; AT2: alveolar type 2 cells; AAH: atypical adenomatous hyperplasia; AIS: adenocarcinoma in situ; MIA: minimally invasive adenocarcinoma; IA: invasive adenocarcinoma; EMT: epithelial-mesenchymal transition

Home

Download

Statistics

Help

Contact

Center for Computational Systems Medicine
leaf

Gene summary

leaf

Malignant transformation analysis

leaf

Malignant transformation related pathway analysis

leaf

Cell-cell communication analysis

leaf

Single-cell gene regulatory network inference analysis

leaf

Somatic mutation of malignant transformation related genes

leaf

Related drugs of malignant transformation related genes

Gene: FRMD4A

Gene summary for FRMD4A

check button Gene summary.

Gene informationSpeciesHuman
Gene symbol

FRMD4A

Gene ID

55691

Gene nameFERM domain containing 4A
Gene AliasCCAFCA
Cytomap10p13
Gene Typeprotein-coding
GO ID

GO:0006810

UniProtAcc

Q9NW91


Top

Malignant transformation analysis

check button Identification of the aberrant gene expression in precancerous and cancerous lesions by comparing the gene expression of stem-like cells in diseased tissues with normal stem cells
check button Malignant transformation involving gene list.
Entrez IDSymbolReplicatesSpeciesOrganTissueAdj P-valueLog2FCMalignancy
55691FRMD4AAEH-subject5HumanEndometriumAEH2.99e-063.74e-01-0.2953
55691FRMD4AGSM6177620_NYU_UCEC1_lib2_lib2HumanEndometriumEEC4.96e-02-3.14e-02-0.1875
55691FRMD4AGSM6177620_NYU_UCEC1_lib3_lib3HumanEndometriumEEC4.92e-02-7.47e-02-0.1883
55691FRMD4AGSM6177621_NYU_UCEC2_lib1_lib1HumanEndometriumEEC5.10e-062.54e-01-0.1934
55691FRMD4AGSM6177622_NYU_UCEC3_lib1_lib1HumanEndometriumEEC2.19e-04-3.53e-02-0.1917
55691FRMD4AGSM6177622_NYU_UCEC3_lib2_lib2HumanEndometriumEEC5.68e-031.63e-02-0.1916
55691FRMD4ALZE7THumanEsophagusESCC2.71e-021.52e-010.0667
55691FRMD4ALZE24THumanEsophagusESCC4.64e-061.39e-010.0596
55691FRMD4AP2T-EHumanEsophagusESCC1.16e-611.47e+000.1177
55691FRMD4AP4T-EHumanEsophagusESCC1.88e-042.30e-010.1323
55691FRMD4AP5T-EHumanEsophagusESCC1.05e-061.09e-010.1327
55691FRMD4AP8T-EHumanEsophagusESCC5.12e-151.33e-010.0889
55691FRMD4AP9T-EHumanEsophagusESCC1.23e-041.18e-010.1131
55691FRMD4AP10T-EHumanEsophagusESCC8.94e-091.10e-010.116
55691FRMD4AP11T-EHumanEsophagusESCC5.67e-126.05e-010.1426
55691FRMD4AP12T-EHumanEsophagusESCC1.15e-113.18e-010.1122
55691FRMD4AP15T-EHumanEsophagusESCC2.70e-048.63e-020.1149
55691FRMD4AP16T-EHumanEsophagusESCC7.02e-528.84e-010.1153
55691FRMD4AP19T-EHumanEsophagusESCC1.34e-048.10e-010.1662
55691FRMD4AP20T-EHumanEsophagusESCC3.82e-091.22e-010.1124
Page: 1 2 3 4 5 

check button Transcriptomic changes along malignancy continuum.
TissueExpression DynamicsAbbreviation
EndometriumThe image shows the transcriptomic changes along malignancy continuum.log2FC in expression of this searched gene in stem-like cells from each diseased tissue sample relative to stem-like cells in normal samples in each tissue plotted against the malignancy continuum. Samples are colored based on if they are from different disease stage.AEH: Atypical endometrial hyperplasia
EEC: Endometrioid Cancer
EsophagusThe image shows the transcriptomic changes along malignancy continuum.log2FC in expression of this searched gene in stem-like cells from each diseased tissue sample relative to stem-like cells in normal samples in each tissue plotted against the malignancy continuum. Samples are colored based on if they are from different disease stage.ESCC: Esophageal squamous cell carcinoma
HGIN: High-grade intraepithelial neoplasias
LGIN: Low-grade intraepithelial neoplasias
Oral CavityThe image shows the transcriptomic changes along malignancy continuum.log2FC in expression of this searched gene in stem-like cells from each diseased tissue sample relative to stem-like cells in normal samples in each tissue plotted against the malignancy continuum. Samples are colored based on if they are from different disease stage.
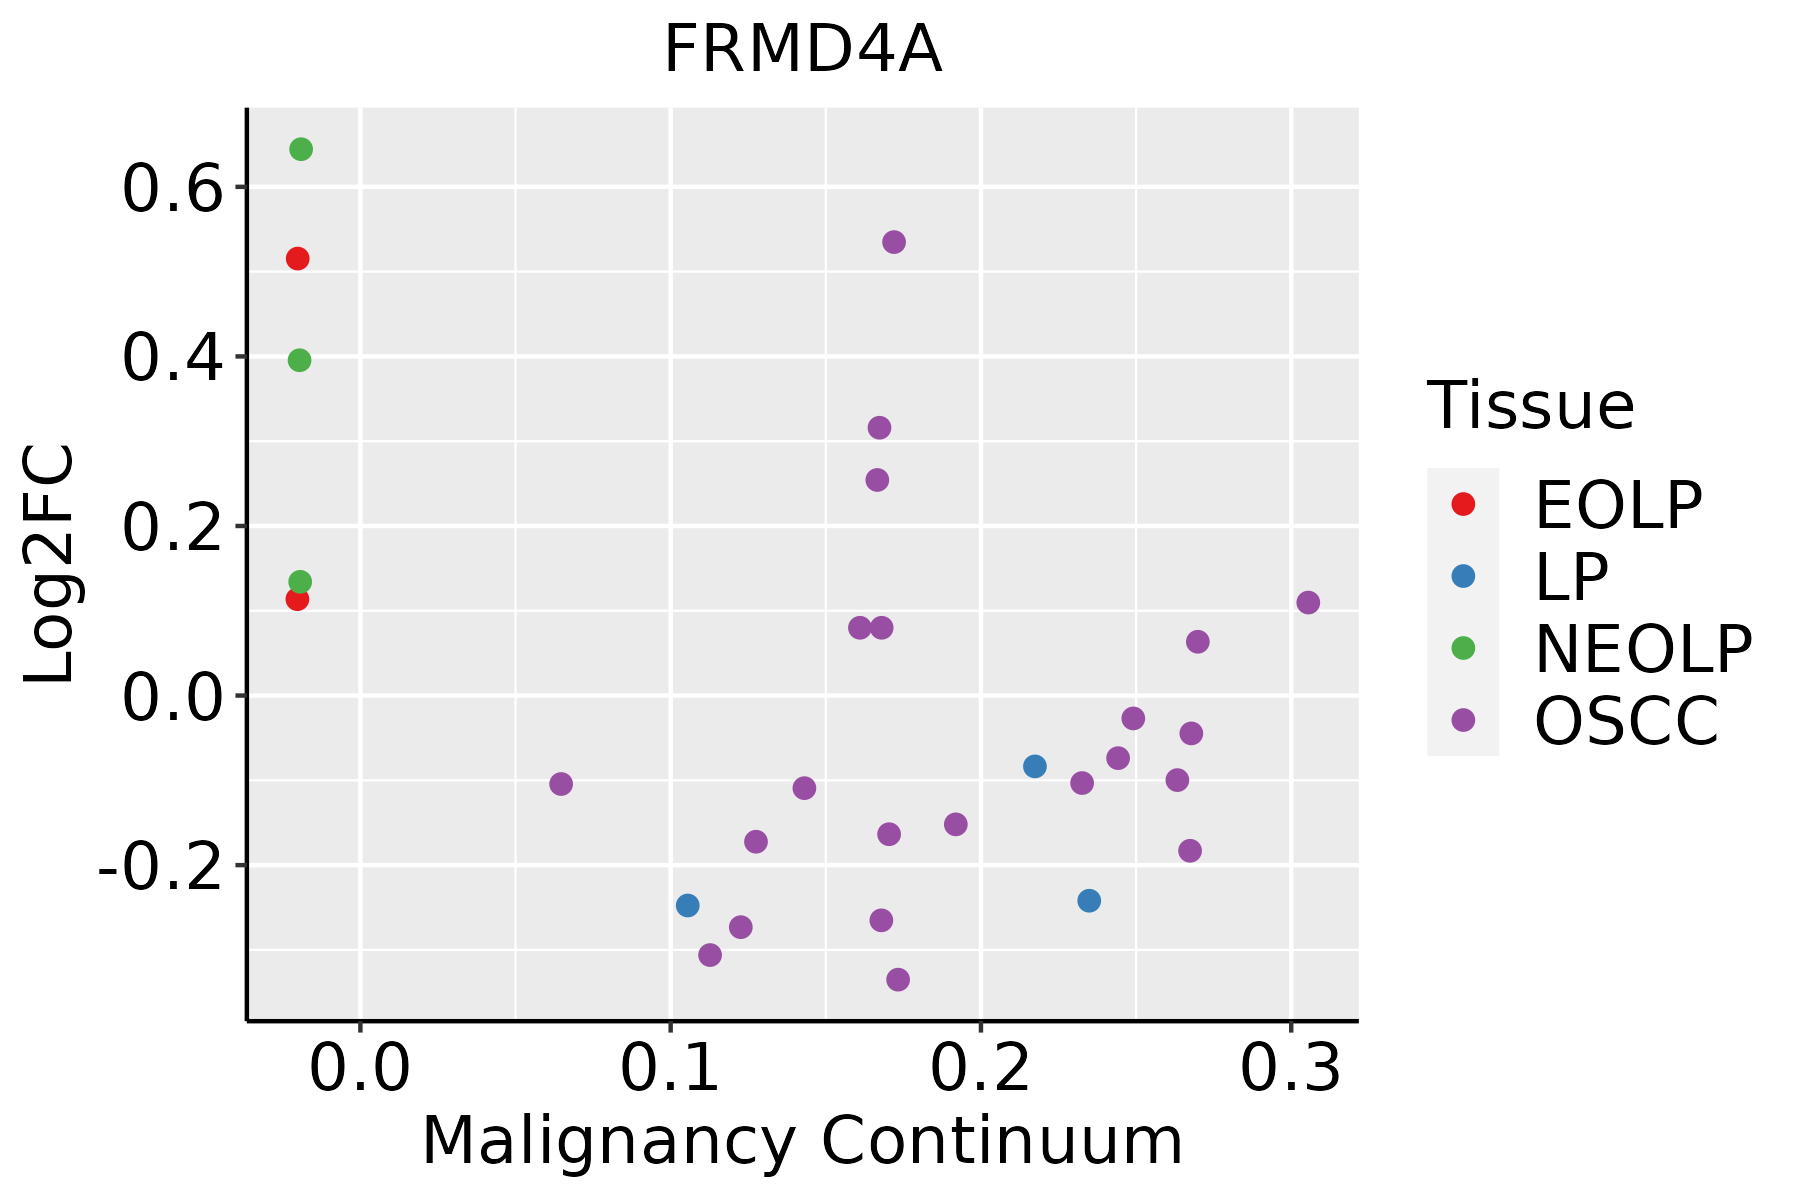
EOLP: Erosive Oral lichen planus
LP: leukoplakia
NEOLP: Non-erosive oral lichen planus
OSCC: Oral squamous cell carcinoma
ProstateThe image shows the transcriptomic changes along malignancy continuum.log2FC in expression of this searched gene in stem-like cells from each diseased tissue sample relative to stem-like cells in normal samples in each tissue plotted against the malignancy continuum. Samples are colored based on if they are from different disease stage.BPH: Benign Prostatic Hyperplasia
SkinThe image shows the transcriptomic changes along malignancy continuum.log2FC in expression of this searched gene in stem-like cells from each diseased tissue sample relative to stem-like cells in normal samples in each tissue plotted against the malignancy continuum. Samples are colored based on if they are from different disease stage.AK: Actinic keratosis
cSCC: Cutaneous squamous cell carcinoma
SCCIS:squamous cell carcinoma in situ
ThyroidThe image shows the transcriptomic changes along malignancy continuum.log2FC in expression of this searched gene in stem-like cells from each diseased tissue sample relative to stem-like cells in normal samples in each tissue plotted against the malignancy continuum. Samples are colored based on if they are from different disease stage.ATC: Anaplastic thyroid cancer
HT: Hashimoto's thyroiditis
PTC: Papillary thyroid cancer
∗log2FC in expression of this searched gene in stem-like cells from each diseased tissue sample relative to stem-like cells in normal samples in each tissue plotted against the malignancy continuum. Samples are colored based on if they are from different disease stage.

Top

Malignant transformation related pathway analysis

check buttonFind out the enriched GO biological processes and KEGG pathways involved in transition from healthy to precancer to cancer
check button Figure of enriched GO biological processes.
TissueDisease StageEnriched GO biological Processes
ColorectumADGO analysis - Figure of enriched GO biological processes: Top 15 enriched GO BP terms are showed in the bar plot of each disease state in each tissue. Each row represents a significant GO biological process which is colored according to the -log10(p.adjust).
ColorectumSERGO analysis - Figure of enriched GO biological processes: Top 15 enriched GO BP terms are showed in the bar plot of each disease state in each tissue. Each row represents a significant GO biological process which is colored according to the -log10(p.adjust).
ColorectumMSSGO analysis - Figure of enriched GO biological processes: Top 15 enriched GO BP terms are showed in the bar plot of each disease state in each tissue. Each row represents a significant GO biological process which is colored according to the -log10(p.adjust).
ColorectumMSI-HGO analysis - Figure of enriched GO biological processes: Top 15 enriched GO BP terms are showed in the bar plot of each disease state in each tissue. Each row represents a significant GO biological process which is colored according to the -log10(p.adjust).
ColorectumFAPGO analysis - Figure of enriched GO biological processes: Top 15 enriched GO BP terms are showed in the bar plot of each disease state in each tissue. Each row represents a significant GO biological process which is colored according to the -log10(p.adjust).
∗Top 15 enriched GO BP terms are showed in the bar plot of each disease state in each tissue. Each row represents a significant GO biological process which is colored according to the -log10(p.adjust).
Page: 1 2 3 4 5 6 7 8 9 

check button Enriched GO biological processes.
GO IDTissueDisease StageDescriptionGene RatioBg Ratiopvaluep.adjustCount
GO:190495115EndometriumAEHpositive regulation of establishment of protein localization74/2100319/187237.05e-106.51e-0874
GO:000716310EndometriumAEHestablishment or maintenance of cell polarity54/2100218/187231.30e-088.47e-0754
GO:005122215EndometriumAEHpositive regulation of protein transport66/2100303/187237.79e-083.99e-0666
GO:00300109EndometriumAEHestablishment of cell polarity36/2100143/187232.19e-066.49e-0536
GO:00510515EndometriumAEHnegative regulation of transport79/2100470/187231.51e-041.99e-0379
GO:00507087EndometriumAEHregulation of protein secretion49/2100268/187233.83e-044.12e-0349
GO:00507149EndometriumAEHpositive regulation of protein secretion28/2100137/187231.17e-031.01e-0228
GO:00901628EndometriumAEHestablishment of epithelial cell polarity10/210031/187231.48e-031.23e-0210
GO:00716927EndometriumAEHprotein localization to extracellular region58/2100368/187234.72e-033.00e-0258
GO:00093068EndometriumAEHprotein secretion56/2100359/187236.71e-033.94e-0256
GO:00355928EndometriumAEHestablishment of protein localization to extracellular region56/2100360/187237.10e-034.09e-0256
GO:190495116EndometriumEECpositive regulation of establishment of protein localization74/2168319/187232.90e-092.10e-0774
GO:000716315EndometriumEECestablishment or maintenance of cell polarity56/2168218/187235.41e-093.57e-0756
GO:005122216EndometriumEECpositive regulation of protein transport66/2168303/187232.55e-071.09e-0566
GO:003001014EndometriumEECestablishment of cell polarity36/2168143/187234.57e-061.15e-0436
GO:005105111EndometriumEECnegative regulation of transport80/2168470/187232.53e-042.93e-0380
GO:005070813EndometriumEECregulation of protein secretion50/2168268/187234.33e-044.51e-0350
GO:009016213EndometriumEECestablishment of epithelial cell polarity10/216831/187231.89e-031.45e-0210
GO:005071412EndometriumEECpositive regulation of protein secretion28/2168137/187231.89e-031.45e-0228
GO:007169213EndometriumEECprotein localization to extracellular region59/2168368/187235.98e-033.56e-0259
Page: 1 2 3 4 5 6 7 

check button Enriched KEGG pathways.
Pathway IDTissueDisease StageDescriptionGene RatioBg Ratiopvaluep.adjustqvalueCount
Page: 1 

Top

Cell-cell communication analysis

check buttonIdentification of potential cell-cell interactions between two cell types and their ligand-receptor pairs for different disease states
LigandReceptorLRpairPathwayTissueDisease Stage
Page: 1 

Top

Single-cell gene regulatory network inference analysis

check buttonFind out the significant the regulons (TFs) and the target genes of each regulon across cell types for different disease states
TFCell TypeTissueDisease StageTarget GeneRSSRegulon Activity
∗The dot plots of a searched regulon are shown for all cell subpopulations in each disease state of each tissue based on the regulon specific score inferred using pySCENIC and by calculating the average expression.
Page: 1 

Top

Somatic mutation of malignant transformation related genes

check buttonAnnotation of somatic variants for genes involved in malignant transformation
Hugo SymbolVariant ClassVariant ClassificationdbSNP RSHGVScHGVSpHGVSp ShortSWISSPROTBIOTYPESIFTPolyPhenTumor Sample BarcodeTissueHistologySexAgeStageTherapy TypesDrugsOutcome
FRMD4ASNVMissense_Mutationc.188N>Cp.Ile63Thrp.I63TQ9P2Q2protein_codingtolerated(0.05)probably_damaging(0.966)TCGA-A1-A0SG-01Breastbreast invasive carcinomaFemale<65I/IIChemotherapySD
FRMD4ASNVMissense_Mutationnovelc.829N>Ap.Pro277Thrp.P277TQ9P2Q2protein_codingtolerated(0.07)benign(0.046)TCGA-A2-A0CL-01Breastbreast invasive carcinomaFemale<65III/IVChemotherapycytoxanSD
FRMD4ASNVMissense_Mutationnovelc.1404G>Tp.Glu468Aspp.E468DQ9P2Q2protein_codingtolerated(0.32)possibly_damaging(0.489)TCGA-AO-A0J3-01Breastbreast invasive carcinomaFemale>=65I/IIChemotherapycyclophosphamideSD
FRMD4ASNVMissense_Mutationc.397N>Tp.Val133Phep.V133FQ9P2Q2protein_codingdeleterious(0.05)possibly_damaging(0.896)TCGA-BH-A0C0-01Breastbreast invasive carcinomaFemale<65I/IIChemotherapycarboplatinSD
FRMD4ASNVMissense_Mutationc.232N>Tp.Asp78Tyrp.D78YQ9P2Q2protein_codingdeleterious(0)probably_damaging(0.998)TCGA-BH-A0HP-01Breastbreast invasive carcinomaFemale>=65III/IVChemotherapydoxorubicinSD
FRMD4AinsertionFrame_Shift_Insnovelc.1614_1615insTCTTGGGAAATTCTTAAAAAAACAGAACTGATCCCTCCCCCAACCCCp.Ala539SerfsTer94p.A539Sfs*94Q9P2Q2protein_codingTCGA-A2-A0CP-01Breastbreast invasive carcinomaFemale<65I/IIChemotherapycytoxanSD
FRMD4ASNVMissense_Mutationnovelc.2768C>Tp.Ala923Valp.A923VQ9P2Q2protein_codingtolerated(0.19)benign(0.001)TCGA-2W-A8YY-01Cervixcervical & endocervical cancerFemale<65I/IIChemotherapycisplatinCR
FRMD4ASNVMissense_Mutationc.1553G>Ap.Arg518Hisp.R518HQ9P2Q2protein_codingdeleterious(0)possibly_damaging(0.908)TCGA-2W-A8YY-01Cervixcervical & endocervical cancerFemale<65I/IIChemotherapycisplatinCR
FRMD4ASNVMissense_Mutationc.637C>Gp.Leu213Valp.L213VQ9P2Q2protein_codingdeleterious(0.04)possibly_damaging(0.842)TCGA-JW-A5VJ-01Cervixcervical & endocervical cancerFemale<65I/IIUnknownUnknownPD
FRMD4ASNVMissense_Mutationc.185N>Ap.Gly62Glup.G62EQ9P2Q2protein_codingdeleterious(0)probably_damaging(1)TCGA-LP-A4AV-01Cervixcervical & endocervical cancerFemale<65I/IIUnknownUnknownSD
Page: 1 2 3 4 5 6 7 8 9 10 11 

Top

Related drugs of malignant transformation related genes

check buttonIdentification of chemicals and drugs interact with genes involved in malignant transfromation
(DGIdb 4.0)
Entrez IDSymbolCategoryInteraction TypesDrug Claim NameDrug NamePMIDs
Page: 1