
|
|||||
|
 | |
| |
| |
| |
| |
| |
|
Gene: FRK |
Gene summary for FRK |
| Gene information | Species | Human | Gene symbol | FRK | Gene ID | 2444 |
| Gene name | fyn related Src family tyrosine kinase | |
| Gene Alias | GTK | |
| Cytomap | 6q22.1 | |
| Gene Type | protein-coding | GO ID | GO:0000122 | UniProtAcc | P42685 |
Top |
Malignant transformation analysis |
| Identification of the aberrant gene expression in precancerous and cancerous lesions by comparing the gene expression of stem-like cells in diseased tissues with normal stem cells |
| Entrez ID | Symbol | Replicates | Species | Organ | Tissue | Adj P-value | Log2FC | Malignancy |
| 2444 | FRK | CCI_1 | Human | Cervix | CC | 3.09e-07 | 7.16e-01 | 0.528 |
| 2444 | FRK | CCI_2 | Human | Cervix | CC | 1.52e-02 | 5.13e-01 | 0.5249 |
| 2444 | FRK | CCI_3 | Human | Cervix | CC | 6.78e-15 | 9.02e-01 | 0.516 |
| 2444 | FRK | HTA11_3410_2000001011 | Human | Colorectum | AD | 8.29e-14 | -5.62e-01 | 0.0155 |
| 2444 | FRK | HTA11_78_2000001011 | Human | Colorectum | AD | 4.69e-02 | -3.74e-01 | -0.1088 |
| 2444 | FRK | HTA11_696_2000001011 | Human | Colorectum | AD | 3.51e-04 | -3.25e-01 | -0.1464 |
| 2444 | FRK | HTA11_866_2000001011 | Human | Colorectum | AD | 2.87e-07 | -3.75e-01 | -0.1001 |
| 2444 | FRK | HTA11_1391_2000001011 | Human | Colorectum | AD | 4.22e-02 | -3.91e-01 | -0.059 |
| 2444 | FRK | HTA11_866_3004761011 | Human | Colorectum | AD | 3.98e-05 | -4.11e-01 | 0.096 |
| 2444 | FRK | HTA11_10711_2000001011 | Human | Colorectum | AD | 6.05e-03 | -4.68e-01 | 0.0338 |
| 2444 | FRK | HTA11_7696_3000711011 | Human | Colorectum | AD | 1.06e-12 | -4.60e-01 | 0.0674 |
| 2444 | FRK | HTA11_6818_2000001021 | Human | Colorectum | AD | 4.82e-02 | -4.65e-01 | 0.0588 |
| 2444 | FRK | HTA11_99999970781_79442 | Human | Colorectum | MSS | 2.49e-09 | -3.83e-01 | 0.294 |
| 2444 | FRK | HTA11_99999971662_82457 | Human | Colorectum | MSS | 8.64e-08 | -3.66e-01 | 0.3859 |
| 2444 | FRK | HTA11_99999974143_84620 | Human | Colorectum | MSS | 5.12e-23 | -5.48e-01 | 0.3005 |
| 2444 | FRK | A001-C-207 | Human | Colorectum | FAP | 6.89e-03 | -2.99e-01 | 0.1278 |
| 2444 | FRK | A015-C-203 | Human | Colorectum | FAP | 1.45e-25 | -3.20e-01 | -0.1294 |
| 2444 | FRK | A014-C-040 | Human | Colorectum | FAP | 1.37e-04 | -5.65e-01 | -0.1184 |
| 2444 | FRK | A002-C-201 | Human | Colorectum | FAP | 1.33e-09 | -3.44e-01 | 0.0324 |
| 2444 | FRK | A002-C-203 | Human | Colorectum | FAP | 4.62e-06 | -2.25e-01 | 0.2786 |
| Page: 1 2 3 |
| Tissue | Expression Dynamics | Abbreviation |
| Cervix | 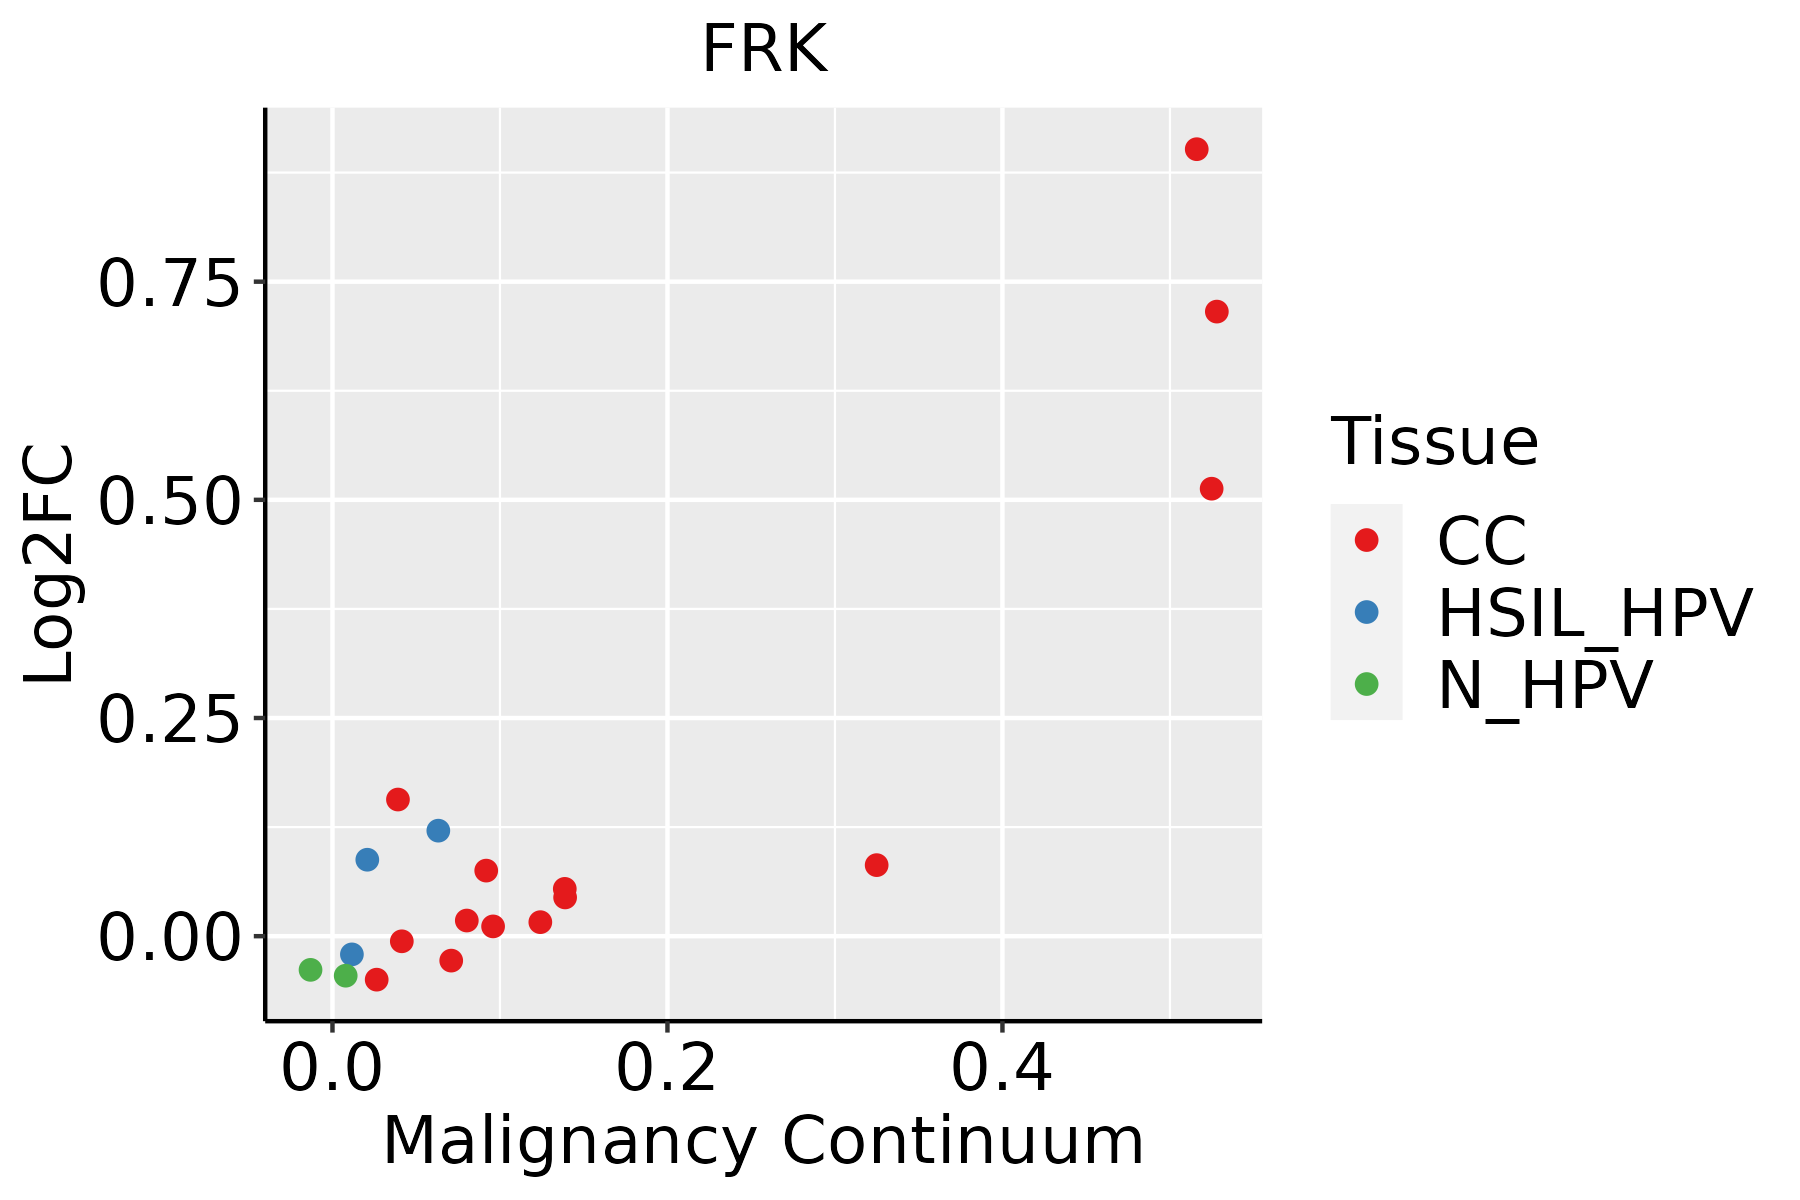 | CC: Cervix cancer |
| HSIL_HPV: HPV-infected high-grade squamous intraepithelial lesions | ||
| N_HPV: HPV-infected normal cervix | ||
| Colorectum (GSE201348) |  | FAP: Familial adenomatous polyposis |
| CRC: Colorectal cancer | ||
| Colorectum (HTA11) |  | AD: Adenomas |
| SER: Sessile serrated lesions | ||
| MSI-H: Microsatellite-high colorectal cancer | ||
| MSS: Microsatellite stable colorectal cancer | ||
| Lung | 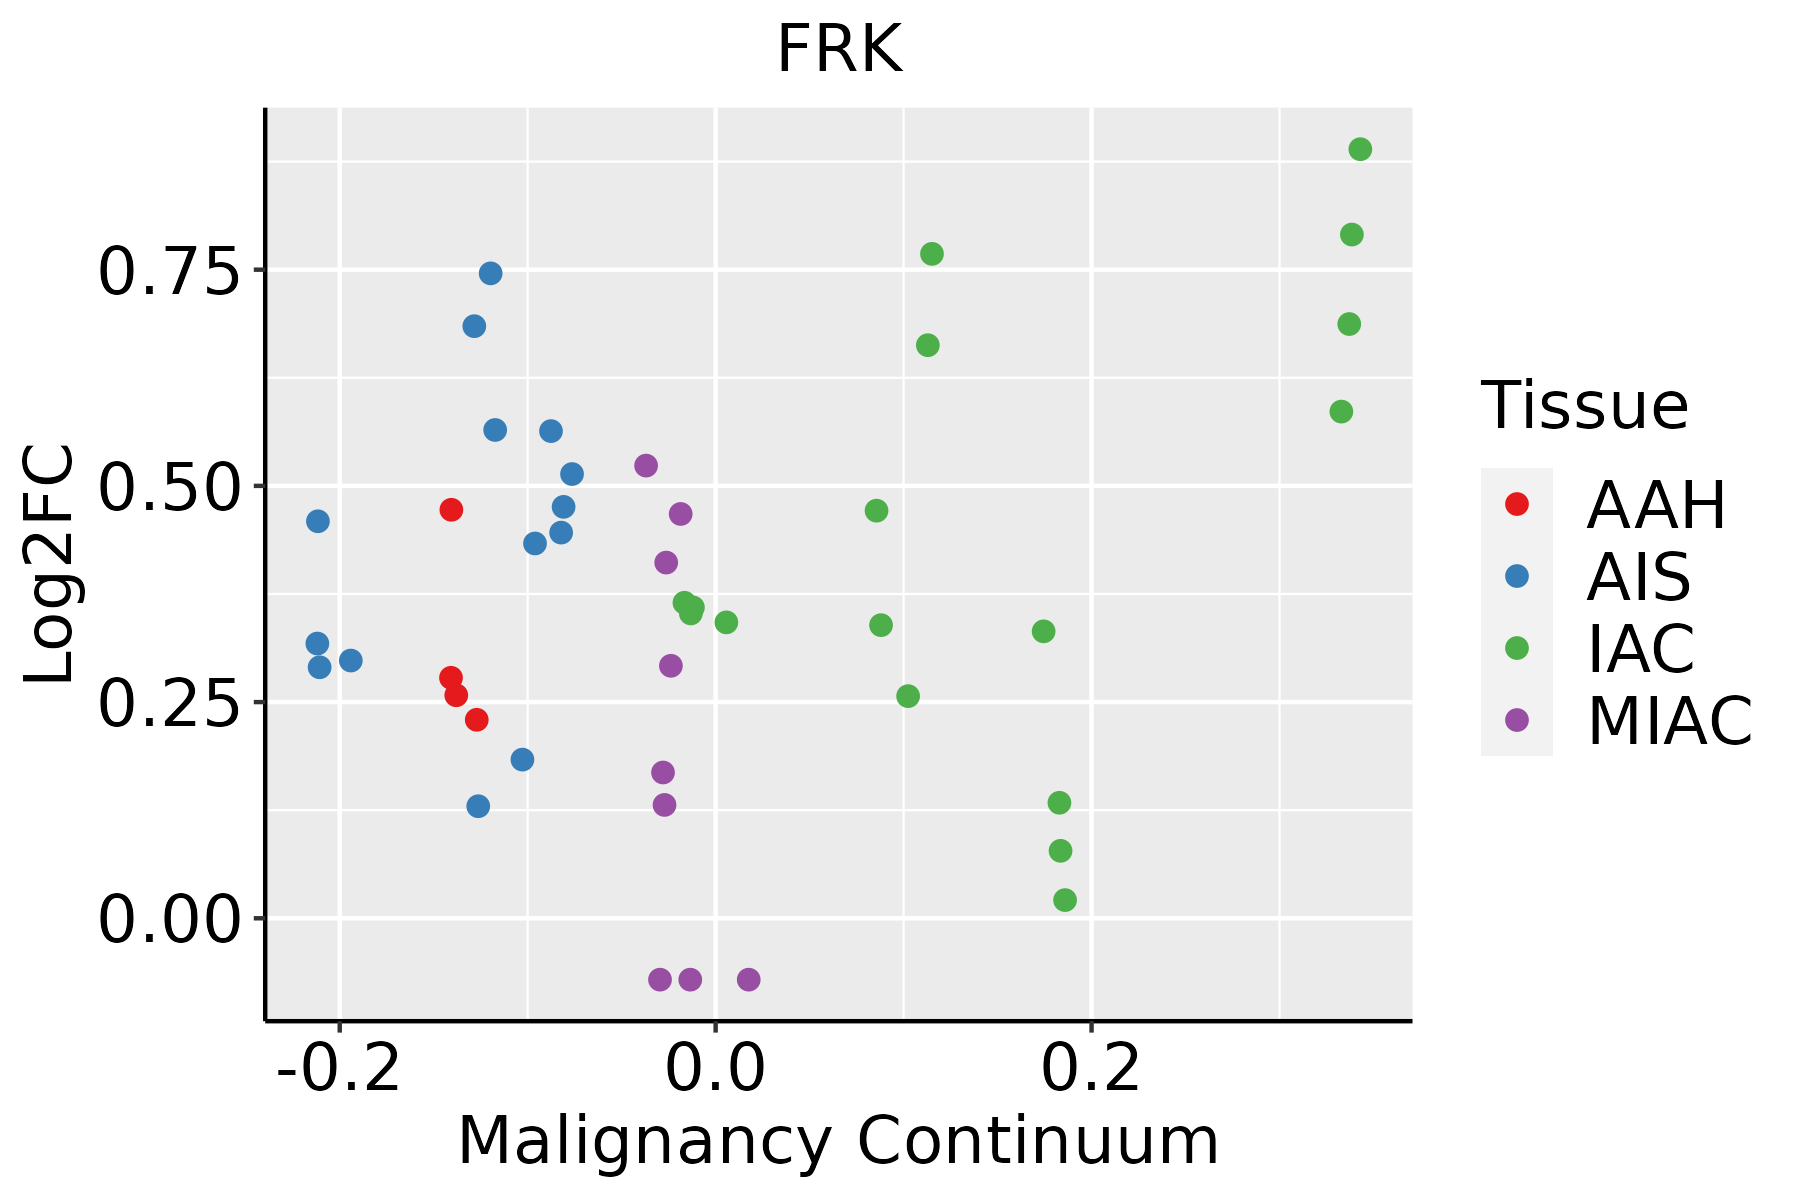 | AAH: Atypical adenomatous hyperplasia |
| AIS: Adenocarcinoma in situ | ||
| IAC: Invasive lung adenocarcinoma | ||
| MIA: Minimally invasive adenocarcinoma |
| ∗log2FC in expression of this searched gene in stem-like cells from each diseased tissue sample relative to stem-like cells in normal samples in each tissue plotted against the malignancy continuum. Samples are colored based on if they are from different disease stage. |
Top |
Malignant transformation related pathway analysis |
| Find out the enriched GO biological processes and KEGG pathways involved in transition from healthy to precancer to cancer |
| Tissue | Disease Stage | Enriched GO biological Processes |
| Colorectum | AD |  |
| Colorectum | SER |  |
| Colorectum | MSS |  |
| Colorectum | MSI-H |  |
| Colorectum | FAP |  |
| ∗Top 15 enriched GO BP terms are showed in the bar plot of each disease state in each tissue. Each row represents a significant GO biological process which is colored according to the -log10(p.adjust). |
| Page: 1 2 3 4 5 6 7 8 9 |
| GO ID | Tissue | Disease Stage | Description | Gene Ratio | Bg Ratio | pvalue | p.adjust | Count |
| GO:00063101 | Esophagus | ESCC | DNA recombination | 168/8552 | 305/18723 | 5.58e-04 | 3.05e-03 | 168 |
| GO:0018212 | Lung | AIS | peptidyl-tyrosine modification | 56/1849 | 378/18723 | 1.35e-03 | 1.68e-02 | 56 |
| GO:0018108 | Lung | AIS | peptidyl-tyrosine phosphorylation | 55/1849 | 375/18723 | 1.87e-03 | 2.08e-02 | 55 |
| GO:0006310 | Oral cavity | OSCC | DNA recombination | 147/7305 | 305/18723 | 6.33e-04 | 3.56e-03 | 147 |
| Page: 1 |
| Pathway ID | Tissue | Disease Stage | Description | Gene Ratio | Bg Ratio | pvalue | p.adjust | qvalue | Count |
| Page: 1 |
Top |
Cell-cell communication analysis |
| Identification of potential cell-cell interactions between two cell types and their ligand-receptor pairs for different disease states |
| Ligand | Receptor | LRpair | Pathway | Tissue | Disease Stage |
| Page: 1 |
Top |
Single-cell gene regulatory network inference analysis |
| Find out the significant the regulons (TFs) and the target genes of each regulon across cell types for different disease states |
| TF | Cell Type | Tissue | Disease Stage | Target Gene | RSS | Regulon Activity |
| ∗The dot plots of a searched regulon are shown for all cell subpopulations in each disease state of each tissue based on the regulon specific score inferred using pySCENIC and by calculating the average expression. |
| Page: 1 |
Top |
Somatic mutation of malignant transformation related genes |
| Annotation of somatic variants for genes involved in malignant transformation |
| Hugo Symbol | Variant Class | Variant Classification | dbSNP RS | HGVSc | HGVSp | HGVSp Short | SWISSPROT | BIOTYPE | SIFT | PolyPhen | Tumor Sample Barcode | Tissue | Histology | Sex | Age | Stage | Therapy Types | Drugs | Outcome |
| FRK | SNV | Missense_Mutation | c.191N>C | p.Arg64Pro | p.R64P | P42685 | protein_coding | deleterious(0.02) | benign(0.406) | TCGA-E2-A1IG-01 | Breast | breast invasive carcinoma | Female | <65 | I/II | Chemotherapy | cyclophosphamide | SD | |
| FRK | SNV | Missense_Mutation | c.1443N>T | p.Glu481Asp | p.E481D | P42685 | protein_coding | tolerated(0.16) | possibly_damaging(0.85) | TCGA-FU-A3HZ-01 | Cervix | cervical & endocervical cancer | Female | <65 | I/II | Chemotherapy | cisplatin | CR | |
| FRK | SNV | Missense_Mutation | c.1348N>C | p.Tyr450His | p.Y450H | P42685 | protein_coding | deleterious(0) | probably_damaging(1) | TCGA-AA-3811-01 | Colorectum | colon adenocarcinoma | Female | >=65 | III/IV | Unknown | Unknown | PD | |
| FRK | SNV | Missense_Mutation | novel | c.807N>T | p.Met269Ile | p.M269I | P42685 | protein_coding | deleterious(0.01) | probably_damaging(0.998) | TCGA-AA-3984-01 | Colorectum | colon adenocarcinoma | Female | <65 | I/II | Unknown | Unknown | SD |
| FRK | SNV | Missense_Mutation | c.536N>A | p.Arg179Gln | p.R179Q | P42685 | protein_coding | tolerated(0.39) | benign(0.019) | TCGA-AA-3984-01 | Colorectum | colon adenocarcinoma | Female | <65 | I/II | Unknown | Unknown | SD | |
| FRK | SNV | Missense_Mutation | c.11T>C | p.Ile4Thr | p.I4T | P42685 | protein_coding | tolerated_low_confidence(0.09) | benign(0) | TCGA-AA-A00N-01 | Colorectum | colon adenocarcinoma | Male | >=65 | I/II | Unknown | Unknown | PD | |
| FRK | SNV | Missense_Mutation | novel | c.1364C>T | p.Pro455Leu | p.P455L | P42685 | protein_coding | deleterious(0.02) | probably_damaging(1) | TCGA-AM-5821-01 | Colorectum | colon adenocarcinoma | Female | >=65 | I/II | Unknown | Unknown | SD |
| FRK | SNV | Missense_Mutation | novel | c.1363C>G | p.Pro455Ala | p.P455A | P42685 | protein_coding | deleterious(0.02) | probably_damaging(0.999) | TCGA-AM-5821-01 | Colorectum | colon adenocarcinoma | Female | >=65 | I/II | Unknown | Unknown | SD |
| FRK | SNV | Missense_Mutation | c.381N>T | p.Glu127Asp | p.E127D | P42685 | protein_coding | deleterious(0.03) | possibly_damaging(0.567) | TCGA-CA-6718-01 | Colorectum | colon adenocarcinoma | Male | <65 | I/II | Unknown | Unknown | PD | |
| FRK | SNV | Missense_Mutation | c.824N>C | p.Leu275Pro | p.L275P | P42685 | protein_coding | deleterious(0) | probably_damaging(1) | TCGA-CK-5916-01 | Colorectum | colon adenocarcinoma | Female | >=65 | I/II | Unknown | Unknown | PD |
| Page: 1 2 3 4 5 6 |
Top |
Related drugs of malignant transformation related genes |
| Identification of chemicals and drugs interact with genes involved in malignant transfromation |
| (DGIdb 4.0) |
| Entrez ID | Symbol | Category | Interaction Types | Drug Claim Name | Drug Name | PMIDs |
| 2444 | FRK | KINASE, DRUGGABLE GENOME, TYROSINE KINASE, ENZYME | TAMATINIB | R-406 | ||
| 2444 | FRK | KINASE, DRUGGABLE GENOME, TYROSINE KINASE, ENZYME | inhibitor | NINTEDANIB | NINTEDANIB | |
| 2444 | FRK | KINASE, DRUGGABLE GENOME, TYROSINE KINASE, ENZYME | RG-1530 | RG-1530 | ||
| 2444 | FRK | KINASE, DRUGGABLE GENOME, TYROSINE KINASE, ENZYME | GEFITINIB | GEFITINIB | ||
| 2444 | FRK | KINASE, DRUGGABLE GENOME, TYROSINE KINASE, ENZYME | ALISERTIB | ALISERTIB | ||
| 2444 | FRK | KINASE, DRUGGABLE GENOME, TYROSINE KINASE, ENZYME | inhibitor | CHEMBL1421 | DASATINIB | |
| 2444 | FRK | KINASE, DRUGGABLE GENOME, TYROSINE KINASE, ENZYME | inhibitor | CHEMBL1980297 | ILORASERTIB | |
| 2444 | FRK | KINASE, DRUGGABLE GENOME, TYROSINE KINASE, ENZYME | IMATINIB | IMATINIB | ||
| 2444 | FRK | KINASE, DRUGGABLE GENOME, TYROSINE KINASE, ENZYME | inhibitor | CHEMBL3545085 | XL-228 | |
| 2444 | FRK | KINASE, DRUGGABLE GENOME, TYROSINE KINASE, ENZYME | ILORASERTIB | ILORASERTIB |
| Page: 1 2 3 4 |

Copyright 2023-Present -The University of Texas Health Science Center at Houston |