
|
|||||
|
 | |
| |
| |
| |
| |
| |
|
Gene: FRG1 |
Gene summary for FRG1 |
| Gene information | Species | Human | Gene symbol | FRG1 | Gene ID | 2483 |
| Gene name | FSHD region gene 1 | |
| Gene Alias | FRG1A | |
| Cytomap | 4q35.2 | |
| Gene Type | protein-coding | GO ID | GO:0000375 | UniProtAcc | Q14331 |
Top |
Malignant transformation analysis |
| Identification of the aberrant gene expression in precancerous and cancerous lesions by comparing the gene expression of stem-like cells in diseased tissues with normal stem cells |
| Entrez ID | Symbol | Replicates | Species | Organ | Tissue | Adj P-value | Log2FC | Malignancy |
| 2483 | FRG1 | LZE4T | Human | Esophagus | ESCC | 3.65e-09 | 1.11e-01 | 0.0811 |
| 2483 | FRG1 | LZE5T | Human | Esophagus | ESCC | 4.54e-07 | 2.00e-01 | 0.0514 |
| 2483 | FRG1 | LZE7T | Human | Esophagus | ESCC | 5.11e-04 | 4.71e-01 | 0.0667 |
| 2483 | FRG1 | LZE8T | Human | Esophagus | ESCC | 4.23e-02 | 7.08e-02 | 0.067 |
| 2483 | FRG1 | LZE20T | Human | Esophagus | ESCC | 4.51e-03 | -1.80e-02 | 0.0662 |
| 2483 | FRG1 | LZE22T | Human | Esophagus | ESCC | 3.12e-02 | 6.48e-02 | 0.068 |
| 2483 | FRG1 | LZE24T | Human | Esophagus | ESCC | 4.99e-13 | 4.38e-02 | 0.0596 |
| 2483 | FRG1 | LZE6T | Human | Esophagus | ESCC | 3.36e-08 | 1.53e-01 | 0.0845 |
| 2483 | FRG1 | P1T-E | Human | Esophagus | ESCC | 2.21e-06 | 2.64e-01 | 0.0875 |
| 2483 | FRG1 | P2T-E | Human | Esophagus | ESCC | 6.18e-24 | 4.23e-01 | 0.1177 |
| 2483 | FRG1 | P4T-E | Human | Esophagus | ESCC | 2.64e-18 | 2.87e-01 | 0.1323 |
| 2483 | FRG1 | P5T-E | Human | Esophagus | ESCC | 4.62e-16 | 1.52e-01 | 0.1327 |
| 2483 | FRG1 | P8T-E | Human | Esophagus | ESCC | 1.05e-22 | 3.03e-01 | 0.0889 |
| 2483 | FRG1 | P9T-E | Human | Esophagus | ESCC | 3.01e-14 | 3.32e-01 | 0.1131 |
| 2483 | FRG1 | P10T-E | Human | Esophagus | ESCC | 1.25e-20 | 3.10e-01 | 0.116 |
| 2483 | FRG1 | P11T-E | Human | Esophagus | ESCC | 1.24e-14 | 2.00e-01 | 0.1426 |
| 2483 | FRG1 | P12T-E | Human | Esophagus | ESCC | 9.72e-31 | 5.77e-01 | 0.1122 |
| 2483 | FRG1 | P15T-E | Human | Esophagus | ESCC | 6.66e-14 | 1.66e-01 | 0.1149 |
| 2483 | FRG1 | P16T-E | Human | Esophagus | ESCC | 2.70e-25 | 2.48e-01 | 0.1153 |
| 2483 | FRG1 | P17T-E | Human | Esophagus | ESCC | 6.91e-08 | 2.68e-01 | 0.1278 |
| Page: 1 2 3 4 5 6 |
| Tissue | Expression Dynamics | Abbreviation |
| Esophagus |  | ESCC: Esophageal squamous cell carcinoma |
| HGIN: High-grade intraepithelial neoplasias | ||
| LGIN: Low-grade intraepithelial neoplasias | ||
| Oral Cavity | 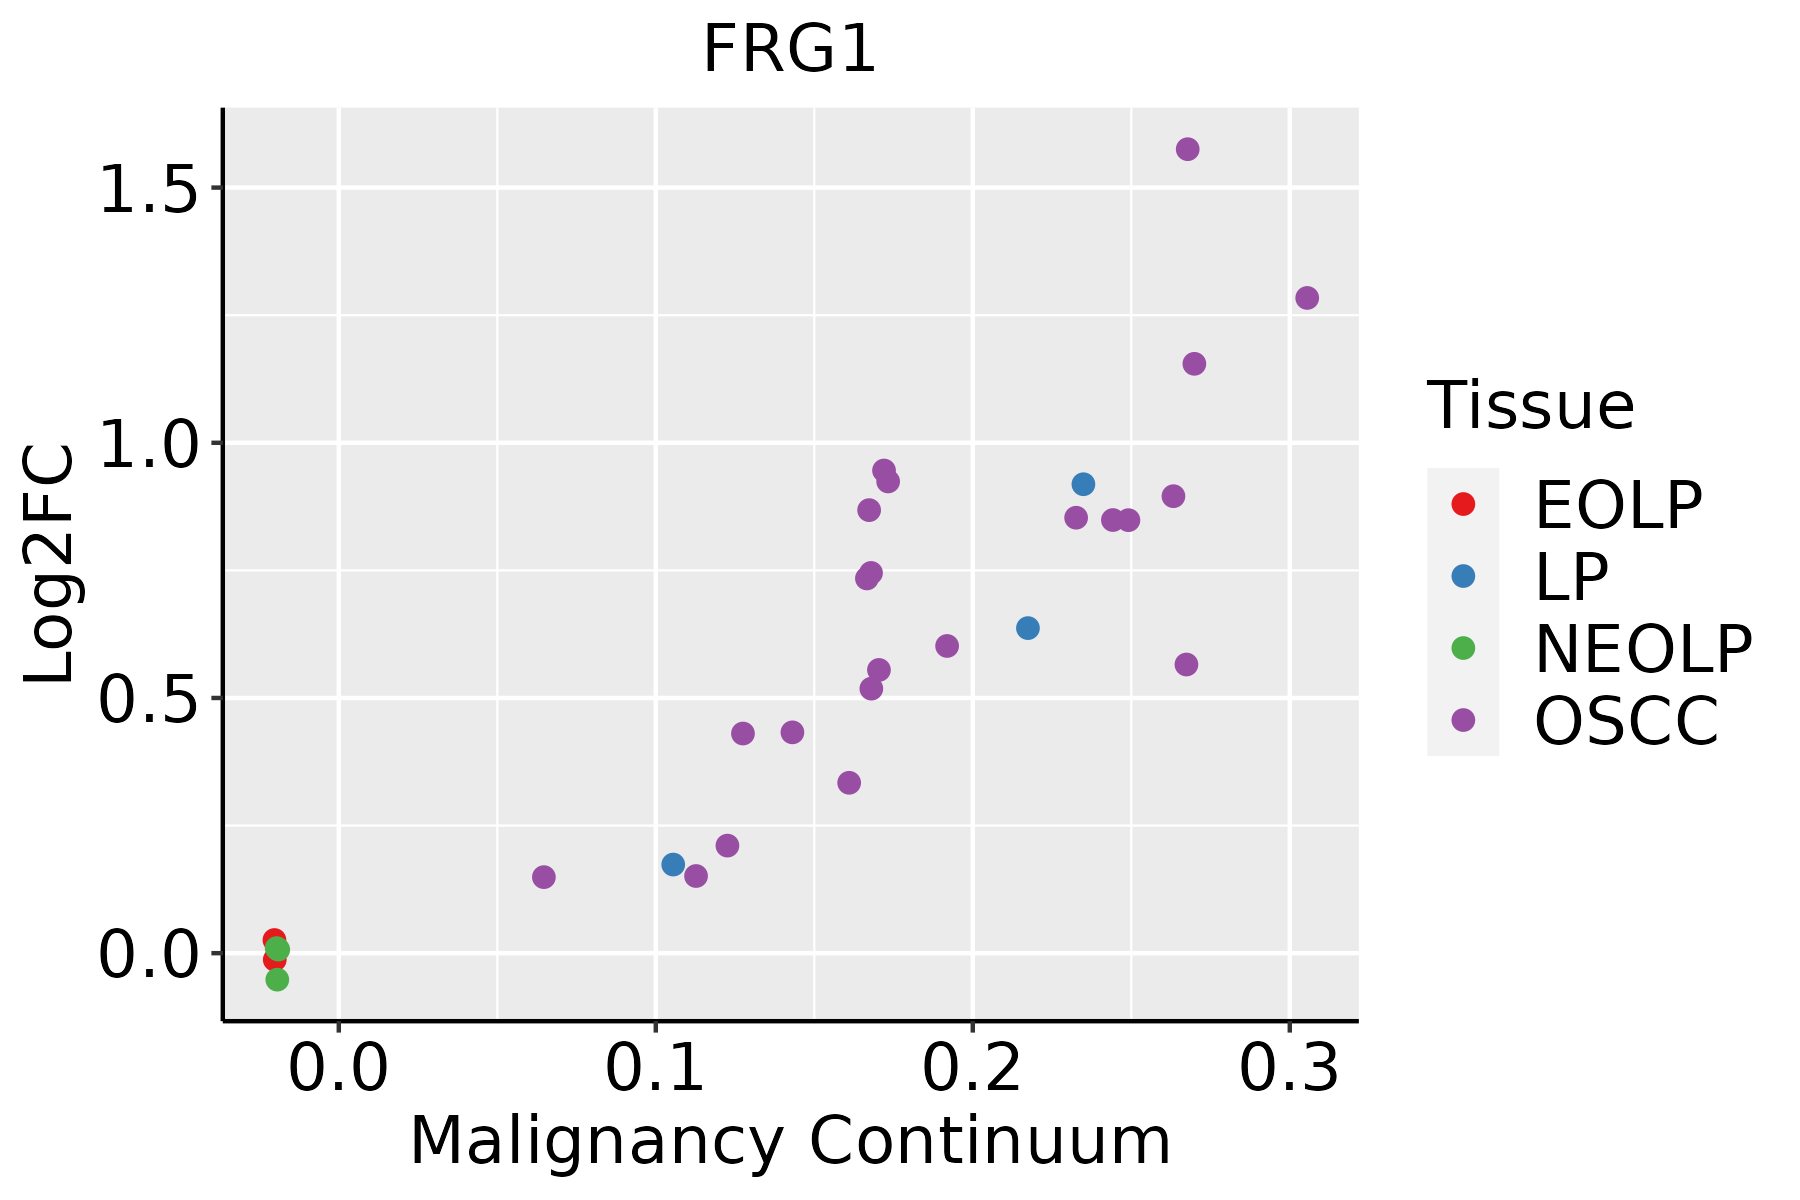 | EOLP: Erosive Oral lichen planus |
| LP: leukoplakia | ||
| NEOLP: Non-erosive oral lichen planus | ||
| OSCC: Oral squamous cell carcinoma | ||
| Skin | 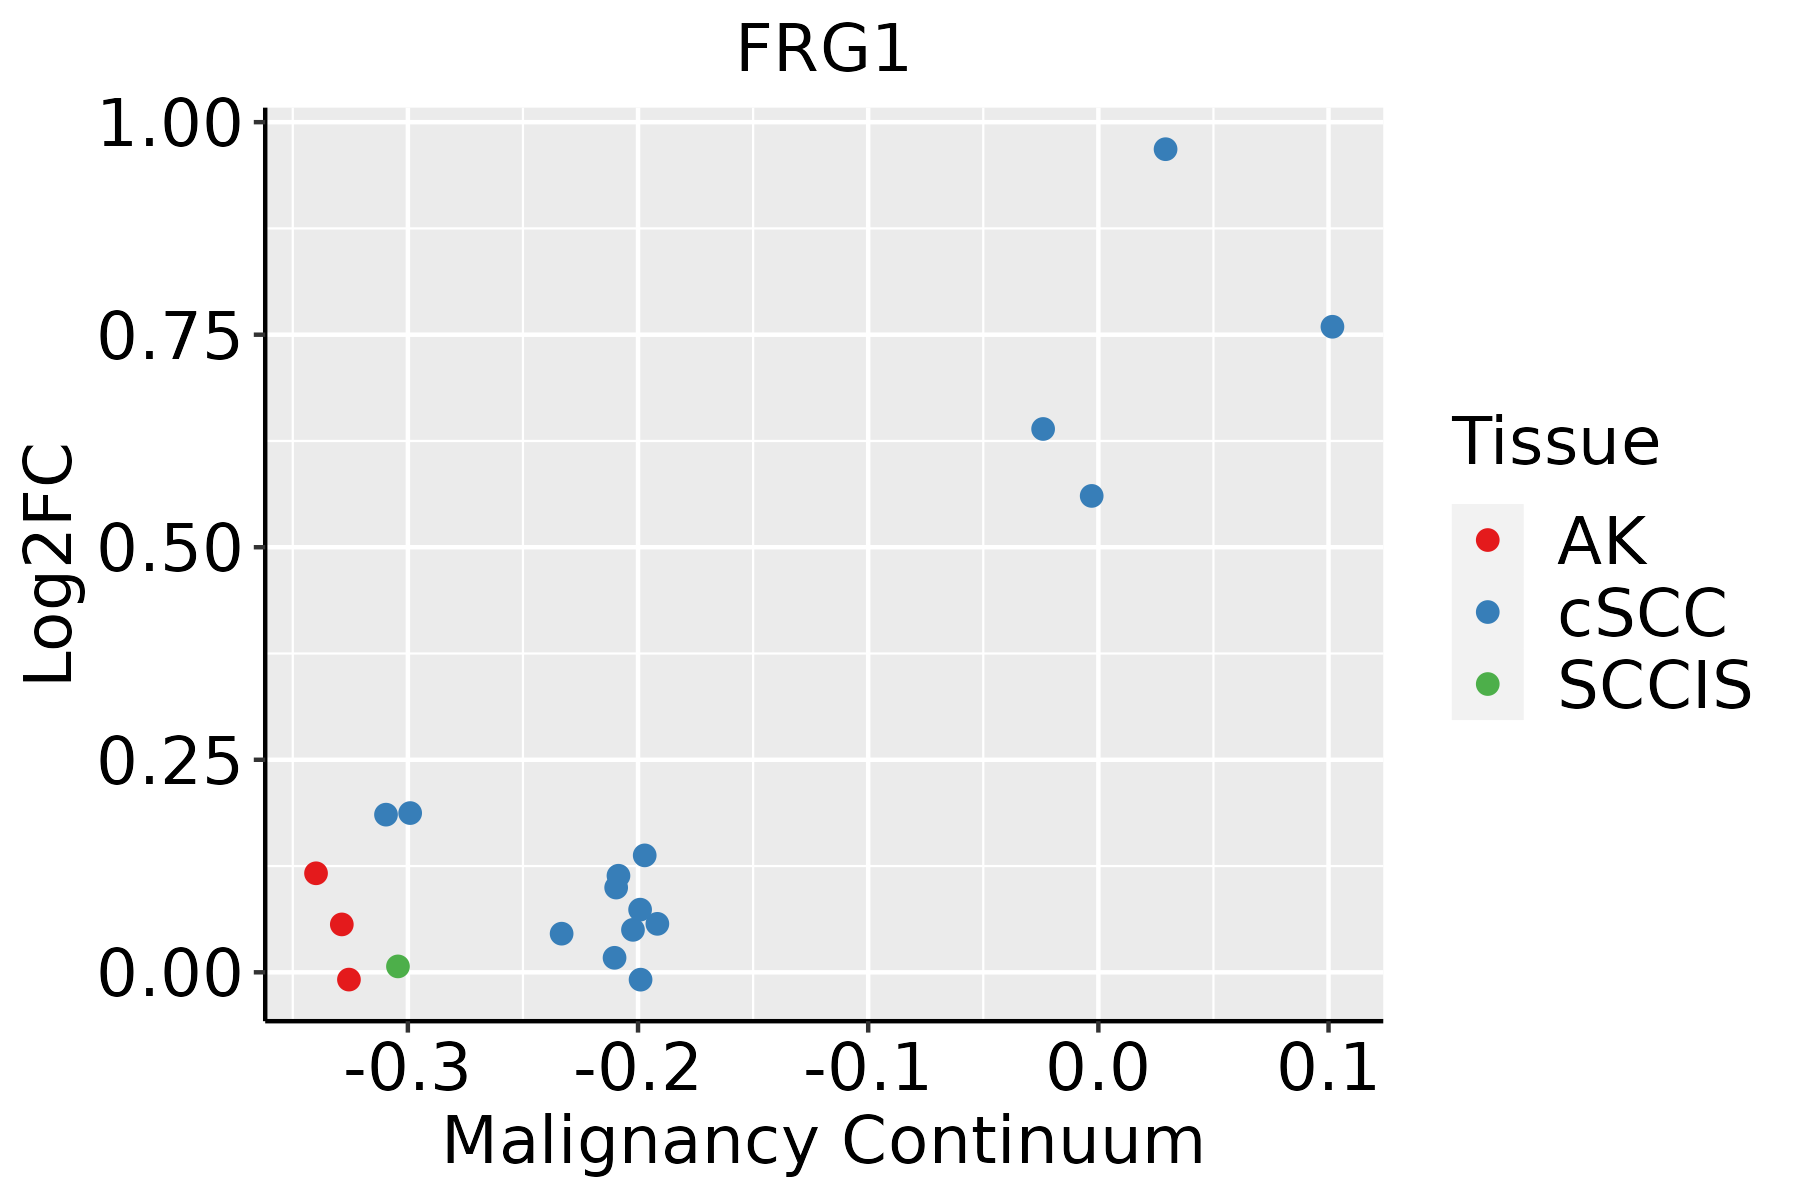 | AK: Actinic keratosis |
| cSCC: Cutaneous squamous cell carcinoma | ||
| SCCIS:squamous cell carcinoma in situ | ||
| Thyroid |  | ATC: Anaplastic thyroid cancer |
| HT: Hashimoto's thyroiditis | ||
| PTC: Papillary thyroid cancer |
| ∗log2FC in expression of this searched gene in stem-like cells from each diseased tissue sample relative to stem-like cells in normal samples in each tissue plotted against the malignancy continuum. Samples are colored based on if they are from different disease stage. |
Top |
Malignant transformation related pathway analysis |
| Find out the enriched GO biological processes and KEGG pathways involved in transition from healthy to precancer to cancer |
| Tissue | Disease Stage | Enriched GO biological Processes |
| Colorectum | AD |  |
| Colorectum | SER |  |
| Colorectum | MSS |  |
| Colorectum | MSI-H |  |
| Colorectum | FAP |  |
| ∗Top 15 enriched GO BP terms are showed in the bar plot of each disease state in each tissue. Each row represents a significant GO biological process which is colored according to the -log10(p.adjust). |
| Page: 1 2 3 4 5 6 7 8 9 |
| GO ID | Tissue | Disease Stage | Description | Gene Ratio | Bg Ratio | pvalue | p.adjust | Count |
| GO:0022613111 | Esophagus | ESCC | ribonucleoprotein complex biogenesis | 365/8552 | 463/18723 | 1.74e-49 | 1.11e-45 | 365 |
| GO:0042254111 | Esophagus | ESCC | ribosome biogenesis | 252/8552 | 299/18723 | 3.27e-44 | 1.04e-40 | 252 |
| GO:0008380111 | Esophagus | ESCC | RNA splicing | 336/8552 | 434/18723 | 1.74e-42 | 3.67e-39 | 336 |
| GO:003447015 | Esophagus | ESCC | ncRNA processing | 300/8552 | 395/18723 | 3.09e-35 | 3.26e-32 | 300 |
| GO:0016072110 | Esophagus | ESCC | rRNA metabolic process | 197/8552 | 236/18723 | 1.31e-33 | 1.18e-30 | 197 |
| GO:0006364110 | Esophagus | ESCC | rRNA processing | 189/8552 | 225/18723 | 4.88e-33 | 3.87e-30 | 189 |
| GO:003466012 | Esophagus | ESCC | ncRNA metabolic process | 346/8552 | 485/18723 | 4.35e-31 | 2.51e-28 | 346 |
| GO:0000375111 | Esophagus | ESCC | RNA splicing, via transesterification reactions | 248/8552 | 324/18723 | 3.05e-30 | 1.49e-27 | 248 |
| GO:0000377111 | Esophagus | ESCC | RNA splicing, via transesterification reactions with bulged adenosine as nucleophile | 244/8552 | 320/18723 | 2.52e-29 | 1.07e-26 | 244 |
| GO:0000398111 | Esophagus | ESCC | mRNA splicing, via spliceosome | 244/8552 | 320/18723 | 2.52e-29 | 1.07e-26 | 244 |
| GO:002261320 | Oral cavity | OSCC | ribonucleoprotein complex biogenesis | 333/7305 | 463/18723 | 8.28e-48 | 5.24e-44 | 333 |
| GO:000838020 | Oral cavity | OSCC | RNA splicing | 308/7305 | 434/18723 | 2.43e-42 | 7.70e-39 | 308 |
| GO:004225420 | Oral cavity | OSCC | ribosome biogenesis | 230/7305 | 299/18723 | 3.22e-41 | 6.80e-38 | 230 |
| GO:000636410 | Oral cavity | OSCC | rRNA processing | 172/7305 | 225/18723 | 1.57e-30 | 1.24e-27 | 172 |
| GO:00344709 | Oral cavity | OSCC | ncRNA processing | 263/7305 | 395/18723 | 4.38e-29 | 2.78e-26 | 263 |
| GO:000037519 | Oral cavity | OSCC | RNA splicing, via transesterification reactions | 225/7305 | 324/18723 | 5.20e-29 | 2.99e-26 | 225 |
| GO:001607210 | Oral cavity | OSCC | rRNA metabolic process | 176/7305 | 236/18723 | 6.51e-29 | 3.24e-26 | 176 |
| GO:000037719 | Oral cavity | OSCC | RNA splicing, via transesterification reactions with bulged adenosine as nucleophile | 221/7305 | 320/18723 | 5.50e-28 | 2.18e-25 | 221 |
| GO:000039819 | Oral cavity | OSCC | mRNA splicing, via spliceosome | 221/7305 | 320/18723 | 5.50e-28 | 2.18e-25 | 221 |
| GO:00346605 | Oral cavity | OSCC | ncRNA metabolic process | 296/7305 | 485/18723 | 2.94e-23 | 6.65e-21 | 296 |
| Page: 1 2 3 4 |
| Pathway ID | Tissue | Disease Stage | Description | Gene Ratio | Bg Ratio | pvalue | p.adjust | qvalue | Count |
| Page: 1 |
Top |
Cell-cell communication analysis |
| Identification of potential cell-cell interactions between two cell types and their ligand-receptor pairs for different disease states |
| Ligand | Receptor | LRpair | Pathway | Tissue | Disease Stage |
| Page: 1 |
Top |
Single-cell gene regulatory network inference analysis |
| Find out the significant the regulons (TFs) and the target genes of each regulon across cell types for different disease states |
| TF | Cell Type | Tissue | Disease Stage | Target Gene | RSS | Regulon Activity |
| ∗The dot plots of a searched regulon are shown for all cell subpopulations in each disease state of each tissue based on the regulon specific score inferred using pySCENIC and by calculating the average expression. |
| Page: 1 |
Top |
Somatic mutation of malignant transformation related genes |
| Annotation of somatic variants for genes involved in malignant transformation |
| Hugo Symbol | Variant Class | Variant Classification | dbSNP RS | HGVSc | HGVSp | HGVSp Short | SWISSPROT | BIOTYPE | SIFT | PolyPhen | Tumor Sample Barcode | Tissue | Histology | Sex | Age | Stage | Therapy Types | Drugs | Outcome |
| FRG1 | SNV | Missense_Mutation | rs376125311 | c.47N>A | p.Gly16Glu | p.G16E | Q14331 | protein_coding | deleterious(0) | probably_damaging(0.931) | TCGA-AC-A23H-01 | Breast | breast invasive carcinoma | Female | >=65 | I/II | Unknown | Unknown | PD |
| FRG1 | SNV | Missense_Mutation | novel | c.295G>A | p.Ala99Thr | p.A99T | Q14331 | protein_coding | deleterious(0.04) | probably_damaging(0.994) | TCGA-AN-A046-01 | Breast | breast invasive carcinoma | Female | >=65 | I/II | Unknown | Unknown | SD |
| FRG1 | SNV | Missense_Mutation | rs200624002 | c.220N>A | p.Asp74Asn | p.D74N | Q14331 | protein_coding | deleterious(0.02) | benign(0.141) | TCGA-AR-A256-01 | Breast | breast invasive carcinoma | Female | <65 | I/II | Chemotherapy | doxorubicin | PD |
| FRG1 | SNV | Missense_Mutation | c.350N>G | p.Leu117Arg | p.L117R | Q14331 | protein_coding | deleterious(0) | probably_damaging(0.999) | TCGA-B6-A0WV-01 | Breast | breast invasive carcinoma | Female | >=65 | I/II | Unknown | Unknown | SD | |
| FRG1 | SNV | Missense_Mutation | c.459N>A | p.Asn153Lys | p.N153K | Q14331 | protein_coding | deleterious(0) | probably_damaging(0.993) | TCGA-BH-A1FU-01 | Breast | breast invasive carcinoma | Female | <65 | I/II | Unknown | Unknown | PD | |
| FRG1 | SNV | Missense_Mutation | c.92G>T | p.Arg31Ile | p.R31I | Q14331 | protein_coding | deleterious(0.03) | benign(0.308) | TCGA-A6-6141-01 | Colorectum | colon adenocarcinoma | Male | <65 | I/II | Chemotherapy | 5-fu | SD | |
| FRG1 | SNV | Missense_Mutation | c.685N>G | p.Lys229Glu | p.K229E | Q14331 | protein_coding | tolerated(0.69) | benign(0.031) | TCGA-DY-A1DF-01 | Colorectum | rectum adenocarcinoma | Female | >=65 | III/IV | Unknown | Unknown | SD | |
| FRG1 | SNV | Missense_Mutation | rs748595063 | c.302A>G | p.Lys101Arg | p.K101R | Q14331 | protein_coding | tolerated(0.22) | benign(0.08) | TCGA-AP-A054-01 | Endometrium | uterine corpus endometrioid carcinoma | Female | <65 | III/IV | Chemotherapy | carboplatin | PD |
| FRG1 | SNV | Missense_Mutation | rs75585360 | c.383N>A | p.Arg128His | p.R128H | Q14331 | protein_coding | deleterious(0.02) | benign(0.057) | TCGA-AP-A0LT-01 | Endometrium | uterine corpus endometrioid carcinoma | Female | <65 | I/II | Unknown | Unknown | SD |
| FRG1 | SNV | Missense_Mutation | novel | c.601A>T | p.Asn201Tyr | p.N201Y | Q14331 | protein_coding | deleterious(0.01) | probably_damaging(0.914) | TCGA-AX-A06F-01 | Endometrium | uterine corpus endometrioid carcinoma | Female | <65 | III/IV | Chemotherapy | carboplatin | SD |
| Page: 1 2 3 |
Top |
Related drugs of malignant transformation related genes |
| Identification of chemicals and drugs interact with genes involved in malignant transfromation |
| (DGIdb 4.0) |
| Entrez ID | Symbol | Category | Interaction Types | Drug Claim Name | Drug Name | PMIDs |
| Page: 1 |

Copyright 2023-Present -The University of Texas Health Science Center at Houston |