
|
|||||
|
 | |
| |
| |
| |
| |
| |
|
Gene: FREM2 |
Gene summary for FREM2 |
| Gene information | Species | Human | Gene symbol | FREM2 | Gene ID | 341640 |
| Gene name | FRAS1 related extracellular matrix 2 | |
| Gene Alias | CRYPTOP | |
| Cytomap | 13q13.3 | |
| Gene Type | protein-coding | GO ID | GO:0001654 | UniProtAcc | Q5SZK8 |
Top |
Malignant transformation analysis |
| Identification of the aberrant gene expression in precancerous and cancerous lesions by comparing the gene expression of stem-like cells in diseased tissues with normal stem cells |
| Entrez ID | Symbol | Replicates | Species | Organ | Tissue | Adj P-value | Log2FC | Malignancy |
| 341640 | FREM2 | RNA-P25T1-P25T1-1 | Human | Lung | AIS | 6.77e-08 | 5.13e-01 | -0.2116 |
| 341640 | FREM2 | RNA-P25T1-P25T1-2 | Human | Lung | AIS | 7.32e-03 | 5.61e-01 | -0.1941 |
| 341640 | FREM2 | RNA-P25T1-P25T1-4 | Human | Lung | AIS | 6.02e-04 | 4.99e-01 | -0.2119 |
| Page: 1 |
| Tissue | Expression Dynamics | Abbreviation |
| Lung | 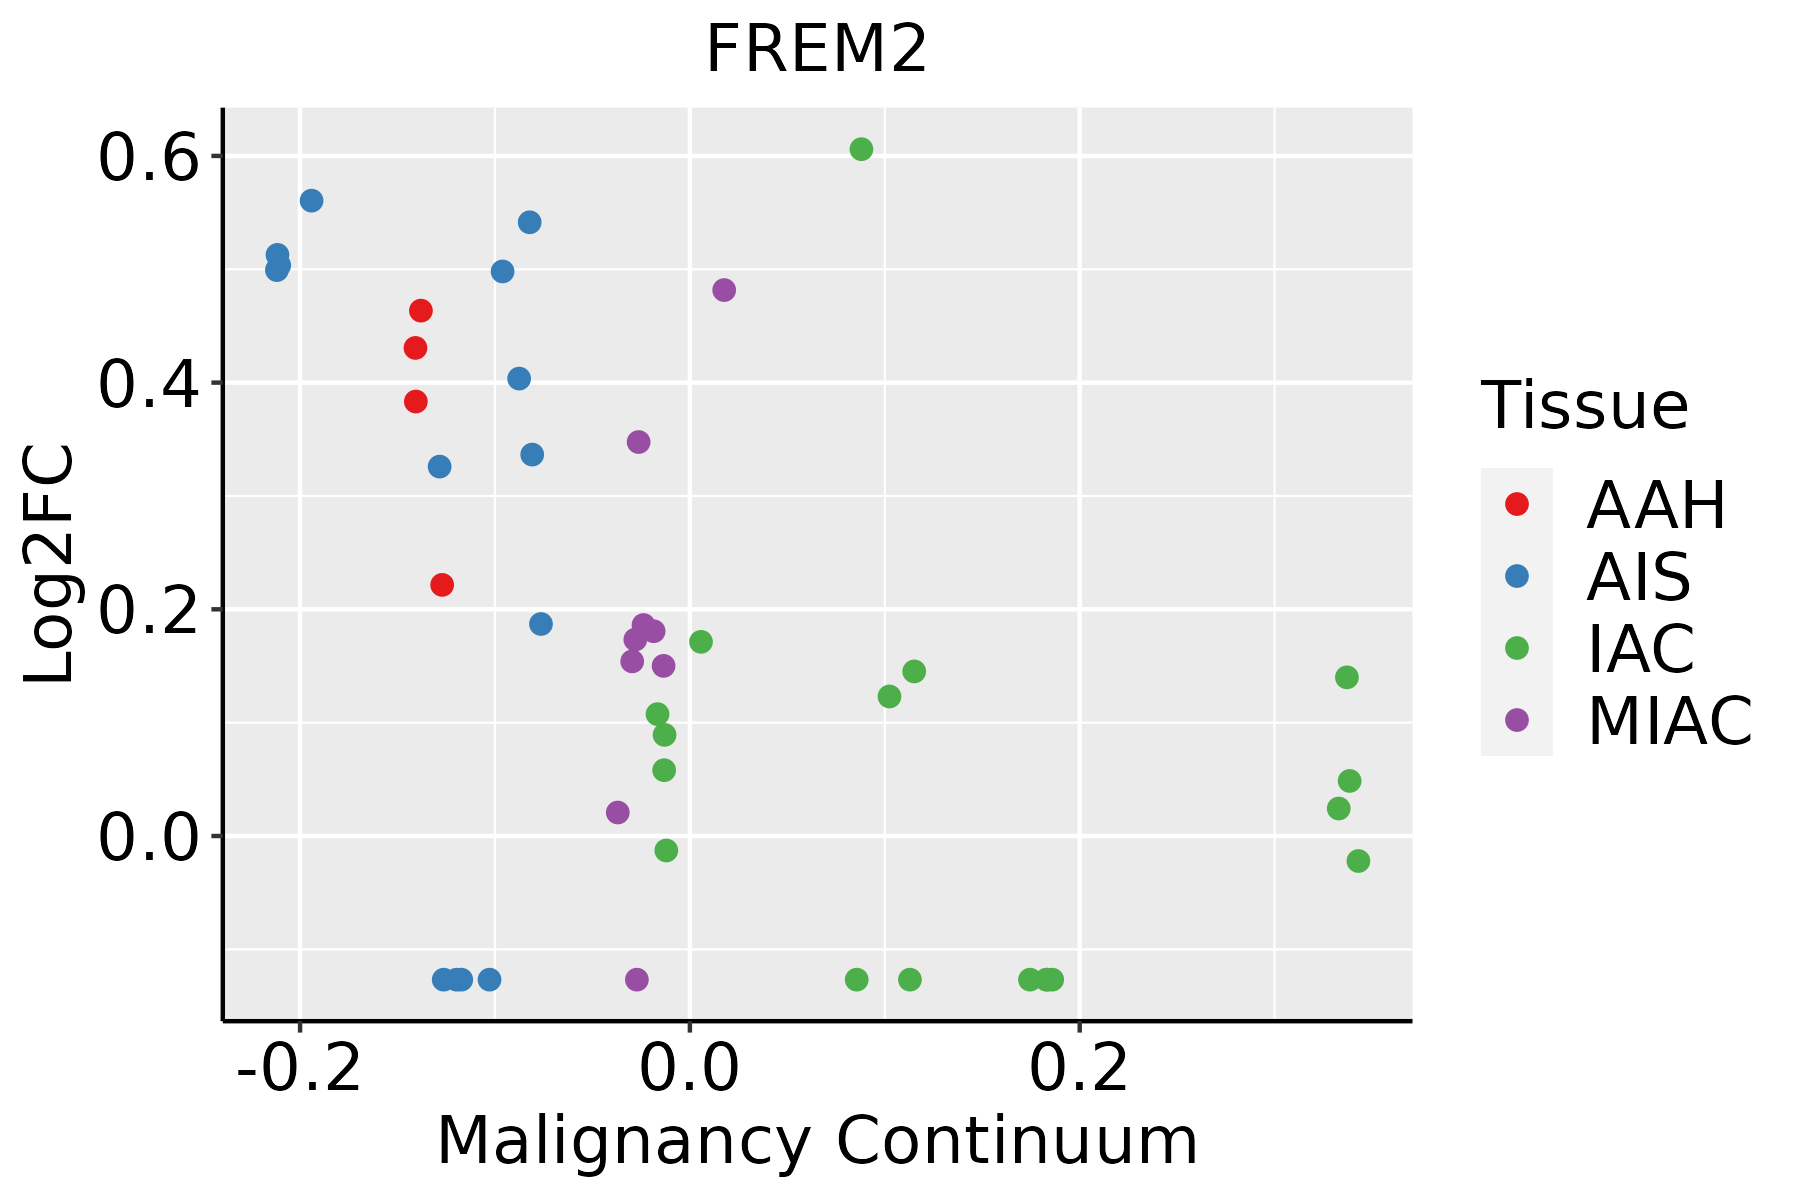 | AAH: Atypical adenomatous hyperplasia |
| AIS: Adenocarcinoma in situ | ||
| IAC: Invasive lung adenocarcinoma | ||
| MIA: Minimally invasive adenocarcinoma |
| ∗log2FC in expression of this searched gene in stem-like cells from each diseased tissue sample relative to stem-like cells in normal samples in each tissue plotted against the malignancy continuum. Samples are colored based on if they are from different disease stage. |
Top |
Malignant transformation related pathway analysis |
| Find out the enriched GO biological processes and KEGG pathways involved in transition from healthy to precancer to cancer |
| Tissue | Disease Stage | Enriched GO biological Processes |
| Colorectum | AD |  |
| Colorectum | SER |  |
| Colorectum | MSS |  |
| Colorectum | MSI-H |  |
| Colorectum | FAP |  |
| ∗Top 15 enriched GO BP terms are showed in the bar plot of each disease state in each tissue. Each row represents a significant GO biological process which is colored according to the -log10(p.adjust). |
| Page: 1 2 3 4 5 6 7 8 9 |
| GO ID | Tissue | Disease Stage | Description | Gene Ratio | Bg Ratio | pvalue | p.adjust | Count |
| GO:000165511 | Lung | AIS | urogenital system development | 63/1849 | 338/18723 | 5.46e-07 | 4.08e-05 | 63 |
| GO:000182211 | Lung | AIS | kidney development | 53/1849 | 293/18723 | 1.04e-05 | 4.25e-04 | 53 |
| GO:007200111 | Lung | AIS | renal system development | 54/1849 | 302/18723 | 1.21e-05 | 4.71e-04 | 54 |
| Page: 1 |
| Pathway ID | Tissue | Disease Stage | Description | Gene Ratio | Bg Ratio | pvalue | p.adjust | qvalue | Count |
| hsa045122 | Lung | AIS | ECM-receptor interaction | 20/961 | 89/8465 | 1.95e-03 | 1.26e-02 | 8.09e-03 | 20 |
| hsa045123 | Lung | AIS | ECM-receptor interaction | 20/961 | 89/8465 | 1.95e-03 | 1.26e-02 | 8.09e-03 | 20 |
| Page: 1 |
Top |
Cell-cell communication analysis |
| Identification of potential cell-cell interactions between two cell types and their ligand-receptor pairs for different disease states |
| Ligand | Receptor | LRpair | Pathway | Tissue | Disease Stage |
| Page: 1 |
Top |
Single-cell gene regulatory network inference analysis |
| Find out the significant the regulons (TFs) and the target genes of each regulon across cell types for different disease states |
| TF | Cell Type | Tissue | Disease Stage | Target Gene | RSS | Regulon Activity |
| ∗The dot plots of a searched regulon are shown for all cell subpopulations in each disease state of each tissue based on the regulon specific score inferred using pySCENIC and by calculating the average expression. |
| Page: 1 |
Top |
Somatic mutation of malignant transformation related genes |
| Annotation of somatic variants for genes involved in malignant transformation |
| Hugo Symbol | Variant Class | Variant Classification | dbSNP RS | HGVSc | HGVSp | HGVSp Short | SWISSPROT | BIOTYPE | SIFT | PolyPhen | Tumor Sample Barcode | Tissue | Histology | Sex | Age | Stage | Therapy Types | Drugs | Outcome |
| FREM2 | SNV | Missense_Mutation | novel | c.6848N>T | p.Ser2283Leu | p.S2283L | Q5SZK8 | protein_coding | deleterious(0) | probably_damaging(0.962) | TCGA-A2-A25A-01 | Breast | breast invasive carcinoma | Female | <65 | I/II | Unspecific | Cytoxan | SD |
| FREM2 | SNV | Missense_Mutation | rs149553690 | c.9245N>A | p.Arg3082His | p.R3082H | Q5SZK8 | protein_coding | tolerated(0.12) | benign(0.019) | TCGA-A2-A25A-01 | Breast | breast invasive carcinoma | Female | <65 | I/II | Unspecific | Cytoxan | SD |
| FREM2 | SNV | Missense_Mutation | rs532760237 | c.6012A>C | p.Lys2004Asn | p.K2004N | Q5SZK8 | protein_coding | tolerated(0.52) | benign(0.185) | TCGA-A8-A07W-01 | Breast | breast invasive carcinoma | Female | >=65 | III/IV | Hormone Therapy | exemestane | SD |
| FREM2 | SNV | Missense_Mutation | rs374734549 | c.6718N>G | p.Ile2240Val | p.I2240V | Q5SZK8 | protein_coding | tolerated(0.75) | benign(0.182) | TCGA-A8-A093-01 | Breast | breast invasive carcinoma | Female | <65 | I/II | Hormone Therapy | tamoxiphen | SD |
| FREM2 | SNV | Missense_Mutation | rs192388331 | c.3872N>T | p.Thr1291Met | p.T1291M | Q5SZK8 | protein_coding | tolerated(0.16) | benign(0.031) | TCGA-A8-A0AB-01 | Breast | breast invasive carcinoma | Female | <65 | I/II | Chemotherapy | 5-fluorouracil | CR |
| FREM2 | SNV | Missense_Mutation | c.6733N>A | p.Asp2245Asn | p.D2245N | Q5SZK8 | protein_coding | tolerated(0.19) | benign(0.005) | TCGA-AC-A23H-01 | Breast | breast invasive carcinoma | Female | >=65 | I/II | Unknown | Unknown | PD | |
| FREM2 | SNV | Missense_Mutation | c.8731N>C | p.Tyr2911His | p.Y2911H | Q5SZK8 | protein_coding | tolerated(0.53) | benign(0.005) | TCGA-AC-A23H-01 | Breast | breast invasive carcinoma | Female | >=65 | I/II | Unknown | Unknown | PD | |
| FREM2 | SNV | Missense_Mutation | novel | c.5459N>C | p.Gly1820Ala | p.G1820A | Q5SZK8 | protein_coding | deleterious(0.02) | benign(0.236) | TCGA-AC-A2BK-01 | Breast | breast invasive carcinoma | Female | >=65 | III/IV | Chemotherapy | cytoxan | CR |
| FREM2 | SNV | Missense_Mutation | novel | c.9089N>T | p.Arg3030Ile | p.R3030I | Q5SZK8 | protein_coding | deleterious(0) | probably_damaging(0.999) | TCGA-AN-A046-01 | Breast | breast invasive carcinoma | Female | >=65 | I/II | Unknown | Unknown | SD |
| FREM2 | SNV | Missense_Mutation | c.3833T>C | p.Val1278Ala | p.V1278A | Q5SZK8 | protein_coding | tolerated(0.18) | benign(0.001) | TCGA-AN-A0AK-01 | Breast | breast invasive carcinoma | Female | >=65 | I/II | Unknown | Unknown | SD |
| Page: 1 2 3 4 5 6 7 8 9 10 11 12 13 14 15 16 17 18 19 20 21 22 23 24 25 26 27 28 29 30 31 32 33 34 35 36 37 |
Top |
Related drugs of malignant transformation related genes |
| Identification of chemicals and drugs interact with genes involved in malignant transfromation |
| (DGIdb 4.0) |
| Entrez ID | Symbol | Category | Interaction Types | Drug Claim Name | Drug Name | PMIDs |
| Page: 1 |

Copyright 2023-Present -The University of Texas Health Science Center at Houston |