
|
|||||
|
 | |
| |
| |
| |
| |
| |
|
Gene: FREM1 |
Gene summary for FREM1 |
| Gene information | Species | Human | Gene symbol | FREM1 | Gene ID | 158326 |
| Gene name | FRAS1 related extracellular matrix 1 | |
| Gene Alias | BNAR | |
| Cytomap | 9p22.3 | |
| Gene Type | protein-coding | GO ID | GO:0001501 | UniProtAcc | Q5H8C1 |
Top |
Malignant transformation analysis |
| Identification of the aberrant gene expression in precancerous and cancerous lesions by comparing the gene expression of stem-like cells in diseased tissues with normal stem cells |
| Entrez ID | Symbol | Replicates | Species | Organ | Tissue | Adj P-value | Log2FC | Malignancy |
| 158326 | FREM1 | HTA11_1938_2000001011 | Human | Colorectum | AD | 3.67e-02 | 3.29e-01 | -0.0811 |
| 158326 | FREM1 | HTA11_6818_2000001021 | Human | Colorectum | AD | 1.26e-05 | 4.66e-01 | 0.0588 |
| 158326 | FREM1 | HTA11_99999970781_79442 | Human | Colorectum | MSS | 9.81e-35 | 8.34e-01 | 0.294 |
| 158326 | FREM1 | HTA11_99999965062_69753 | Human | Colorectum | MSI-H | 4.57e-09 | 1.78e+00 | 0.3487 |
| 158326 | FREM1 | HTA11_99999965104_69814 | Human | Colorectum | MSS | 2.40e-28 | 1.17e+00 | 0.281 |
| 158326 | FREM1 | HTA11_99999971662_82457 | Human | Colorectum | MSS | 1.13e-69 | 1.82e+00 | 0.3859 |
| 158326 | FREM1 | HTA11_99999974143_84620 | Human | Colorectum | MSS | 4.24e-04 | 2.42e-01 | 0.3005 |
| 158326 | FREM1 | A015-C-202 | Human | Colorectum | FAP | 3.41e-09 | 4.58e-01 | -0.0849 |
| 158326 | FREM1 | CRC-3-11773 | Human | Colorectum | CRC | 1.05e-06 | 3.67e-01 | 0.2564 |
| 158326 | FREM1 | S014 | Human | Liver | HCC | 1.30e-13 | 6.25e-01 | 0.2254 |
| 158326 | FREM1 | S015 | Human | Liver | HCC | 2.89e-12 | 7.01e-01 | 0.2375 |
| 158326 | FREM1 | S016 | Human | Liver | HCC | 2.50e-21 | 7.31e-01 | 0.2243 |
| 158326 | FREM1 | ATC13 | Human | Thyroid | ATC | 3.04e-38 | 8.24e-01 | 0.34 |
| 158326 | FREM1 | ATC5 | Human | Thyroid | ATC | 7.68e-49 | 8.77e-01 | 0.34 |
| Page: 1 |
| Tissue | Expression Dynamics | Abbreviation |
| Colorectum (GSE201348) |  | FAP: Familial adenomatous polyposis |
| CRC: Colorectal cancer | ||
| Colorectum (HTA11) |  | AD: Adenomas |
| SER: Sessile serrated lesions | ||
| MSI-H: Microsatellite-high colorectal cancer | ||
| MSS: Microsatellite stable colorectal cancer | ||
| Liver | 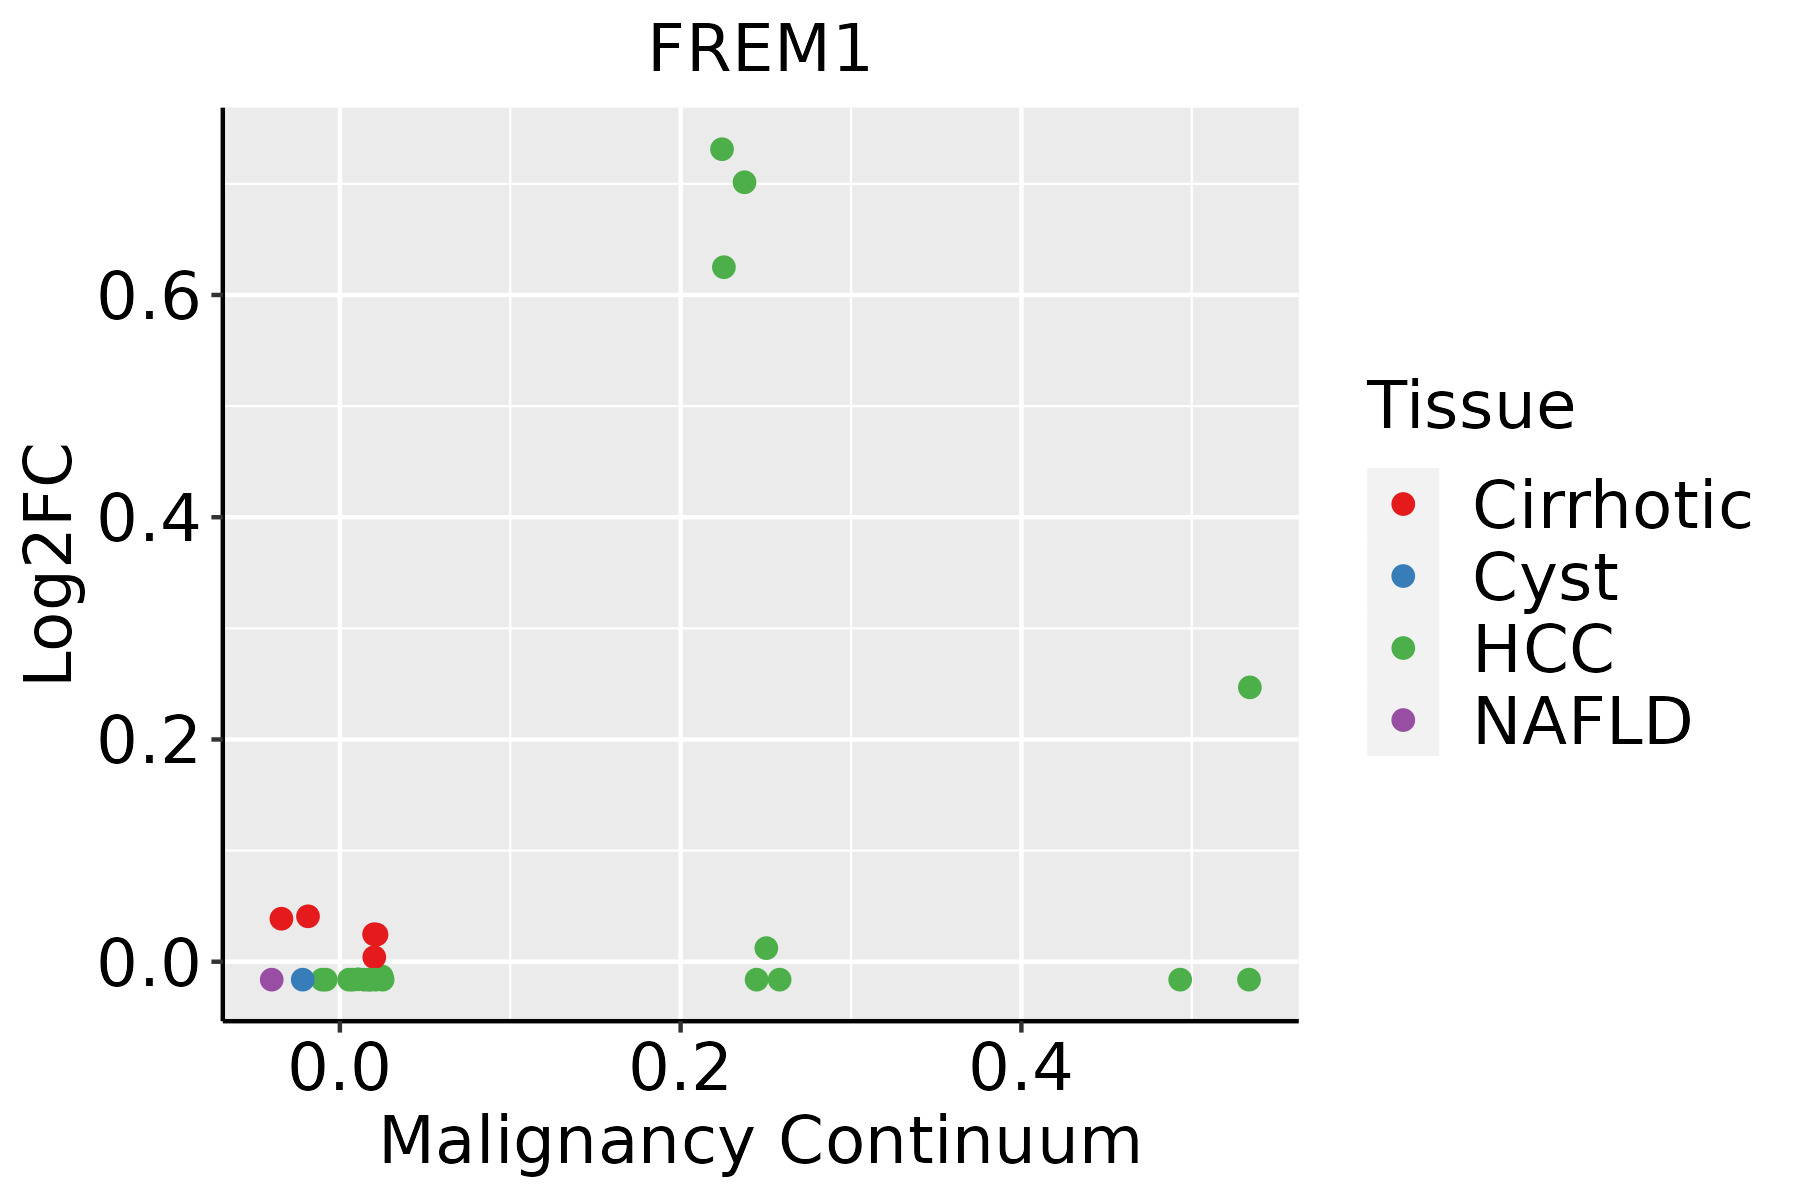 | HCC: Hepatocellular carcinoma |
| NAFLD: Non-alcoholic fatty liver disease | ||
| Thyroid | 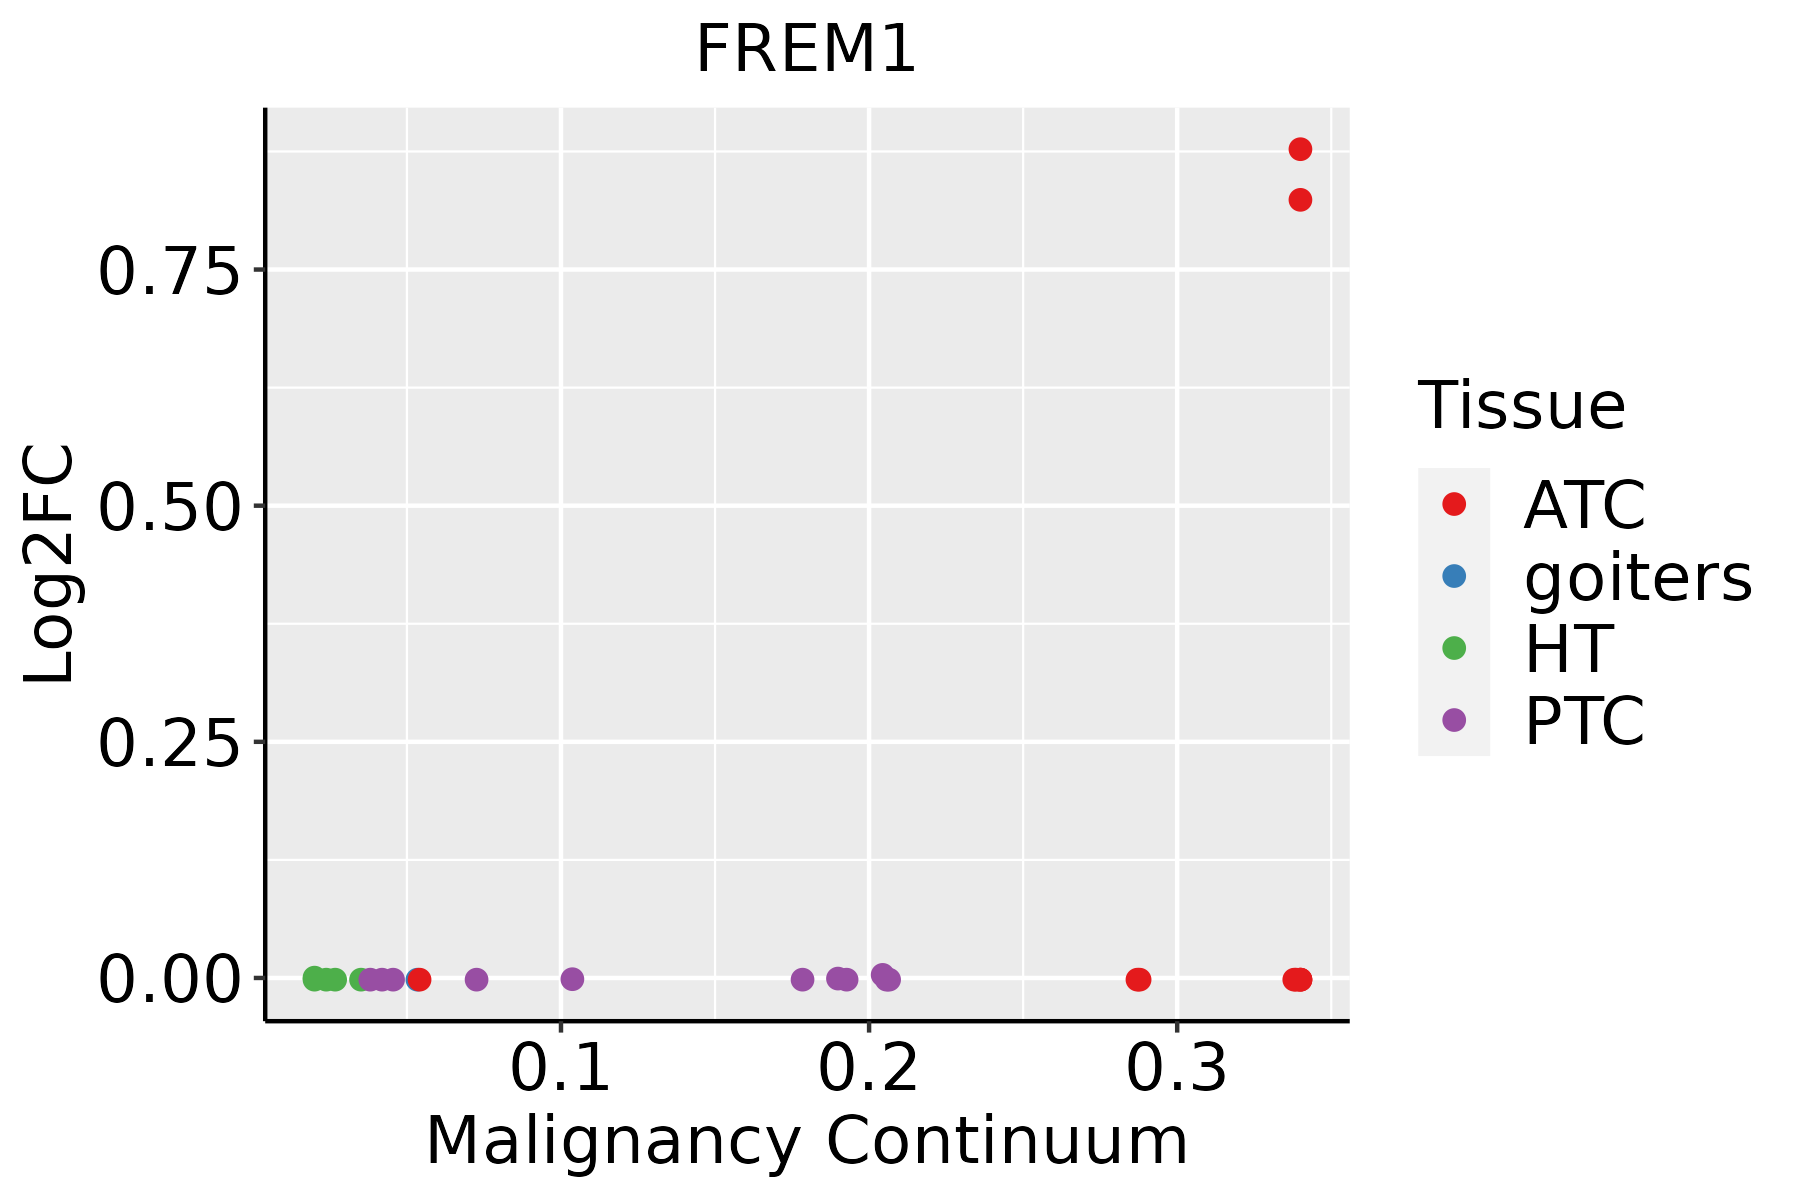 | ATC: Anaplastic thyroid cancer |
| HT: Hashimoto's thyroiditis | ||
| PTC: Papillary thyroid cancer |
| ∗log2FC in expression of this searched gene in stem-like cells from each diseased tissue sample relative to stem-like cells in normal samples in each tissue plotted against the malignancy continuum. Samples are colored based on if they are from different disease stage. |
Top |
Malignant transformation related pathway analysis |
| Find out the enriched GO biological processes and KEGG pathways involved in transition from healthy to precancer to cancer |
| Tissue | Disease Stage | Enriched GO biological Processes |
| Colorectum | AD |  |
| Colorectum | SER |  |
| Colorectum | MSS |  |
| Colorectum | MSI-H |  |
| Colorectum | FAP |  |
| ∗Top 15 enriched GO BP terms are showed in the bar plot of each disease state in each tissue. Each row represents a significant GO biological process which is colored according to the -log10(p.adjust). |
| Page: 1 2 3 4 5 6 7 8 9 |
| GO ID | Tissue | Disease Stage | Description | Gene Ratio | Bg Ratio | pvalue | p.adjust | Count |
| GO:0031589 | Colorectum | AD | cell-substrate adhesion | 116/3918 | 363/18723 | 4.68e-07 | 1.76e-05 | 116 |
| GO:0007160 | Colorectum | AD | cell-matrix adhesion | 75/3918 | 233/18723 | 3.56e-05 | 6.45e-04 | 75 |
| GO:00315892 | Colorectum | MSS | cell-substrate adhesion | 104/3467 | 363/18723 | 1.35e-06 | 4.51e-05 | 104 |
| GO:00071602 | Colorectum | MSS | cell-matrix adhesion | 65/3467 | 233/18723 | 2.77e-04 | 3.67e-03 | 65 |
| GO:00315893 | Colorectum | FAP | cell-substrate adhesion | 93/2622 | 363/18723 | 2.48e-09 | 4.61e-07 | 93 |
| GO:00071603 | Colorectum | FAP | cell-matrix adhesion | 63/2622 | 233/18723 | 1.13e-07 | 7.43e-06 | 63 |
| GO:00315894 | Colorectum | CRC | cell-substrate adhesion | 78/2078 | 363/18723 | 6.22e-09 | 1.49e-06 | 78 |
| GO:00071604 | Colorectum | CRC | cell-matrix adhesion | 50/2078 | 233/18723 | 3.28e-06 | 1.47e-04 | 50 |
| GO:0060348 | Colorectum | CRC | bone development | 37/2078 | 205/18723 | 1.96e-03 | 1.96e-02 | 37 |
| GO:0048705 | Colorectum | CRC | skeletal system morphogenesis | 37/2078 | 220/18723 | 6.58e-03 | 4.71e-02 | 37 |
| GO:003158922 | Liver | HCC | cell-substrate adhesion | 188/7958 | 363/18723 | 2.00e-04 | 1.55e-03 | 188 |
| GO:000716021 | Liver | HCC | cell-matrix adhesion | 123/7958 | 233/18723 | 9.34e-04 | 5.47e-03 | 123 |
| GO:003158928 | Thyroid | ATC | cell-substrate adhesion | 195/6293 | 363/18723 | 1.58e-15 | 1.17e-13 | 195 |
| GO:0007160111 | Thyroid | ATC | cell-matrix adhesion | 128/6293 | 233/18723 | 1.49e-11 | 5.41e-10 | 128 |
| GO:006034813 | Thyroid | ATC | bone development | 102/6293 | 205/18723 | 1.18e-06 | 1.52e-05 | 102 |
| GO:0060349 | Thyroid | ATC | bone morphogenesis | 50/6293 | 93/18723 | 4.87e-05 | 3.88e-04 | 50 |
| GO:00487053 | Thyroid | ATC | skeletal system morphogenesis | 101/6293 | 220/18723 | 9.48e-05 | 6.93e-04 | 101 |
| GO:19048882 | Thyroid | ATC | cranial skeletal system development | 35/6293 | 68/18723 | 1.76e-03 | 8.71e-03 | 35 |
| Page: 1 |
| Pathway ID | Tissue | Disease Stage | Description | Gene Ratio | Bg Ratio | pvalue | p.adjust | qvalue | Count |
| Page: 1 |
Top |
Cell-cell communication analysis |
| Identification of potential cell-cell interactions between two cell types and their ligand-receptor pairs for different disease states |
| Ligand | Receptor | LRpair | Pathway | Tissue | Disease Stage |
| Page: 1 |
Top |
Single-cell gene regulatory network inference analysis |
| Find out the significant the regulons (TFs) and the target genes of each regulon across cell types for different disease states |
| TF | Cell Type | Tissue | Disease Stage | Target Gene | RSS | Regulon Activity |
| ∗The dot plots of a searched regulon are shown for all cell subpopulations in each disease state of each tissue based on the regulon specific score inferred using pySCENIC and by calculating the average expression. |
| Page: 1 |
Top |
Somatic mutation of malignant transformation related genes |
| Annotation of somatic variants for genes involved in malignant transformation |
| Hugo Symbol | Variant Class | Variant Classification | dbSNP RS | HGVSc | HGVSp | HGVSp Short | SWISSPROT | BIOTYPE | SIFT | PolyPhen | Tumor Sample Barcode | Tissue | Histology | Sex | Age | Stage | Therapy Types | Drugs | Outcome |
| FREM1 | SNV | Missense_Mutation | rs369488195 | c.1519N>T | p.Arg507Cys | p.R507C | Q5H8C1 | protein_coding | deleterious(0) | possibly_damaging(0.889) | TCGA-3C-AALK-01 | Breast | breast invasive carcinoma | Female | <65 | I/II | Chemotherapy | docetaxel | SD |
| FREM1 | SNV | Missense_Mutation | novel | c.1436G>A | p.Gly479Glu | p.G479E | Q5H8C1 | protein_coding | deleterious(0.04) | possibly_damaging(0.468) | TCGA-5L-AAT0-01 | Breast | breast invasive carcinoma | Female | <65 | I/II | Hormone Therapy | tamoxiphen | SD |
| FREM1 | SNV | Missense_Mutation | rs369523355 | c.839N>T | p.Ala280Val | p.A280V | Q5H8C1 | protein_coding | tolerated(0.64) | benign(0.001) | TCGA-A2-A0CU-01 | Breast | breast invasive carcinoma | Female | >=65 | I/II | Hormone Therapy | tamoxiphen | SD |
| FREM1 | SNV | Missense_Mutation | c.3596G>A | p.Arg1199Lys | p.R1199K | Q5H8C1 | protein_coding | tolerated(0.19) | benign(0.003) | TCGA-A8-A085-01 | Breast | breast invasive carcinoma | Male | <65 | I/II | Hormone Therapy | tamoxiphen | SD | |
| FREM1 | SNV | Missense_Mutation | rs751772245 | c.409N>G | p.Met137Val | p.M137V | Q5H8C1 | protein_coding | deleterious(0.02) | benign(0.009) | TCGA-A8-A08P-01 | Breast | breast invasive carcinoma | Female | >=65 | III/IV | Chemotherapy | 5-fluorouracil | CR |
| FREM1 | SNV | Missense_Mutation | c.3077N>G | p.Ser1026Cys | p.S1026C | Q5H8C1 | protein_coding | deleterious(0.01) | possibly_damaging(0.88) | TCGA-A8-A08R-01 | Breast | breast invasive carcinoma | Female | <65 | I/II | Unknown | Unknown | SD | |
| FREM1 | SNV | Missense_Mutation | c.1927N>C | p.Glu643Gln | p.E643Q | Q5H8C1 | protein_coding | deleterious(0.01) | probably_damaging(0.969) | TCGA-AC-A23H-01 | Breast | breast invasive carcinoma | Female | >=65 | I/II | Unknown | Unknown | PD | |
| FREM1 | SNV | Missense_Mutation | rs758674491 | c.88N>T | p.Arg30Cys | p.R30C | Q5H8C1 | protein_coding | deleterious(0.04) | possibly_damaging(0.517) | TCGA-AC-A8OS-01 | Breast | breast invasive carcinoma | Female | >=65 | I/II | Unknown | Unknown | SD |
| FREM1 | SNV | Missense_Mutation | rs779551648 | c.5840N>G | p.Tyr1947Cys | p.Y1947C | Q5H8C1 | protein_coding | deleterious(0) | possibly_damaging(0.72) | TCGA-AN-A046-01 | Breast | breast invasive carcinoma | Female | >=65 | I/II | Unknown | Unknown | SD |
| FREM1 | SNV | Missense_Mutation | rs762734675 | c.2028N>T | p.Arg676Ser | p.R676S | Q5H8C1 | protein_coding | tolerated(0.73) | benign(0.007) | TCGA-AN-A0AJ-01 | Breast | breast invasive carcinoma | Female | >=65 | I/II | Unknown | Unknown | SD |
| Page: 1 2 3 4 5 6 7 8 9 10 11 12 13 14 15 16 17 18 19 20 21 22 23 24 25 26 27 28 29 30 31 |
Top |
Related drugs of malignant transformation related genes |
| Identification of chemicals and drugs interact with genes involved in malignant transfromation |
| (DGIdb 4.0) |
| Entrez ID | Symbol | Category | Interaction Types | Drug Claim Name | Drug Name | PMIDs |
| Page: 1 |

Copyright 2023-Present -The University of Texas Health Science Center at Houston |