
|
|||||
|
 | |
| |
| |
| |
| |
| |
|
Gene: FRAS1 |
Gene summary for FRAS1 |
| Gene information | Species | Human | Gene symbol | FRAS1 | Gene ID | 80144 |
| Gene name | Fraser extracellular matrix complex subunit 1 | |
| Gene Alias | FRASRS1 | |
| Cytomap | 4q21.21 | |
| Gene Type | protein-coding | GO ID | GO:0001655 | UniProtAcc | Q86XX4 |
Top |
Malignant transformation analysis |
| Identification of the aberrant gene expression in precancerous and cancerous lesions by comparing the gene expression of stem-like cells in diseased tissues with normal stem cells |
| Entrez ID | Symbol | Replicates | Species | Organ | Tissue | Adj P-value | Log2FC | Malignancy |
| 80144 | FRAS1 | HTA11_1391_2000001011 | Human | Colorectum | AD | 4.06e-08 | 4.81e-01 | -0.059 |
| 80144 | FRAS1 | HTA11_2992_2000001011 | Human | Colorectum | SER | 8.26e-03 | 6.40e-01 | -0.1706 |
| 80144 | FRAS1 | HTA11_4255_2000001011 | Human | Colorectum | SER | 2.23e-03 | 5.48e-01 | 0.0446 |
| 80144 | FRAS1 | HTA11_7663_2000001011 | Human | Colorectum | SER | 2.75e-02 | 4.38e-01 | 0.0131 |
| 80144 | FRAS1 | HTA11_6818_2000001011 | Human | Colorectum | AD | 6.79e-04 | 3.32e-01 | 0.0112 |
| 80144 | FRAS1 | HTA11_6818_2000001021 | Human | Colorectum | AD | 4.54e-07 | 4.96e-01 | 0.0588 |
| 80144 | FRAS1 | HTA11_99999970781_79442 | Human | Colorectum | MSS | 2.15e-23 | 5.10e-01 | 0.294 |
| 80144 | FRAS1 | HTA11_99999965062_69753 | Human | Colorectum | MSI-H | 8.30e-07 | 1.39e+00 | 0.3487 |
| 80144 | FRAS1 | HTA11_99999965104_69814 | Human | Colorectum | MSS | 1.02e-02 | 3.02e-01 | 0.281 |
| 80144 | FRAS1 | HTA11_99999971662_82457 | Human | Colorectum | MSS | 4.42e-03 | 2.16e-01 | 0.3859 |
| 80144 | FRAS1 | A002-C-021 | Human | Colorectum | FAP | 2.35e-10 | 3.74e-01 | 0.1171 |
| 80144 | FRAS1 | A001-C-104 | Human | Colorectum | FAP | 3.11e-02 | 2.67e-01 | 0.0184 |
| 80144 | FRAS1 | AEH-subject1 | Human | Endometrium | AEH | 6.04e-13 | 4.59e-01 | -0.3059 |
| 80144 | FRAS1 | AEH-subject2 | Human | Endometrium | AEH | 1.30e-13 | 4.83e-01 | -0.2525 |
| 80144 | FRAS1 | AEH-subject3 | Human | Endometrium | AEH | 7.58e-09 | 4.48e-01 | -0.2576 |
| 80144 | FRAS1 | AEH-subject4 | Human | Endometrium | AEH | 2.83e-04 | 3.20e-01 | -0.2657 |
| 80144 | FRAS1 | AEH-subject5 | Human | Endometrium | AEH | 3.40e-12 | 5.17e-01 | -0.2953 |
| 80144 | FRAS1 | EEC-subject1 | Human | Endometrium | EEC | 5.49e-31 | 8.15e-01 | -0.2682 |
| 80144 | FRAS1 | EEC-subject2 | Human | Endometrium | EEC | 3.45e-07 | 3.86e-01 | -0.2607 |
| 80144 | FRAS1 | EEC-subject5 | Human | Endometrium | EEC | 7.54e-13 | 5.62e-01 | -0.249 |
| Page: 1 2 3 |
| Tissue | Expression Dynamics | Abbreviation |
| Colorectum (GSE201348) |  | FAP: Familial adenomatous polyposis |
| CRC: Colorectal cancer | ||
| Colorectum (HTA11) |  | AD: Adenomas |
| SER: Sessile serrated lesions | ||
| MSI-H: Microsatellite-high colorectal cancer | ||
| MSS: Microsatellite stable colorectal cancer | ||
| Endometrium | 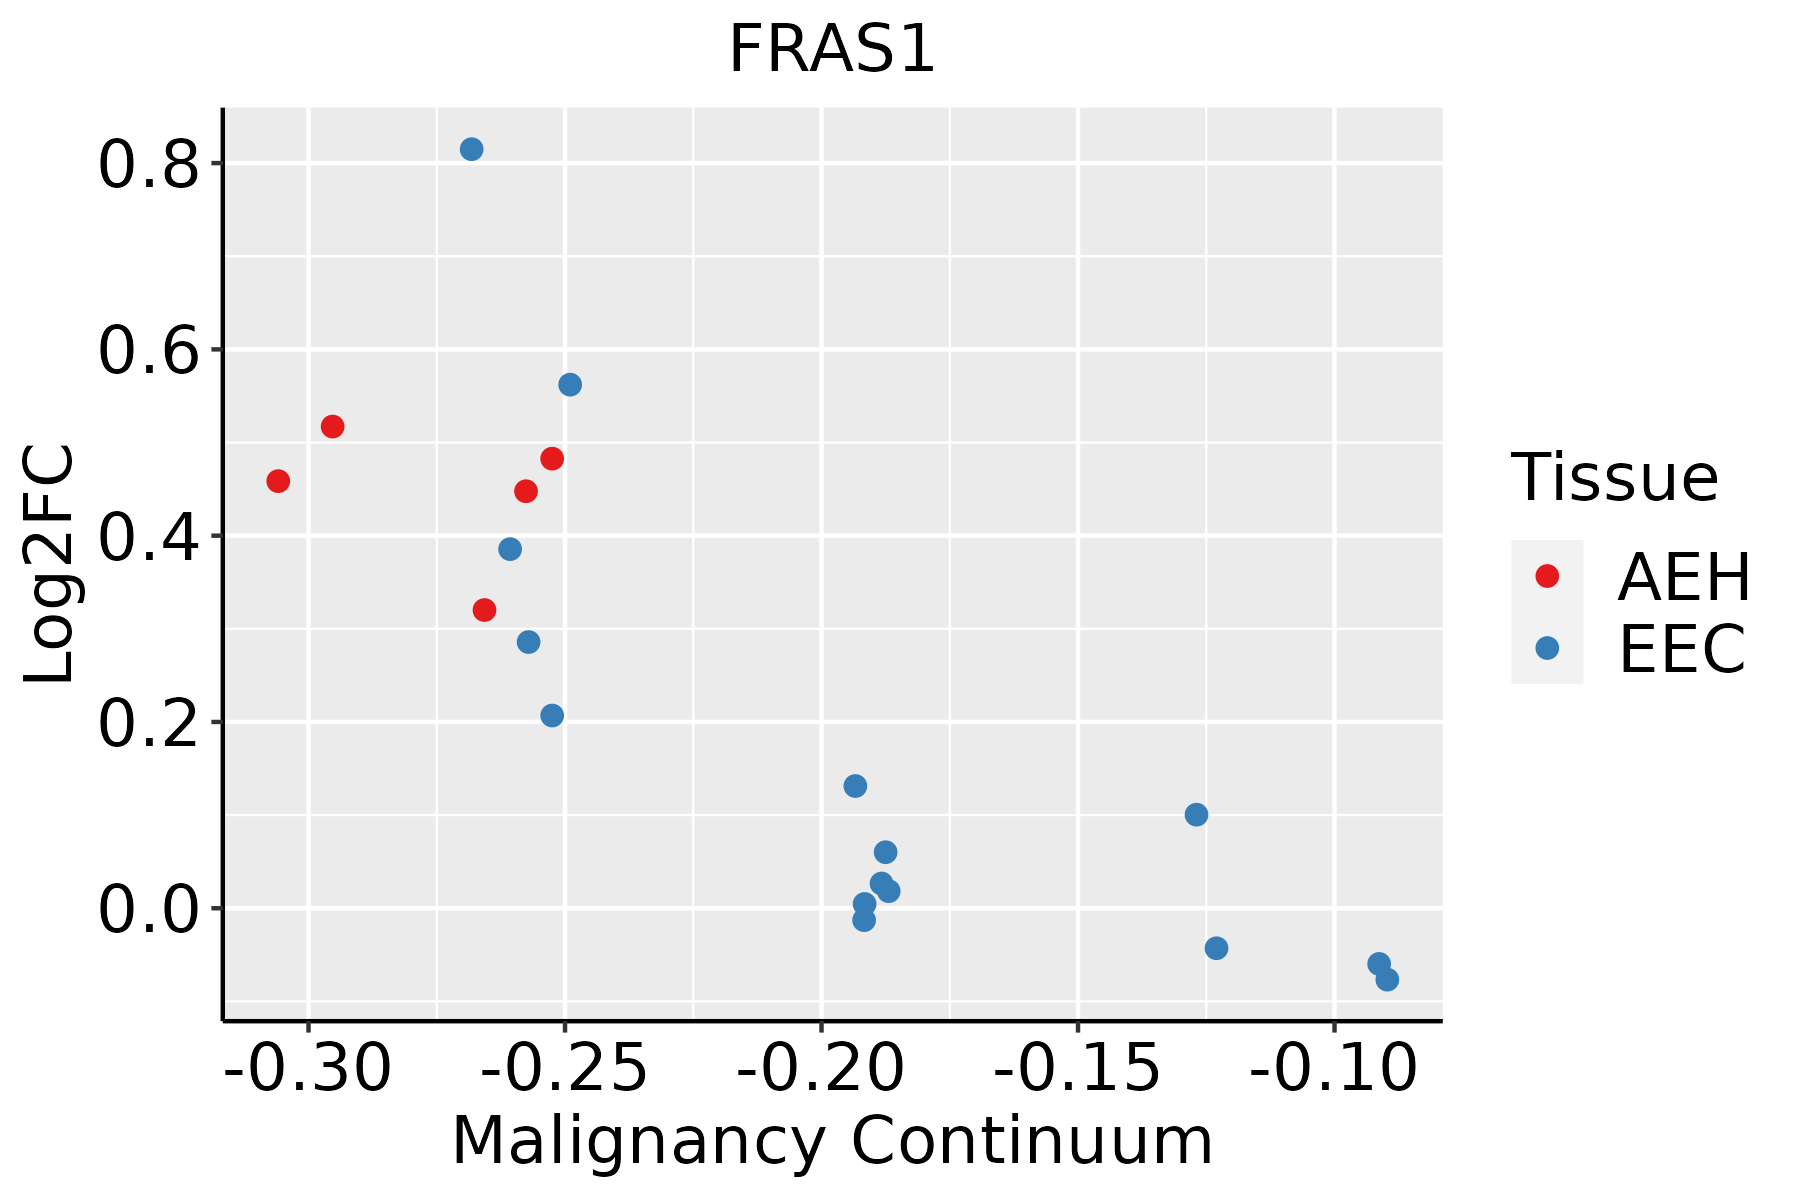 | AEH: Atypical endometrial hyperplasia |
| EEC: Endometrioid Cancer | ||
| Liver |  | HCC: Hepatocellular carcinoma |
| NAFLD: Non-alcoholic fatty liver disease | ||
| Prostate | 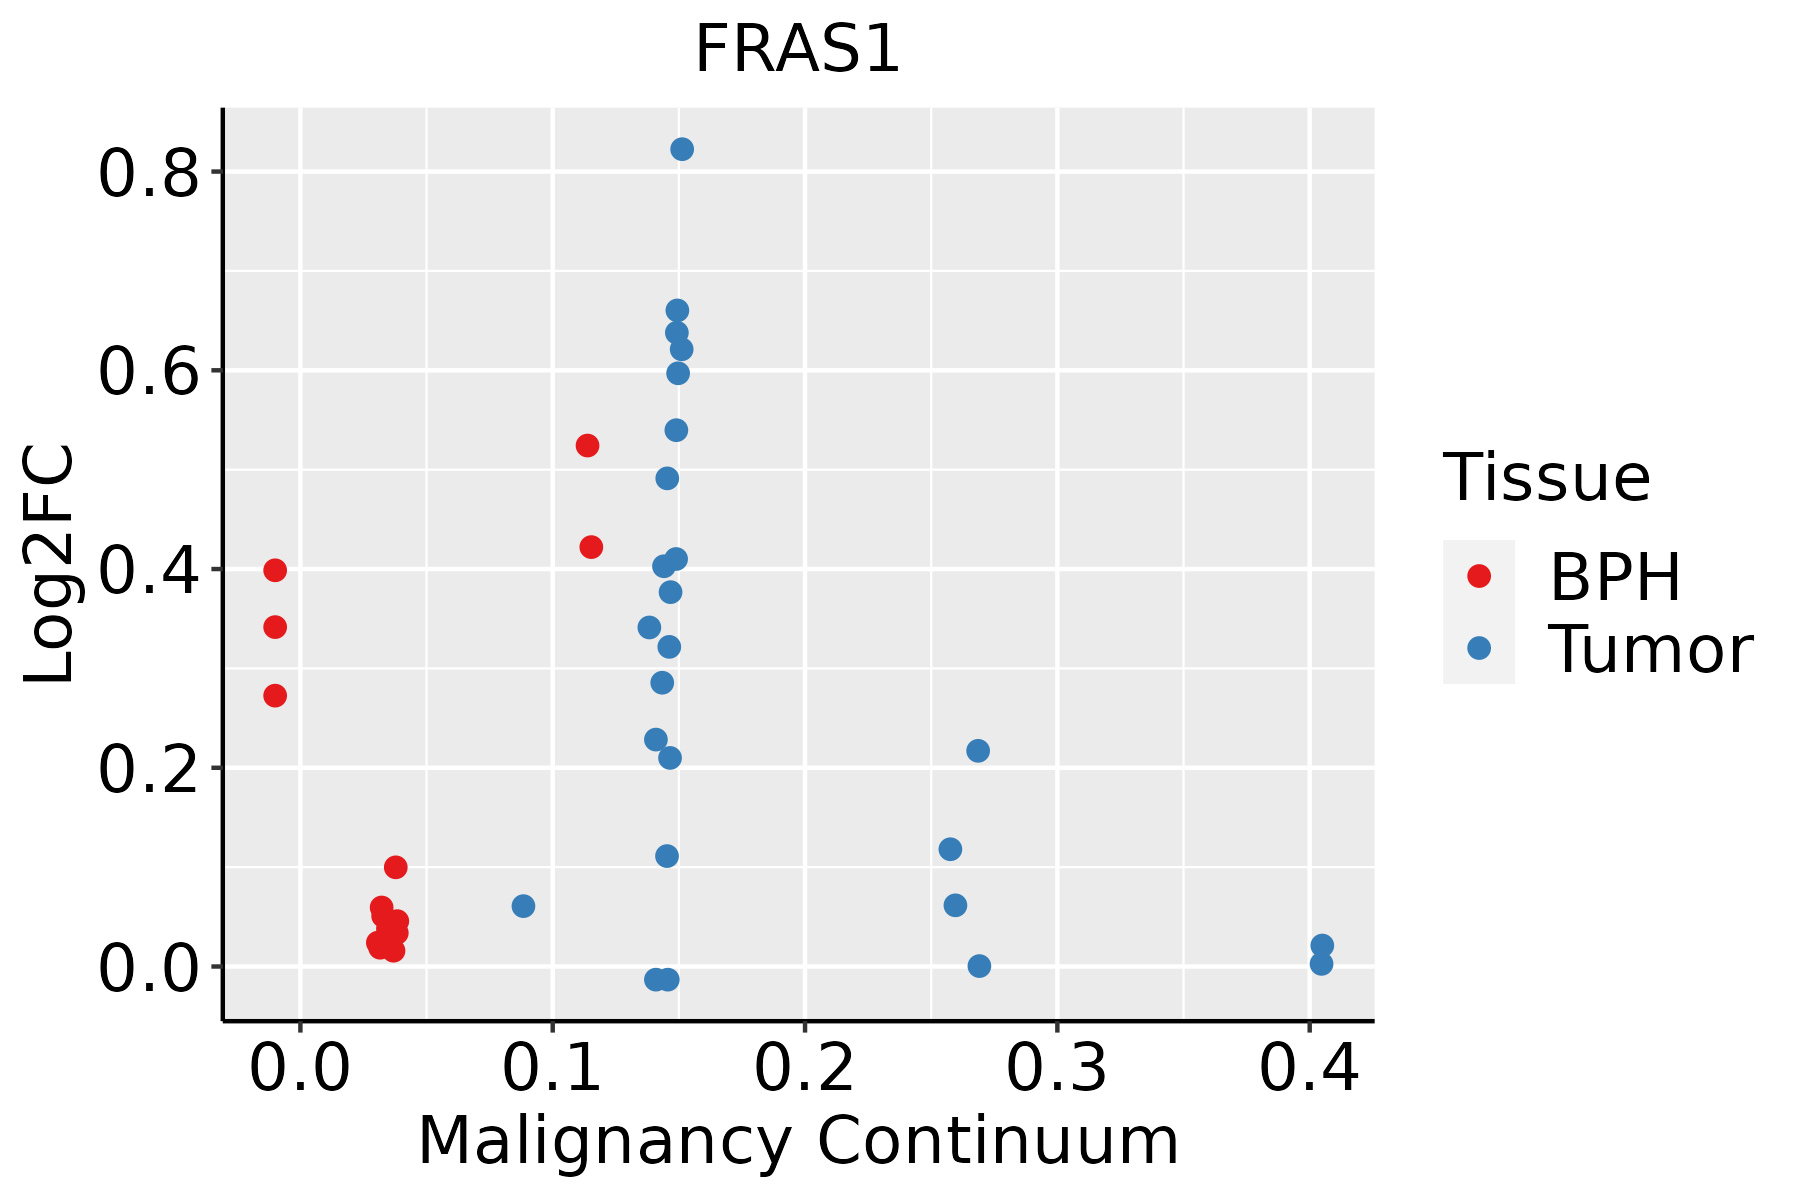 | BPH: Benign Prostatic Hyperplasia |
| ∗log2FC in expression of this searched gene in stem-like cells from each diseased tissue sample relative to stem-like cells in normal samples in each tissue plotted against the malignancy continuum. Samples are colored based on if they are from different disease stage. |
Top |
Malignant transformation related pathway analysis |
| Find out the enriched GO biological processes and KEGG pathways involved in transition from healthy to precancer to cancer |
| Tissue | Disease Stage | Enriched GO biological Processes |
| Colorectum | AD |  |
| Colorectum | SER |  |
| Colorectum | MSS |  |
| Colorectum | MSI-H |  |
| Colorectum | FAP |  |
| ∗Top 15 enriched GO BP terms are showed in the bar plot of each disease state in each tissue. Each row represents a significant GO biological process which is colored according to the -log10(p.adjust). |
| Page: 1 2 3 4 5 6 7 8 9 |
| GO ID | Tissue | Disease Stage | Description | Gene Ratio | Bg Ratio | pvalue | p.adjust | Count |
| GO:0048736 | Colorectum | AD | appendage development | 51/3918 | 172/18723 | 4.20e-03 | 2.89e-02 | 51 |
| GO:0060173 | Colorectum | AD | limb development | 51/3918 | 172/18723 | 4.20e-03 | 2.89e-02 | 51 |
| GO:00487361 | Colorectum | SER | appendage development | 42/2897 | 172/18723 | 1.43e-03 | 1.55e-02 | 42 |
| GO:00601731 | Colorectum | SER | limb development | 42/2897 | 172/18723 | 1.43e-03 | 1.55e-02 | 42 |
| GO:0035107 | Colorectum | SER | appendage morphogenesis | 33/2897 | 138/18723 | 6.10e-03 | 4.42e-02 | 33 |
| GO:0035108 | Colorectum | SER | limb morphogenesis | 33/2897 | 138/18723 | 6.10e-03 | 4.42e-02 | 33 |
| GO:00487362 | Colorectum | MSS | appendage development | 48/3467 | 172/18723 | 1.61e-03 | 1.46e-02 | 48 |
| GO:00601732 | Colorectum | MSS | limb development | 48/3467 | 172/18723 | 1.61e-03 | 1.46e-02 | 48 |
| GO:0001655 | Colorectum | MSS | urogenital system development | 81/3467 | 338/18723 | 6.88e-03 | 4.43e-02 | 81 |
| GO:0043588 | Colorectum | FAP | skin development | 58/2622 | 263/18723 | 2.44e-04 | 3.39e-03 | 58 |
| GO:00351071 | Colorectum | FAP | appendage morphogenesis | 35/2622 | 138/18723 | 2.74e-04 | 3.66e-03 | 35 |
| GO:00351081 | Colorectum | FAP | limb morphogenesis | 35/2622 | 138/18723 | 2.74e-04 | 3.66e-03 | 35 |
| GO:00016551 | Colorectum | FAP | urogenital system development | 70/2622 | 338/18723 | 4.26e-04 | 5.11e-03 | 70 |
| GO:0072001 | Colorectum | FAP | renal system development | 63/2622 | 302/18723 | 6.59e-04 | 7.19e-03 | 63 |
| GO:00487363 | Colorectum | FAP | appendage development | 40/2622 | 172/18723 | 7.15e-04 | 7.66e-03 | 40 |
| GO:00601733 | Colorectum | FAP | limb development | 40/2622 | 172/18723 | 7.15e-04 | 7.66e-03 | 40 |
| GO:0001822 | Colorectum | FAP | kidney development | 61/2622 | 293/18723 | 8.38e-04 | 8.72e-03 | 61 |
| GO:00016556 | Endometrium | AEH | urogenital system development | 67/2100 | 338/18723 | 2.30e-06 | 6.76e-05 | 67 |
| GO:00720015 | Endometrium | AEH | renal system development | 61/2100 | 302/18723 | 3.43e-06 | 9.24e-05 | 61 |
| GO:00018224 | Endometrium | AEH | kidney development | 57/2100 | 293/18723 | 2.25e-05 | 4.35e-04 | 57 |
| Page: 1 2 3 |
| Pathway ID | Tissue | Disease Stage | Description | Gene Ratio | Bg Ratio | pvalue | p.adjust | qvalue | Count |
| hsa045125 | Prostate | BPH | ECM-receptor interaction | 28/1718 | 89/8465 | 8.33e-03 | 2.64e-02 | 1.64e-02 | 28 |
| hsa0451212 | Prostate | BPH | ECM-receptor interaction | 28/1718 | 89/8465 | 8.33e-03 | 2.64e-02 | 1.64e-02 | 28 |
| Page: 1 |
Top |
Cell-cell communication analysis |
| Identification of potential cell-cell interactions between two cell types and their ligand-receptor pairs for different disease states |
| Ligand | Receptor | LRpair | Pathway | Tissue | Disease Stage |
| Page: 1 |
Top |
Single-cell gene regulatory network inference analysis |
| Find out the significant the regulons (TFs) and the target genes of each regulon across cell types for different disease states |
| TF | Cell Type | Tissue | Disease Stage | Target Gene | RSS | Regulon Activity |
| ∗The dot plots of a searched regulon are shown for all cell subpopulations in each disease state of each tissue based on the regulon specific score inferred using pySCENIC and by calculating the average expression. |
| Page: 1 |
Top |
Somatic mutation of malignant transformation related genes |
| Annotation of somatic variants for genes involved in malignant transformation |
| Hugo Symbol | Variant Class | Variant Classification | dbSNP RS | HGVSc | HGVSp | HGVSp Short | SWISSPROT | BIOTYPE | SIFT | PolyPhen | Tumor Sample Barcode | Tissue | Histology | Sex | Age | Stage | Therapy Types | Drugs | Outcome |
| FRAS1 | SNV | Missense_Mutation | c.10261N>G | p.Arg3421Gly | p.R3421G | Q86XX4 | protein_coding | deleterious(0) | probably_damaging(0.999) | TCGA-A2-A0CL-01 | Breast | breast invasive carcinoma | Female | <65 | III/IV | Chemotherapy | cytoxan | SD | |
| FRAS1 | SNV | Missense_Mutation | c.4054A>T | p.Ile1352Phe | p.I1352F | Q86XX4 | protein_coding | tolerated(0.2) | benign(0.325) | TCGA-A8-A09Z-01 | Breast | breast invasive carcinoma | Female | >=65 | I/II | Unknown | Unknown | SD | |
| FRAS1 | SNV | Missense_Mutation | c.1632N>C | p.Glu544Asp | p.E544D | Q86XX4 | protein_coding | tolerated(0.5) | benign(0.003) | TCGA-AC-A23H-01 | Breast | breast invasive carcinoma | Female | >=65 | I/II | Unknown | Unknown | PD | |
| FRAS1 | SNV | Missense_Mutation | c.997C>T | p.His333Tyr | p.H333Y | Q86XX4 | protein_coding | deleterious(0.03) | benign(0.38) | TCGA-AN-A046-01 | Breast | breast invasive carcinoma | Female | >=65 | I/II | Unknown | Unknown | SD | |
| FRAS1 | SNV | Missense_Mutation | novel | c.5632C>T | p.Pro1878Ser | p.P1878S | Q86XX4 | protein_coding | deleterious(0) | probably_damaging(1) | TCGA-AN-A046-01 | Breast | breast invasive carcinoma | Female | >=65 | I/II | Unknown | Unknown | SD |
| FRAS1 | SNV | Missense_Mutation | c.11183C>T | p.Thr3728Met | p.T3728M | Q86XX4 | protein_coding | deleterious(0) | probably_damaging(0.999) | TCGA-AN-A046-01 | Breast | breast invasive carcinoma | Female | >=65 | I/II | Unknown | Unknown | SD | |
| FRAS1 | SNV | Missense_Mutation | c.2774N>T | p.Cys925Phe | p.C925F | Q86XX4 | protein_coding | deleterious(0) | probably_damaging(0.995) | TCGA-AO-A128-01 | Breast | breast invasive carcinoma | Female | <65 | I/II | Chemotherapy | doxorubicin | SD | |
| FRAS1 | SNV | Missense_Mutation | novel | c.7804G>A | p.Val2602Ile | p.V2602I | Q86XX4 | protein_coding | tolerated(0.15) | benign(0.248) | TCGA-B6-A0I1-01 | Breast | breast invasive carcinoma | Female | >=65 | I/II | Unknown | Unknown | PD |
| FRAS1 | SNV | Missense_Mutation | c.4089N>C | p.Glu1363Asp | p.E1363D | Q86XX4 | protein_coding | tolerated(0.33) | benign(0) | TCGA-B6-A0IJ-01 | Breast | breast invasive carcinoma | Female | <65 | I/II | Unknown | Unknown | SD | |
| FRAS1 | SNV | Missense_Mutation | novel | c.4906N>G | p.Arg1636Gly | p.R1636G | Q86XX4 | protein_coding | deleterious(0.02) | benign(0.03) | TCGA-BH-A0C0-01 | Breast | breast invasive carcinoma | Female | <65 | I/II | Chemotherapy | carboplatin | SD |
| Page: 1 2 3 4 5 6 7 8 9 10 11 12 13 14 15 16 17 18 19 20 21 22 23 24 25 26 27 28 29 30 31 32 33 34 35 36 37 38 39 40 |
Top |
Related drugs of malignant transformation related genes |
| Identification of chemicals and drugs interact with genes involved in malignant transfromation |
| (DGIdb 4.0) |
| Entrez ID | Symbol | Category | Interaction Types | Drug Claim Name | Drug Name | PMIDs |
| Page: 1 |

Copyright 2023-Present -The University of Texas Health Science Center at Houston |