
|
|||||
|
 | |
| |
| |
| |
| |
| |
|
Gene: FPGS |
Gene summary for FPGS |
| Gene information | Species | Human | Gene symbol | FPGS | Gene ID | 2356 |
| Gene name | folylpolyglutamate synthase | |
| Gene Alias | FPGS | |
| Cytomap | 9q34.11 | |
| Gene Type | protein-coding | GO ID | GO:0001889 | UniProtAcc | Q05932 |
Top |
Malignant transformation analysis |
| Identification of the aberrant gene expression in precancerous and cancerous lesions by comparing the gene expression of stem-like cells in diseased tissues with normal stem cells |
| Entrez ID | Symbol | Replicates | Species | Organ | Tissue | Adj P-value | Log2FC | Malignancy |
| 2356 | FPGS | LZE4T | Human | Esophagus | ESCC | 2.02e-11 | 2.36e-01 | 0.0811 |
| 2356 | FPGS | LZE7T | Human | Esophagus | ESCC | 4.28e-02 | 1.33e-01 | 0.0667 |
| 2356 | FPGS | LZE8T | Human | Esophagus | ESCC | 1.10e-05 | 1.16e-01 | 0.067 |
| 2356 | FPGS | LZE20T | Human | Esophagus | ESCC | 4.08e-11 | 2.09e-01 | 0.0662 |
| 2356 | FPGS | LZE22T | Human | Esophagus | ESCC | 1.35e-02 | 3.27e-01 | 0.068 |
| 2356 | FPGS | LZE24T | Human | Esophagus | ESCC | 7.70e-21 | 5.36e-01 | 0.0596 |
| 2356 | FPGS | LZE21T | Human | Esophagus | ESCC | 2.88e-08 | 5.95e-01 | 0.0655 |
| 2356 | FPGS | P1T-E | Human | Esophagus | ESCC | 2.63e-07 | 4.78e-01 | 0.0875 |
| 2356 | FPGS | P2T-E | Human | Esophagus | ESCC | 1.77e-52 | 8.72e-01 | 0.1177 |
| 2356 | FPGS | P4T-E | Human | Esophagus | ESCC | 2.49e-23 | 6.05e-01 | 0.1323 |
| 2356 | FPGS | P5T-E | Human | Esophagus | ESCC | 5.14e-19 | 3.25e-01 | 0.1327 |
| 2356 | FPGS | P8T-E | Human | Esophagus | ESCC | 4.76e-45 | 8.80e-01 | 0.0889 |
| 2356 | FPGS | P9T-E | Human | Esophagus | ESCC | 6.74e-26 | 5.55e-01 | 0.1131 |
| 2356 | FPGS | P10T-E | Human | Esophagus | ESCC | 1.83e-34 | 5.40e-01 | 0.116 |
| 2356 | FPGS | P11T-E | Human | Esophagus | ESCC | 7.15e-23 | 8.58e-01 | 0.1426 |
| 2356 | FPGS | P12T-E | Human | Esophagus | ESCC | 5.27e-31 | 5.07e-01 | 0.1122 |
| 2356 | FPGS | P15T-E | Human | Esophagus | ESCC | 5.74e-30 | 5.91e-01 | 0.1149 |
| 2356 | FPGS | P16T-E | Human | Esophagus | ESCC | 1.00e-18 | 3.24e-01 | 0.1153 |
| 2356 | FPGS | P17T-E | Human | Esophagus | ESCC | 5.93e-14 | 5.35e-01 | 0.1278 |
| 2356 | FPGS | P19T-E | Human | Esophagus | ESCC | 5.19e-14 | 9.76e-01 | 0.1662 |
| Page: 1 2 3 4 5 6 |
| Tissue | Expression Dynamics | Abbreviation |
| Esophagus |  | ESCC: Esophageal squamous cell carcinoma |
| HGIN: High-grade intraepithelial neoplasias | ||
| LGIN: Low-grade intraepithelial neoplasias | ||
| Liver | 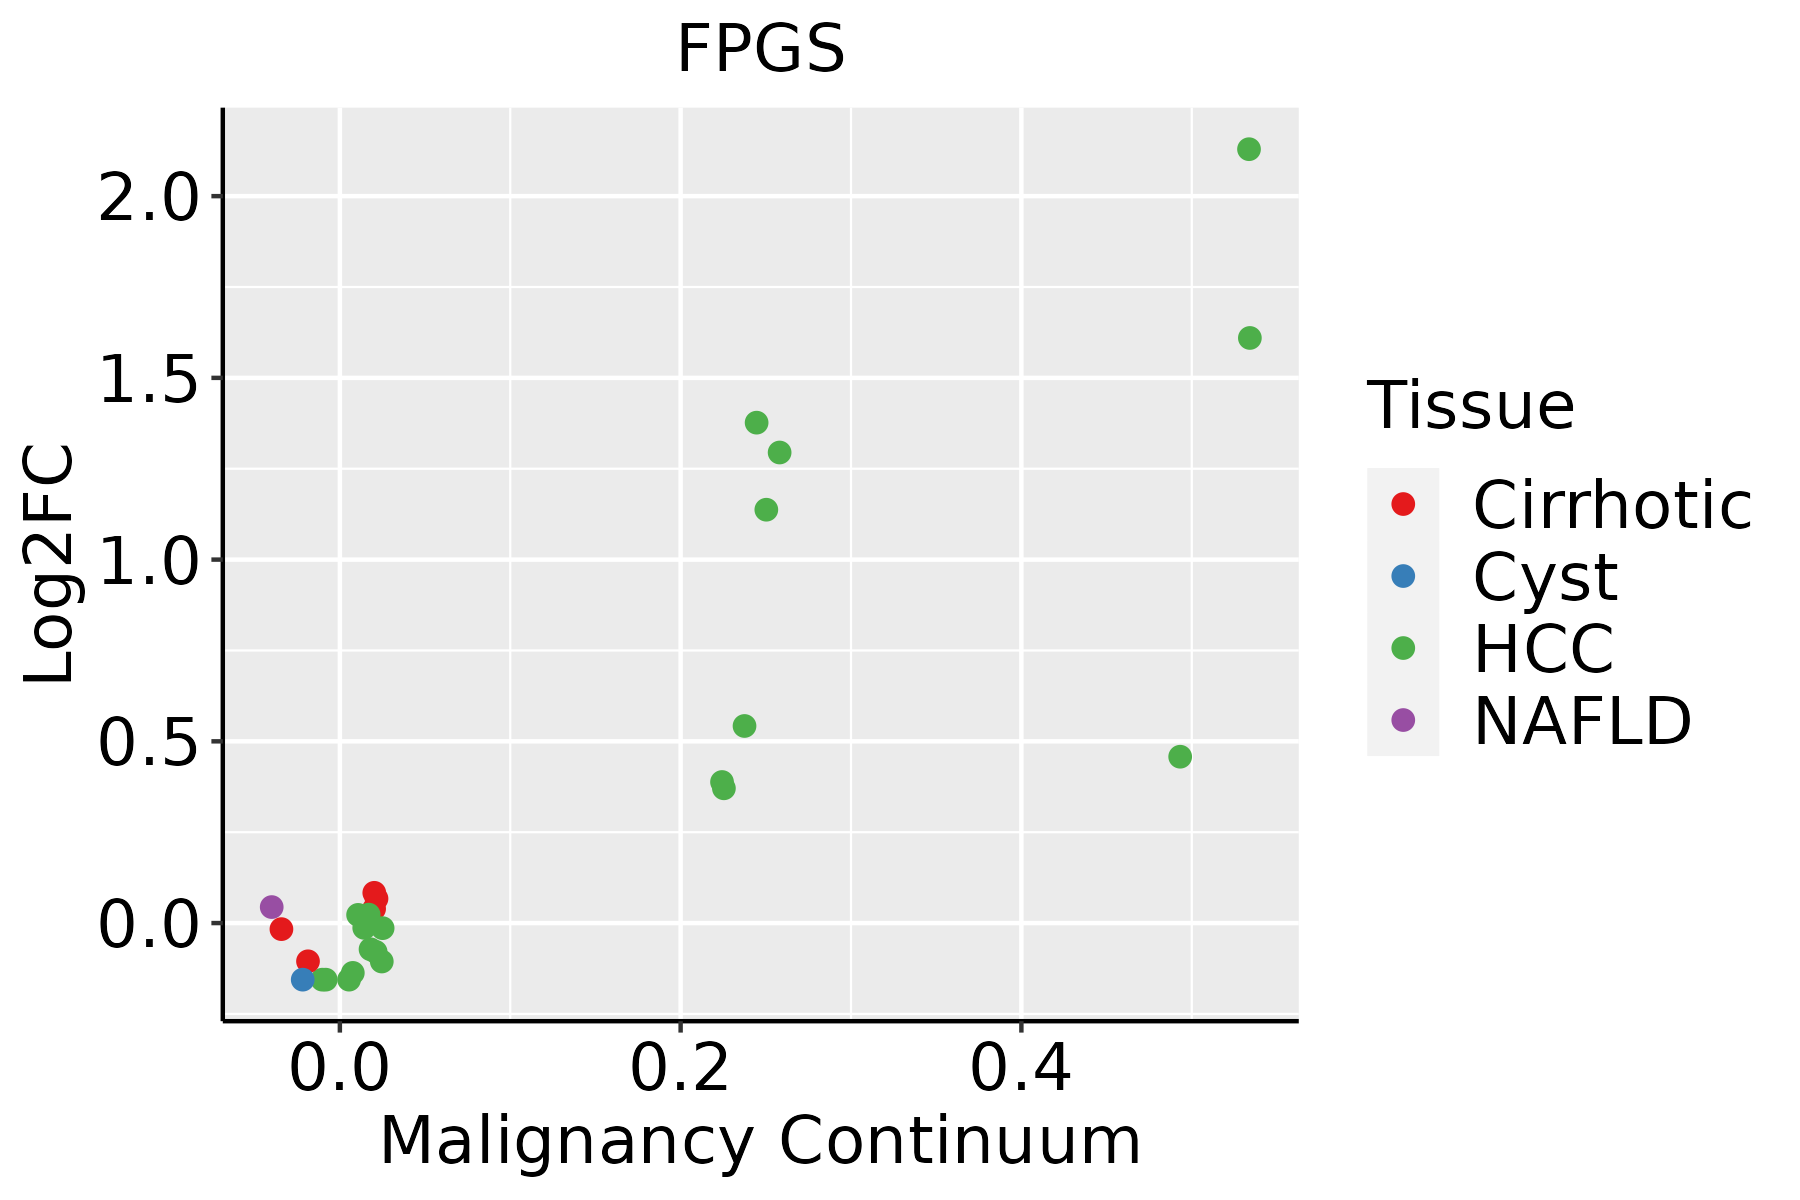 | HCC: Hepatocellular carcinoma |
| NAFLD: Non-alcoholic fatty liver disease | ||
| Oral Cavity |  | EOLP: Erosive Oral lichen planus |
| LP: leukoplakia | ||
| NEOLP: Non-erosive oral lichen planus | ||
| OSCC: Oral squamous cell carcinoma | ||
| Skin | 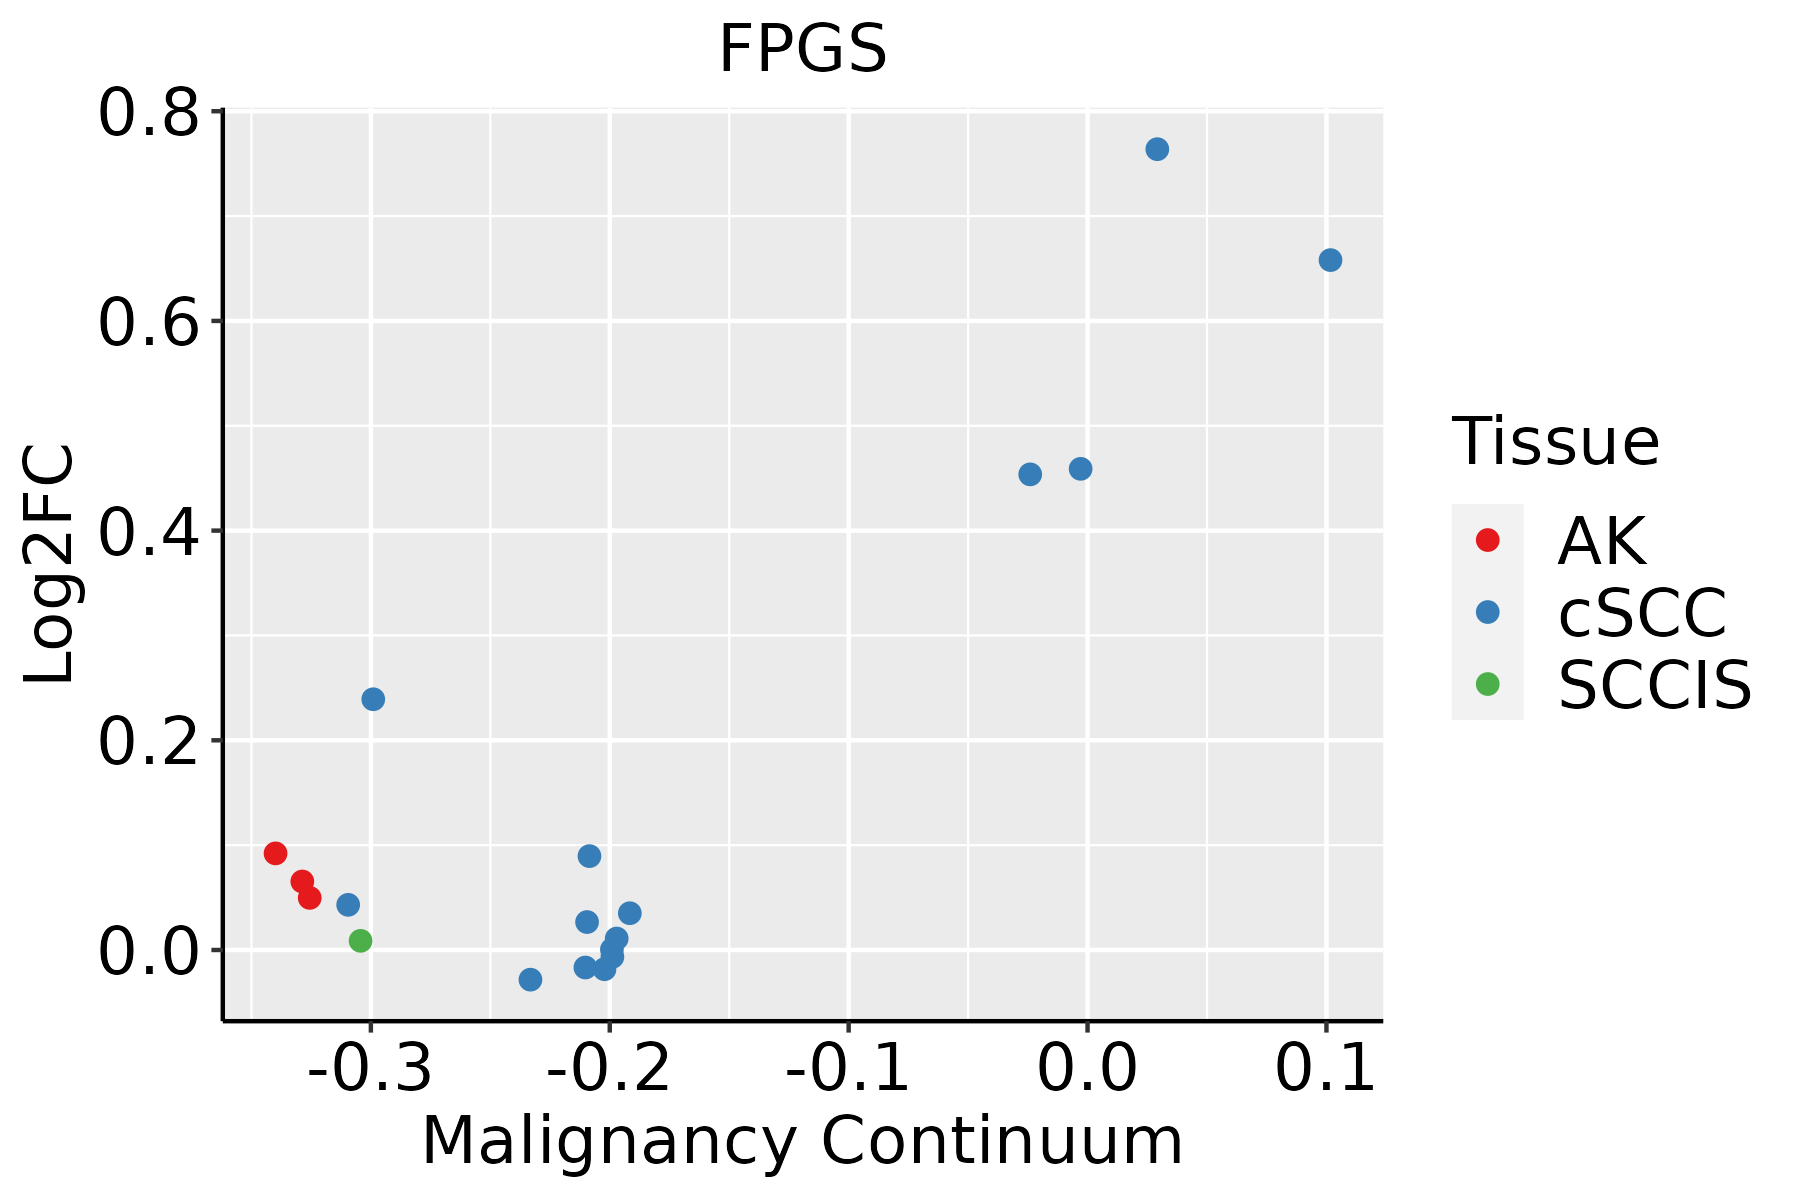 | AK: Actinic keratosis |
| cSCC: Cutaneous squamous cell carcinoma | ||
| SCCIS:squamous cell carcinoma in situ | ||
| Thyroid | 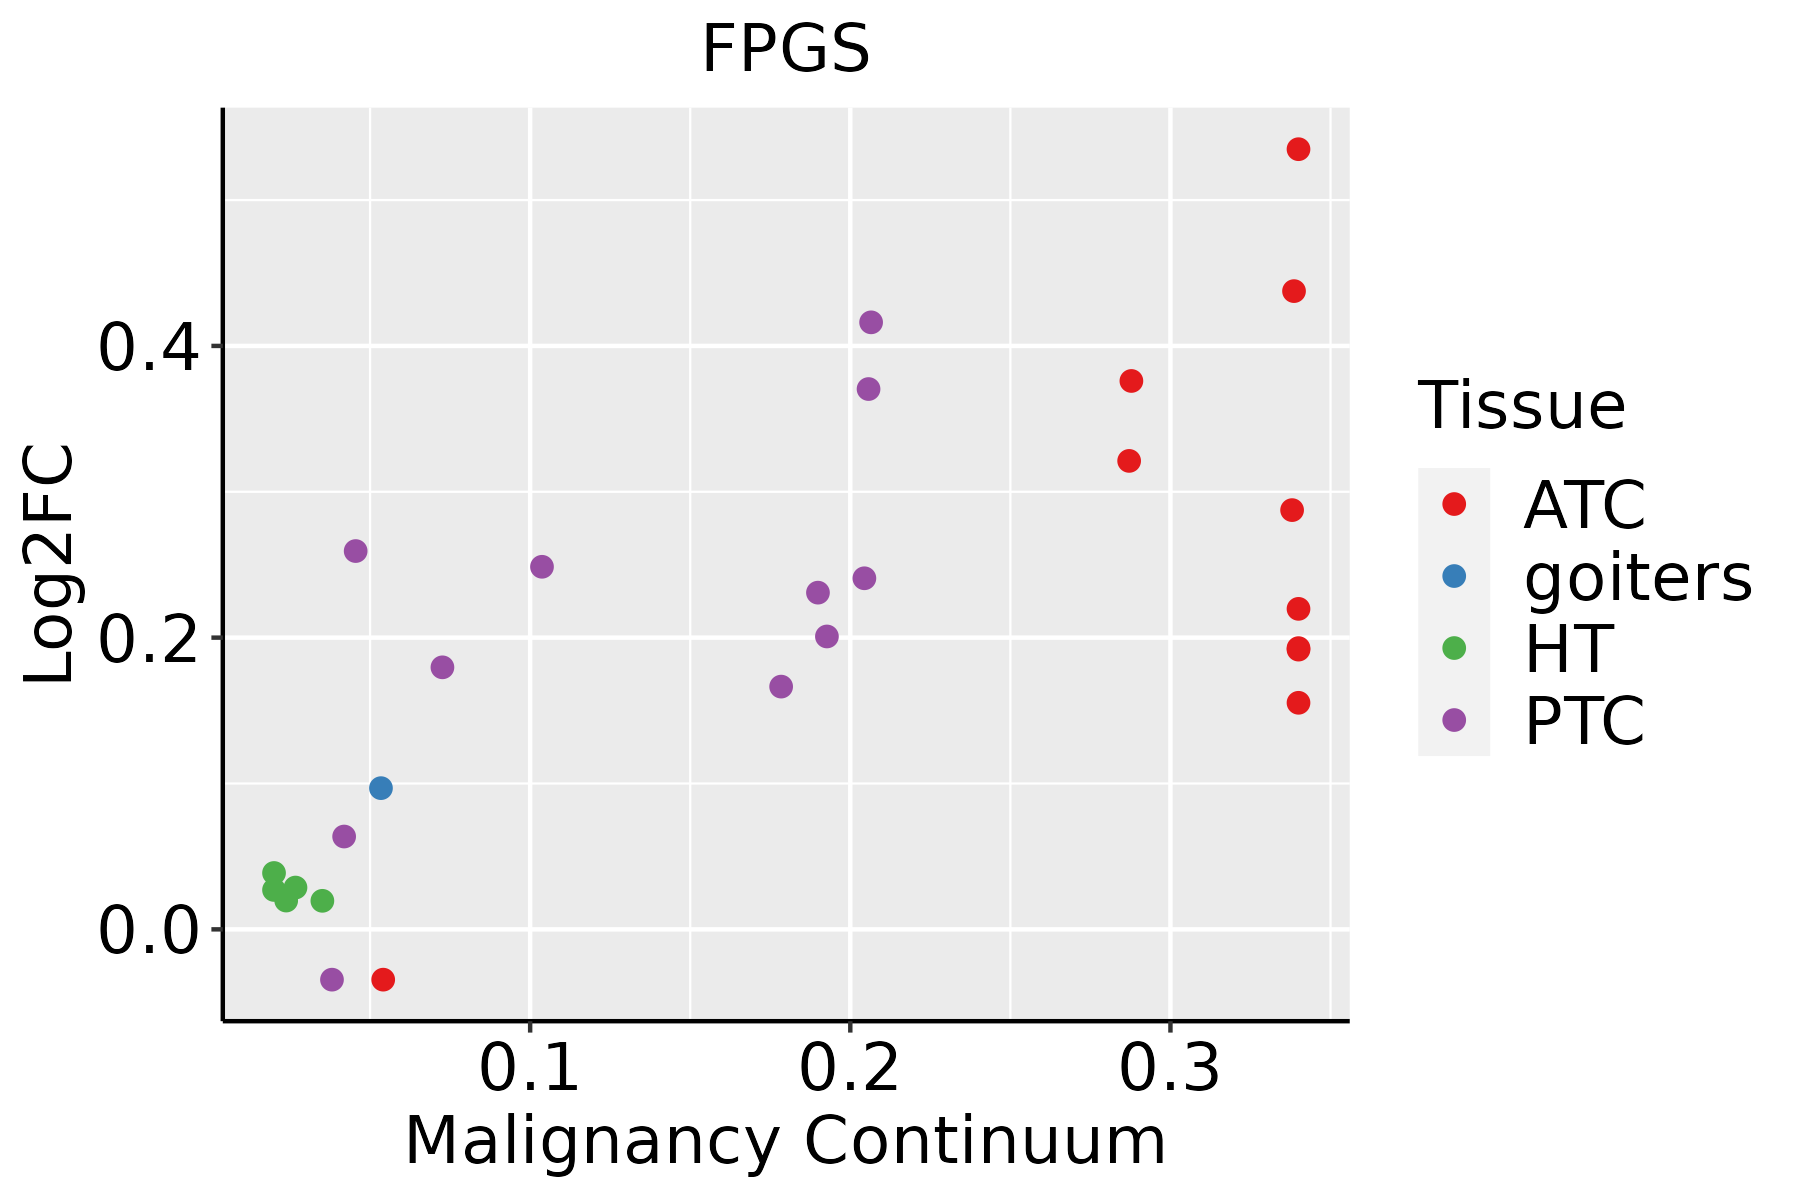 | ATC: Anaplastic thyroid cancer |
| HT: Hashimoto's thyroiditis | ||
| PTC: Papillary thyroid cancer |
| ∗log2FC in expression of this searched gene in stem-like cells from each diseased tissue sample relative to stem-like cells in normal samples in each tissue plotted against the malignancy continuum. Samples are colored based on if they are from different disease stage. |
Top |
Malignant transformation related pathway analysis |
| Find out the enriched GO biological processes and KEGG pathways involved in transition from healthy to precancer to cancer |
| Tissue | Disease Stage | Enriched GO biological Processes |
| Colorectum | AD |  |
| Colorectum | SER |  |
| Colorectum | MSS |  |
| Colorectum | MSI-H |  |
| Colorectum | FAP |  |
| ∗Top 15 enriched GO BP terms are showed in the bar plot of each disease state in each tissue. Each row represents a significant GO biological process which is colored according to the -log10(p.adjust). |
| Page: 1 2 3 4 5 6 7 8 9 |
| GO ID | Tissue | Disease Stage | Description | Gene Ratio | Bg Ratio | pvalue | p.adjust | Count |
| GO:0048732111 | Esophagus | ESCC | gland development | 269/8552 | 436/18723 | 7.81e-12 | 2.95e-10 | 269 |
| GO:0061008110 | Esophagus | ESCC | hepaticobiliary system development | 98/8552 | 150/18723 | 8.91e-07 | 1.15e-05 | 98 |
| GO:0001889110 | Esophagus | ESCC | liver development | 96/8552 | 147/18723 | 1.18e-06 | 1.47e-05 | 96 |
| GO:003109910 | Esophagus | ESCC | regeneration | 122/8552 | 198/18723 | 4.26e-06 | 4.57e-05 | 122 |
| GO:00065757 | Esophagus | ESCC | cellular modified amino acid metabolic process | 112/8552 | 188/18723 | 8.31e-05 | 6.06e-04 | 112 |
| GO:00423986 | Esophagus | ESCC | cellular modified amino acid biosynthetic process | 34/8552 | 46/18723 | 9.39e-05 | 6.70e-04 | 34 |
| GO:00067671 | Esophagus | ESCC | water-soluble vitamin metabolic process | 41/8552 | 59/18723 | 1.84e-04 | 1.17e-03 | 41 |
| GO:00067661 | Esophagus | ESCC | vitamin metabolic process | 67/8552 | 106/18723 | 2.03e-04 | 1.28e-03 | 67 |
| GO:00311009 | Esophagus | ESCC | animal organ regeneration | 50/8552 | 76/18723 | 3.17e-04 | 1.88e-03 | 50 |
| GO:00425584 | Esophagus | ESCC | pteridine-containing compound metabolic process | 25/8552 | 33/18723 | 4.30e-04 | 2.43e-03 | 25 |
| GO:00425595 | Esophagus | ESCC | pteridine-containing compound biosynthetic process | 13/8552 | 15/18723 | 1.31e-03 | 6.26e-03 | 13 |
| GO:00436485 | Esophagus | ESCC | dicarboxylic acid metabolic process | 58/8552 | 96/18723 | 2.55e-03 | 1.09e-02 | 58 |
| GO:00067602 | Esophagus | ESCC | folic acid-containing compound metabolic process | 19/8552 | 26/18723 | 4.31e-03 | 1.71e-02 | 19 |
| GO:00466551 | Esophagus | ESCC | folic acid metabolic process | 11/8552 | 14/18723 | 1.30e-02 | 4.27e-02 | 11 |
| GO:000188912 | Liver | Cirrhotic | liver development | 81/4634 | 147/18723 | 2.99e-15 | 3.35e-13 | 81 |
| GO:006100812 | Liver | Cirrhotic | hepaticobiliary system development | 82/4634 | 150/18723 | 3.72e-15 | 4.09e-13 | 82 |
| GO:19016051 | Liver | Cirrhotic | alpha-amino acid metabolic process | 82/4634 | 195/18723 | 7.72e-08 | 2.30e-06 | 82 |
| GO:004873212 | Liver | Cirrhotic | gland development | 154/4634 | 436/18723 | 4.03e-07 | 9.42e-06 | 154 |
| GO:000652011 | Liver | Cirrhotic | cellular amino acid metabolic process | 103/4634 | 284/18723 | 8.88e-06 | 1.30e-04 | 103 |
| GO:004364811 | Liver | Cirrhotic | dicarboxylic acid metabolic process | 43/4634 | 96/18723 | 1.42e-05 | 1.97e-04 | 43 |
| Page: 1 2 3 4 5 |
| Pathway ID | Tissue | Disease Stage | Description | Gene Ratio | Bg Ratio | pvalue | p.adjust | qvalue | Count |
| hsa012405 | Esophagus | ESCC | Biosynthesis of cofactors | 97/4205 | 153/8465 | 3.88e-04 | 1.35e-03 | 6.94e-04 | 97 |
| hsa015232 | Esophagus | ESCC | Antifolate resistance | 22/4205 | 30/8465 | 7.23e-03 | 1.76e-02 | 8.99e-03 | 22 |
| hsa0124012 | Esophagus | ESCC | Biosynthesis of cofactors | 97/4205 | 153/8465 | 3.88e-04 | 1.35e-03 | 6.94e-04 | 97 |
| hsa0152311 | Esophagus | ESCC | Antifolate resistance | 22/4205 | 30/8465 | 7.23e-03 | 1.76e-02 | 8.99e-03 | 22 |
| hsa01240 | Liver | Cirrhotic | Biosynthesis of cofactors | 66/2530 | 153/8465 | 3.11e-04 | 1.99e-03 | 1.23e-03 | 66 |
| hsa012401 | Liver | Cirrhotic | Biosynthesis of cofactors | 66/2530 | 153/8465 | 3.11e-04 | 1.99e-03 | 1.23e-03 | 66 |
| hsa012402 | Liver | HCC | Biosynthesis of cofactors | 103/4020 | 153/8465 | 4.67e-07 | 5.05e-06 | 2.81e-06 | 103 |
| hsa01523 | Liver | HCC | Antifolate resistance | 21/4020 | 30/8465 | 1.06e-02 | 2.71e-02 | 1.51e-02 | 21 |
| hsa012403 | Liver | HCC | Biosynthesis of cofactors | 103/4020 | 153/8465 | 4.67e-07 | 5.05e-06 | 2.81e-06 | 103 |
| hsa015231 | Liver | HCC | Antifolate resistance | 21/4020 | 30/8465 | 1.06e-02 | 2.71e-02 | 1.51e-02 | 21 |
| hsa012404 | Oral cavity | OSCC | Biosynthesis of cofactors | 88/3704 | 153/8465 | 3.84e-04 | 1.20e-03 | 6.12e-04 | 88 |
| hsa0124011 | Oral cavity | OSCC | Biosynthesis of cofactors | 88/3704 | 153/8465 | 3.84e-04 | 1.20e-03 | 6.12e-04 | 88 |
| hsa0124021 | Oral cavity | LP | Biosynthesis of cofactors | 57/2418 | 153/8465 | 1.17e-02 | 3.91e-02 | 2.52e-02 | 57 |
| hsa0124031 | Oral cavity | LP | Biosynthesis of cofactors | 57/2418 | 153/8465 | 1.17e-02 | 3.91e-02 | 2.52e-02 | 57 |
| Page: 1 |
Top |
Cell-cell communication analysis |
| Identification of potential cell-cell interactions between two cell types and their ligand-receptor pairs for different disease states |
| Ligand | Receptor | LRpair | Pathway | Tissue | Disease Stage |
| Page: 1 |
Top |
Single-cell gene regulatory network inference analysis |
| Find out the significant the regulons (TFs) and the target genes of each regulon across cell types for different disease states |
| TF | Cell Type | Tissue | Disease Stage | Target Gene | RSS | Regulon Activity |
| ∗The dot plots of a searched regulon are shown for all cell subpopulations in each disease state of each tissue based on the regulon specific score inferred using pySCENIC and by calculating the average expression. |
| Page: 1 |
Top |
Somatic mutation of malignant transformation related genes |
| Annotation of somatic variants for genes involved in malignant transformation |
| Hugo Symbol | Variant Class | Variant Classification | dbSNP RS | HGVSc | HGVSp | HGVSp Short | SWISSPROT | BIOTYPE | SIFT | PolyPhen | Tumor Sample Barcode | Tissue | Histology | Sex | Age | Stage | Therapy Types | Drugs | Outcome |
| FPGS | SNV | Missense_Mutation | novel | c.711N>C | p.Glu237Asp | p.E237D | Q05932 | protein_coding | tolerated(0.22) | benign(0.398) | TCGA-3C-AALI-01 | Breast | breast invasive carcinoma | Female | <65 | I/II | Unspecific | Poly E | Complete Response |
| FPGS | SNV | Missense_Mutation | c.365N>A | p.Gly122Asp | p.G122D | Q05932 | protein_coding | deleterious(0.02) | probably_damaging(0.99) | TCGA-A2-A0CQ-01 | Breast | breast invasive carcinoma | Female | <65 | I/II | Chemotherapy | adriamycin | SD | |
| FPGS | SNV | Missense_Mutation | c.1529N>A | p.Cys510Tyr | p.C510Y | Q05932 | protein_coding | tolerated(0.67) | benign(0.013) | TCGA-BH-A0HF-01 | Breast | breast invasive carcinoma | Female | >=65 | I/II | Hormone Therapy | arimidex | SD | |
| FPGS | SNV | Missense_Mutation | c.1618C>T | p.Pro540Ser | p.P540S | Q05932 | protein_coding | tolerated(0.39) | benign(0.001) | TCGA-C8-A137-01 | Breast | breast invasive carcinoma | Female | <65 | I/II | Unknown | Unknown | PD | |
| FPGS | SNV | Missense_Mutation | novel | c.1688N>G | p.Ile563Ser | p.I563S | Q05932 | protein_coding | deleterious(0.05) | possibly_damaging(0.636) | TCGA-LL-A5YL-01 | Breast | breast invasive carcinoma | Female | <65 | I/II | Chemotherapy | adriamycin | SD |
| FPGS | SNV | Missense_Mutation | c.1483N>T | p.Gly495Cys | p.G495C | Q05932 | protein_coding | deleterious(0.02) | possibly_damaging(0.45) | TCGA-VS-A8EC-01 | Cervix | cervical & endocervical cancer | Female | <65 | III/IV | Chemotherapy | carboplatin | CR | |
| FPGS | insertion | Frame_Shift_Ins | novel | c.522_523insC | p.Tyr177LeufsTer32 | p.Y177Lfs*32 | Q05932 | protein_coding | TCGA-MA-AA42-01 | Cervix | cervical & endocervical cancer | Female | >=65 | I/II | Unknown | Unknown | SD | ||
| FPGS | SNV | Missense_Mutation | novel | c.1310N>C | p.Val437Ala | p.V437A | Q05932 | protein_coding | tolerated(0.09) | benign(0.06) | TCGA-A6-2675-01 | Colorectum | colon adenocarcinoma | Male | >=65 | I/II | Unknown | Unknown | SD |
| FPGS | SNV | Missense_Mutation | novel | c.758N>G | p.Ala253Gly | p.A253G | Q05932 | protein_coding | deleterious(0.01) | possibly_damaging(0.843) | TCGA-AA-3930-01 | Colorectum | colon adenocarcinoma | Male | >=65 | III/IV | Chemotherapy | capecitabine | PD |
| FPGS | SNV | Missense_Mutation | c.1249G>A | p.Gly417Arg | p.G417R | Q05932 | protein_coding | tolerated(0.06) | possibly_damaging(0.766) | TCGA-AZ-6598-01 | Colorectum | colon adenocarcinoma | Female | >=65 | I/II | Unknown | Unknown | SD |
| Page: 1 2 3 4 |
Top |
Related drugs of malignant transformation related genes |
| Identification of chemicals and drugs interact with genes involved in malignant transfromation |
| (DGIdb 4.0) |
| Entrez ID | Symbol | Category | Interaction Types | Drug Claim Name | Drug Name | PMIDs |
| 2356 | FPGS | ENZYME, DRUGGABLE GENOME | 5-FU | FLUOROURACIL | 9291820 | |
| 2356 | FPGS | ENZYME, DRUGGABLE GENOME | methotrexate | METHOTREXATE | 19902562 | |
| 2356 | FPGS | ENZYME, DRUGGABLE GENOME | warfarin | WARFARIN |
| Page: 1 |

Copyright 2023-Present -The University of Texas Health Science Center at Houston |