
|
|||||
|
 | |
| |
| |
| |
| |
| |
|
Gene: FOXQ1 |
Gene summary for FOXQ1 |
| Gene information | Species | Human | Gene symbol | FOXQ1 | Gene ID | 94234 |
| Gene name | forkhead box Q1 | |
| Gene Alias | HFH1 | |
| Cytomap | 6p25.3 | |
| Gene Type | protein-coding | GO ID | GO:0000122 | UniProtAcc | Q9C009 |
Top |
Malignant transformation analysis |
| Identification of the aberrant gene expression in precancerous and cancerous lesions by comparing the gene expression of stem-like cells in diseased tissues with normal stem cells |
| Entrez ID | Symbol | Replicates | Species | Organ | Tissue | Adj P-value | Log2FC | Malignancy |
| 94234 | FOXQ1 | HTA11_3410_2000001011 | Human | Colorectum | AD | 1.83e-02 | 1.03e-01 | 0.0155 |
| 94234 | FOXQ1 | HTA11_1938_2000001011 | Human | Colorectum | AD | 5.27e-05 | 3.19e-01 | -0.0811 |
| 94234 | FOXQ1 | HTA11_78_2000001011 | Human | Colorectum | AD | 7.65e-07 | 3.05e-01 | -0.1088 |
| 94234 | FOXQ1 | HTA11_1391_2000001011 | Human | Colorectum | AD | 4.63e-07 | 2.38e-01 | -0.059 |
| 94234 | FOXQ1 | HTA11_866_3004761011 | Human | Colorectum | AD | 1.85e-21 | 5.18e-01 | 0.096 |
| 94234 | FOXQ1 | HTA11_10711_2000001011 | Human | Colorectum | AD | 3.52e-05 | 2.67e-01 | 0.0338 |
| 94234 | FOXQ1 | HTA11_7696_3000711011 | Human | Colorectum | AD | 3.80e-25 | 5.74e-01 | 0.0674 |
| 94234 | FOXQ1 | HTA11_6818_2000001021 | Human | Colorectum | AD | 2.17e-23 | 7.43e-01 | 0.0588 |
| 94234 | FOXQ1 | HTA11_99999970781_79442 | Human | Colorectum | MSS | 1.38e-30 | 6.68e-01 | 0.294 |
| 94234 | FOXQ1 | HTA11_99999971662_82457 | Human | Colorectum | MSS | 1.59e-37 | 7.65e-01 | 0.3859 |
| 94234 | FOXQ1 | HTA11_99999973899_84307 | Human | Colorectum | MSS | 6.27e-19 | 6.07e-01 | 0.2585 |
| 94234 | FOXQ1 | HTA11_99999974143_84620 | Human | Colorectum | MSS | 9.10e-25 | 6.41e-01 | 0.3005 |
| 94234 | FOXQ1 | A002-C-203 | Human | Colorectum | FAP | 1.82e-03 | 1.81e-01 | 0.2786 |
| 94234 | FOXQ1 | CRC-1-8810 | Human | Colorectum | CRC | 7.63e-19 | 4.97e-01 | 0.6257 |
| 94234 | FOXQ1 | CRC-3-11773 | Human | Colorectum | CRC | 2.00e-05 | 2.59e-01 | 0.2564 |
| 94234 | FOXQ1 | HCC1 | Human | Liver | HCC | 9.01e-25 | 6.22e+00 | 0.5336 |
| 94234 | FOXQ1 | HCC2 | Human | Liver | HCC | 2.50e-06 | 1.84e+00 | 0.5341 |
| 94234 | FOXQ1 | S014 | Human | Liver | HCC | 9.97e-44 | 1.52e+00 | 0.2254 |
| 94234 | FOXQ1 | S015 | Human | Liver | HCC | 4.77e-33 | 1.61e+00 | 0.2375 |
| 94234 | FOXQ1 | S016 | Human | Liver | HCC | 2.10e-33 | 1.18e+00 | 0.2243 |
| Page: 1 2 3 4 |
| Tissue | Expression Dynamics | Abbreviation |
| Colorectum (GSE201348) | 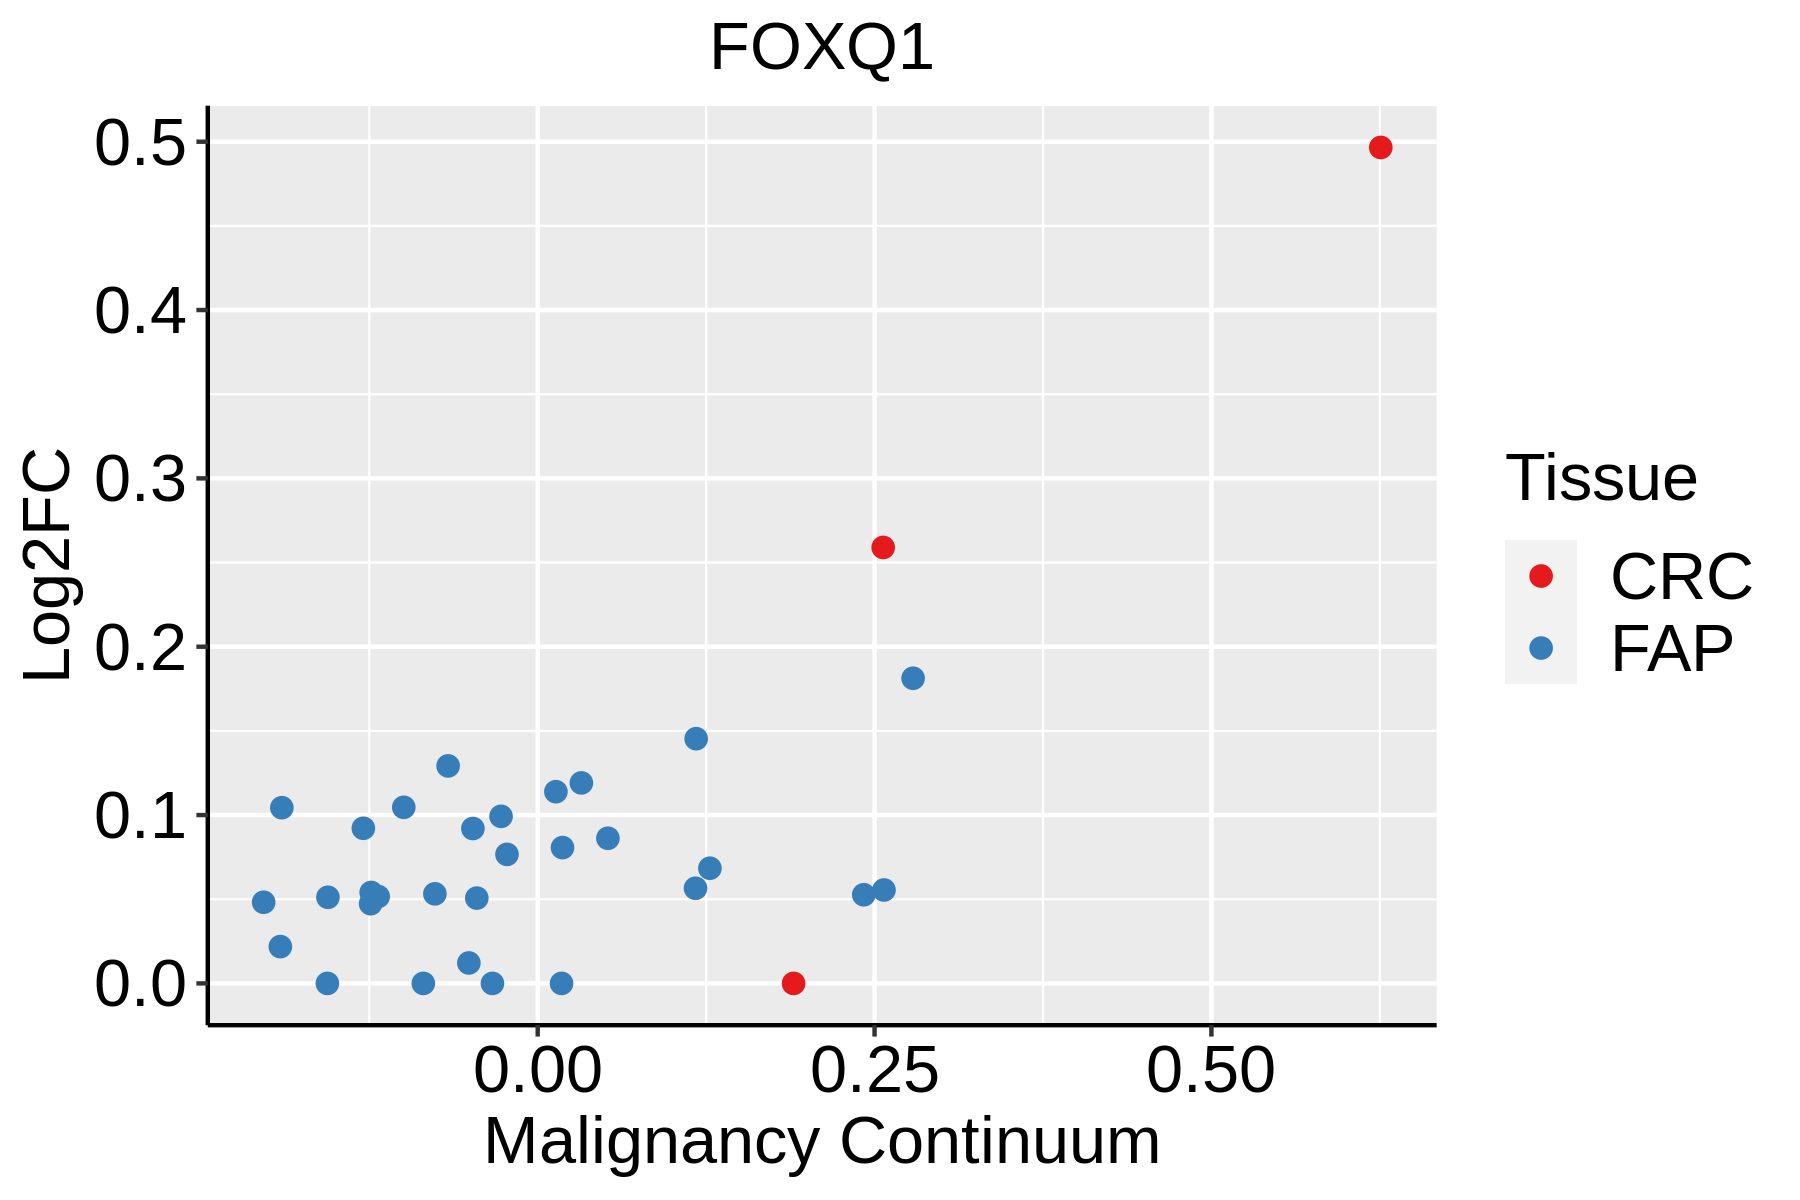 | FAP: Familial adenomatous polyposis |
| CRC: Colorectal cancer | ||
| Colorectum (HTA11) |  | AD: Adenomas |
| SER: Sessile serrated lesions | ||
| MSI-H: Microsatellite-high colorectal cancer | ||
| MSS: Microsatellite stable colorectal cancer | ||
| GC |  | CAG: Chronic atrophic gastritis |
| CAG with IM: Chronic atrophic gastritis with intestinal metaplasia | ||
| CSG: Chronic superficial gastritis | ||
| GC: Gastric cancer | ||
| SIM: Severe intestinal metaplasia | ||
| WIM: Wild intestinal metaplasia | ||
| Liver | 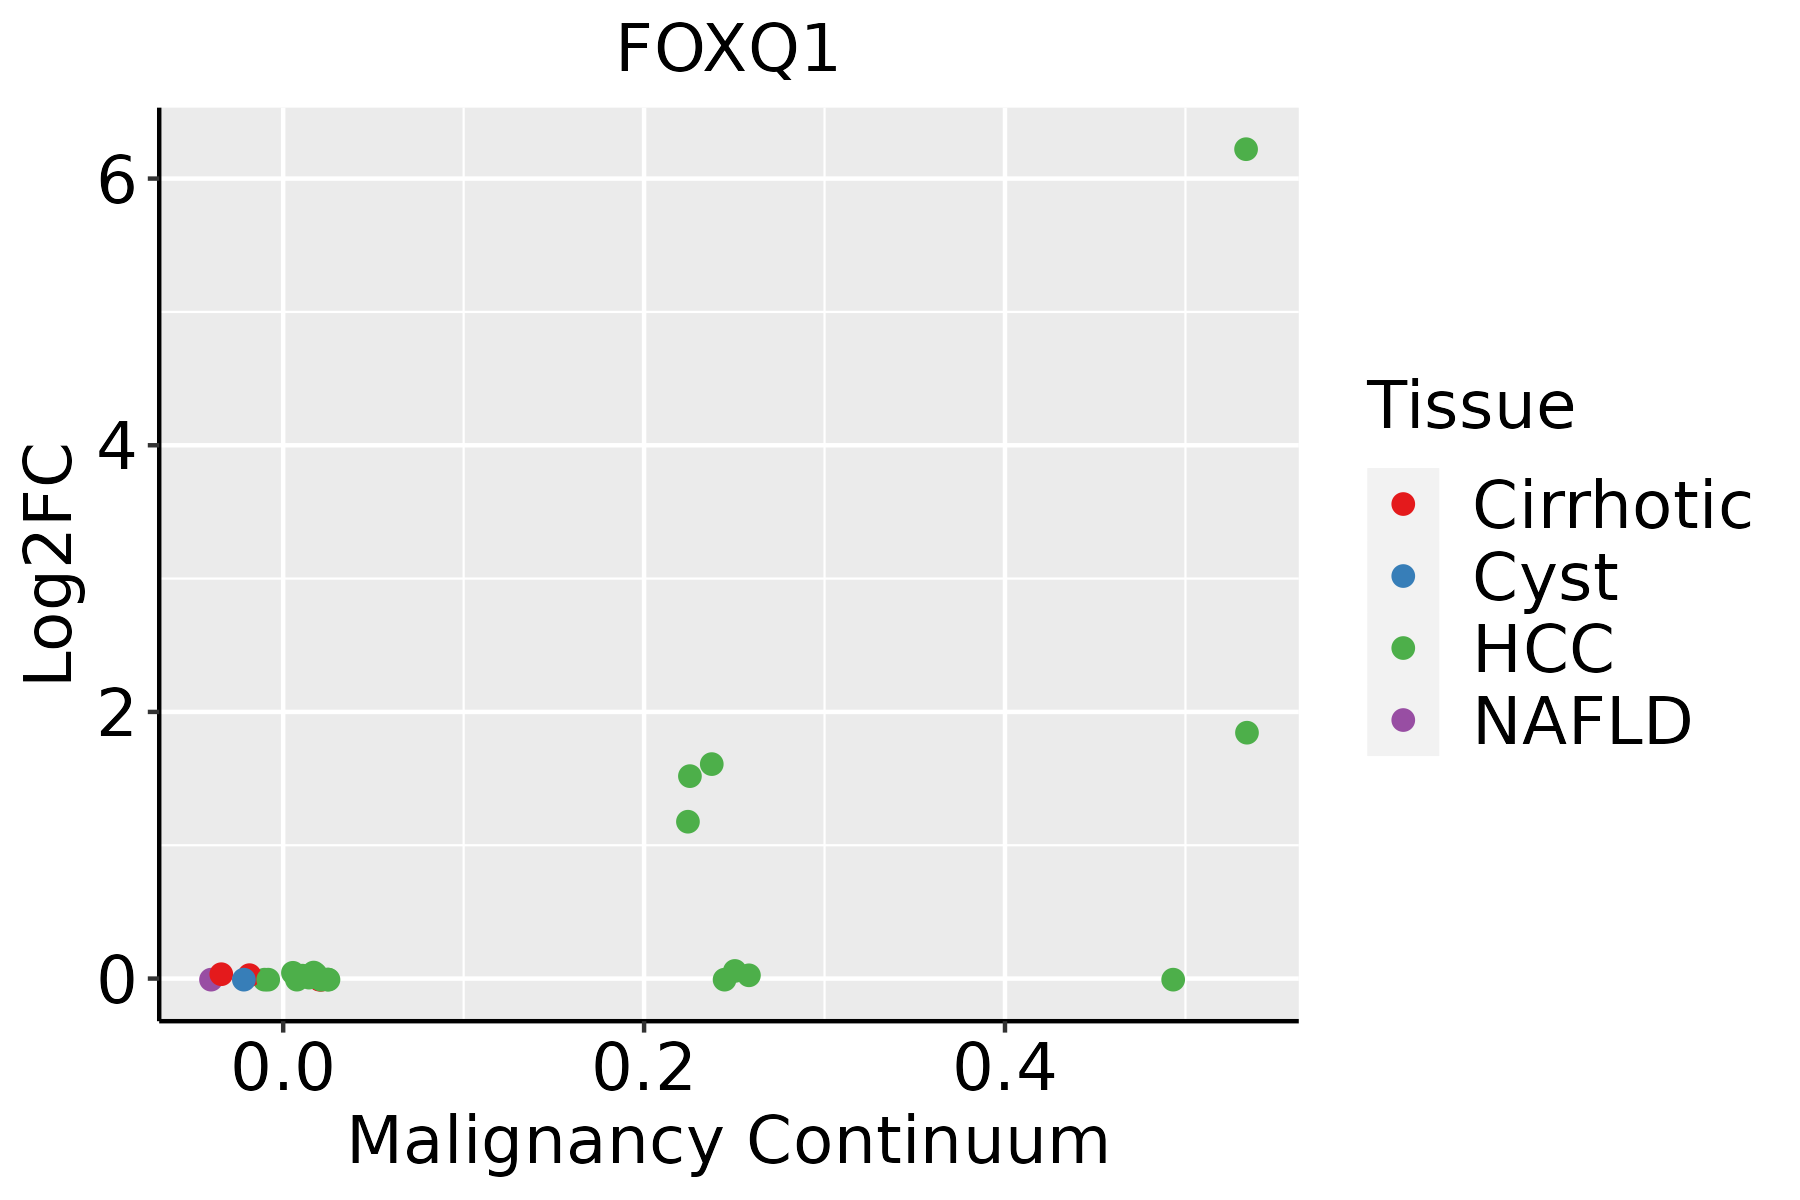 | HCC: Hepatocellular carcinoma |
| NAFLD: Non-alcoholic fatty liver disease | ||
| Skin | 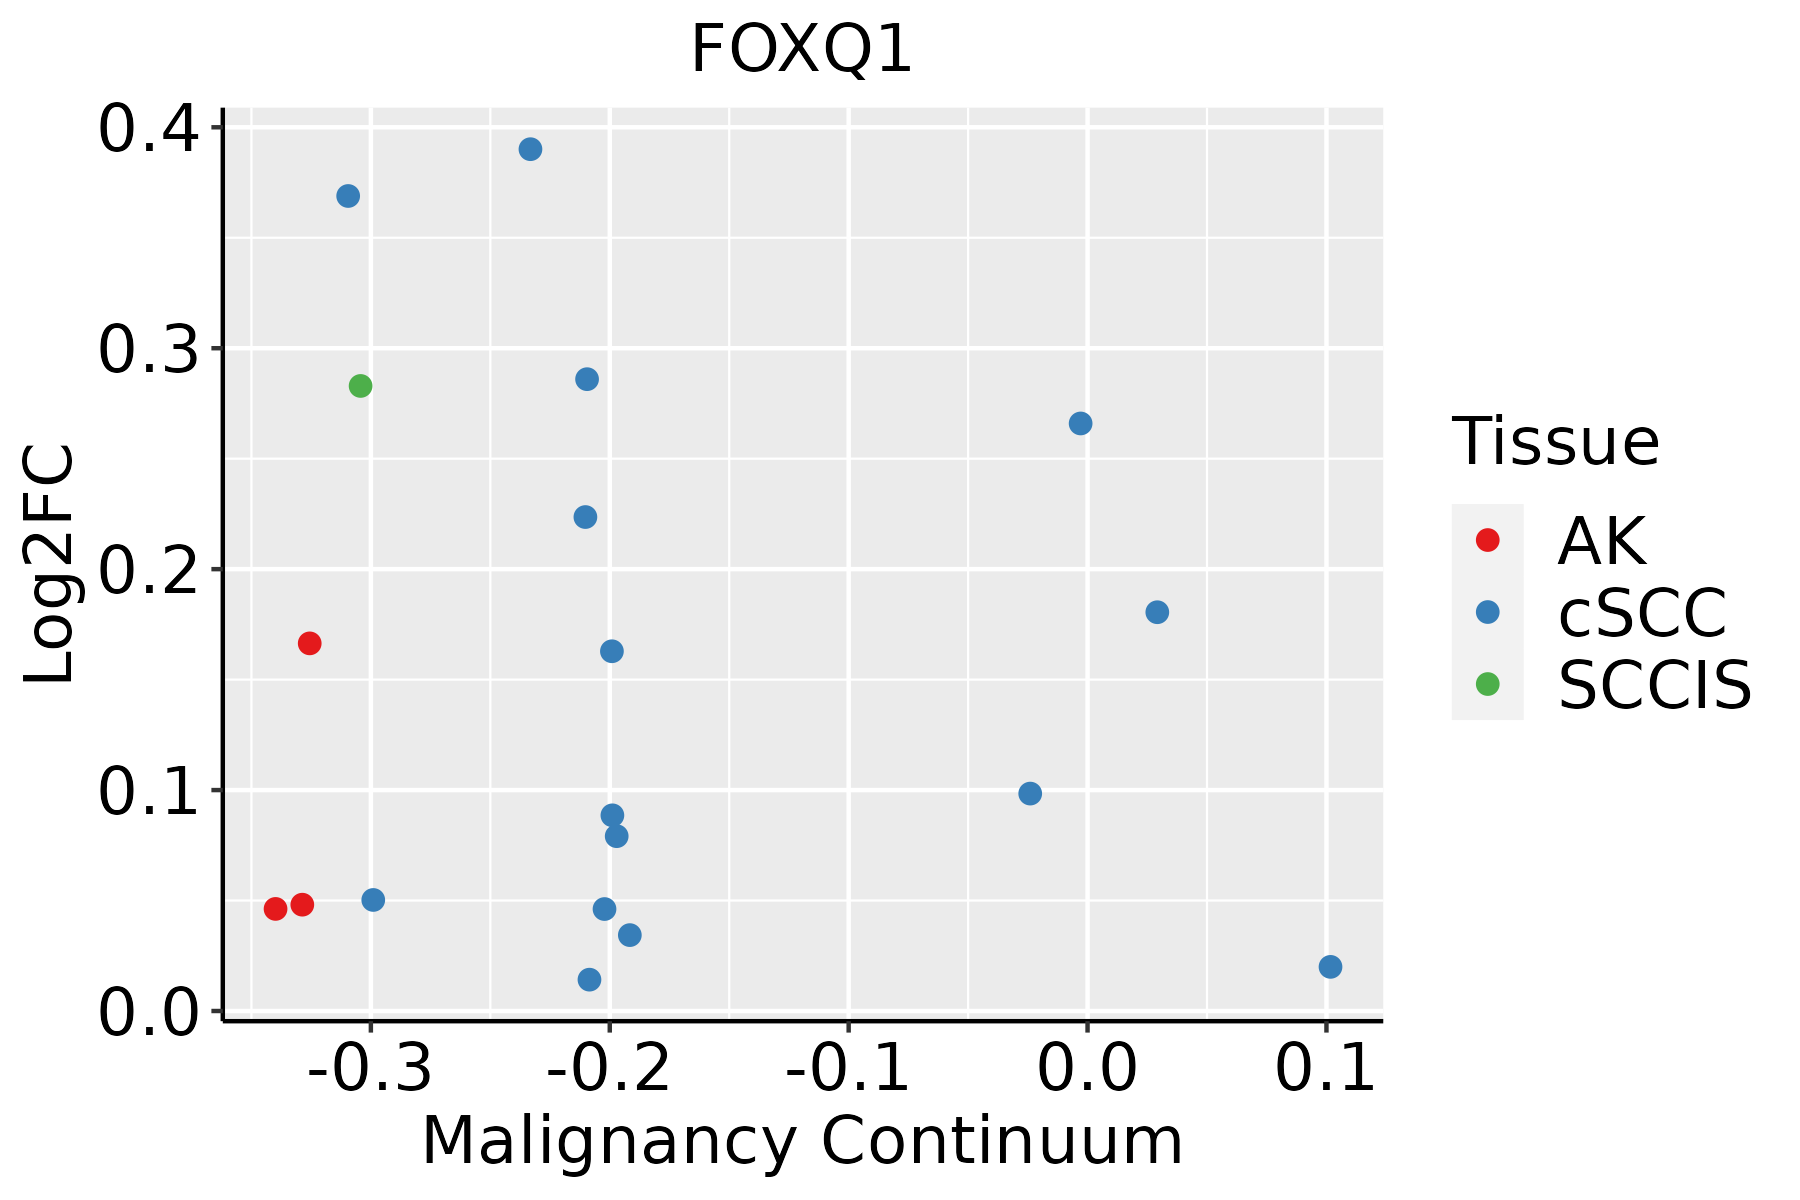 | AK: Actinic keratosis |
| cSCC: Cutaneous squamous cell carcinoma | ||
| SCCIS:squamous cell carcinoma in situ | ||
| Thyroid | 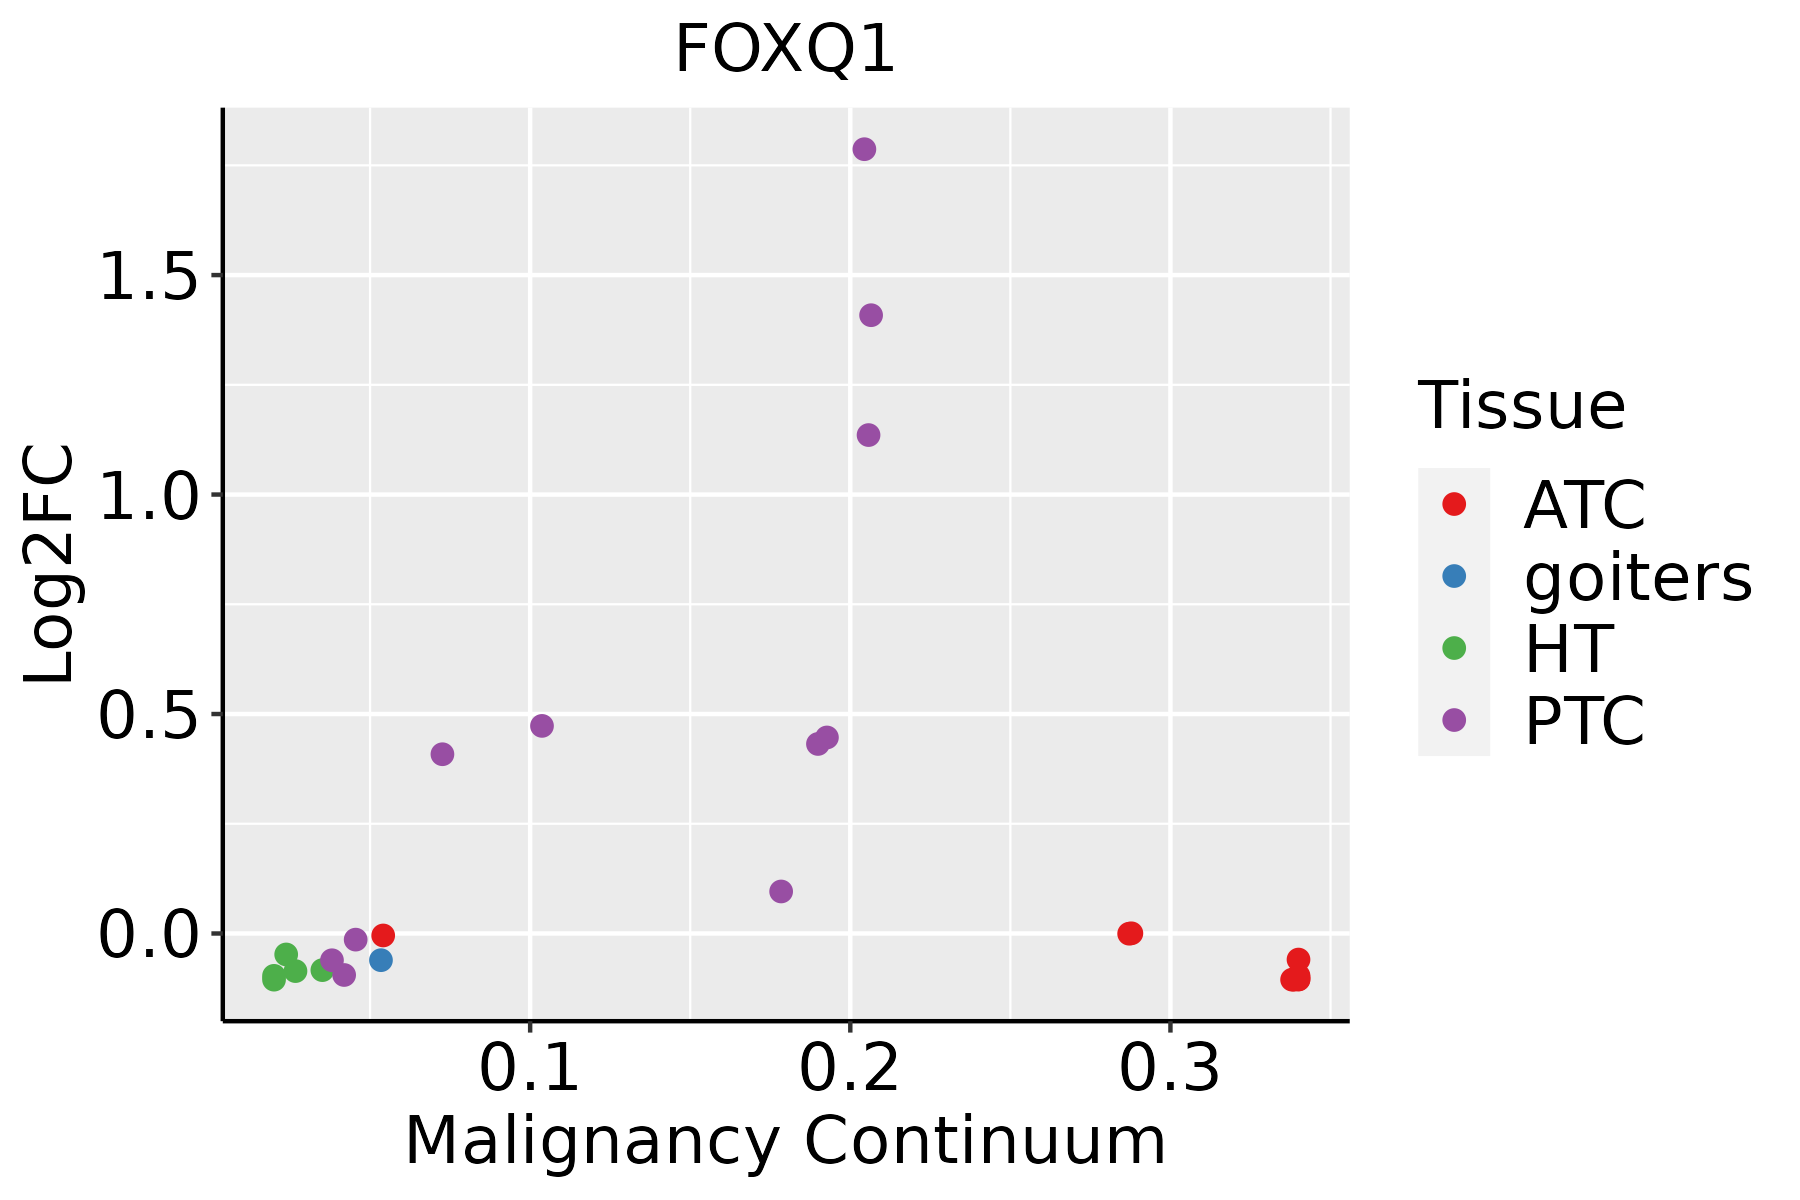 | ATC: Anaplastic thyroid cancer |
| HT: Hashimoto's thyroiditis | ||
| PTC: Papillary thyroid cancer |
| ∗log2FC in expression of this searched gene in stem-like cells from each diseased tissue sample relative to stem-like cells in normal samples in each tissue plotted against the malignancy continuum. Samples are colored based on if they are from different disease stage. |
Top |
Malignant transformation related pathway analysis |
| Find out the enriched GO biological processes and KEGG pathways involved in transition from healthy to precancer to cancer |
| Tissue | Disease Stage | Enriched GO biological Processes |
| Colorectum | AD |  |
| Colorectum | SER |  |
| Colorectum | MSS |  |
| Colorectum | MSI-H |  |
| Colorectum | FAP |  |
| ∗Top 15 enriched GO BP terms are showed in the bar plot of each disease state in each tissue. Each row represents a significant GO biological process which is colored according to the -log10(p.adjust). |
| Page: 1 2 3 4 5 6 7 8 9 |
| GO ID | Tissue | Disease Stage | Description | Gene Ratio | Bg Ratio | pvalue | p.adjust | Count |
| GO:0070997 | Colorectum | AD | neuron death | 114/3918 | 361/18723 | 1.13e-06 | 3.72e-05 | 114 |
| GO:1901214 | Colorectum | AD | regulation of neuron death | 99/3918 | 319/18723 | 1.26e-05 | 2.76e-04 | 99 |
| GO:0051402 | Colorectum | AD | neuron apoptotic process | 77/3918 | 246/18723 | 8.07e-05 | 1.28e-03 | 77 |
| GO:1901215 | Colorectum | AD | negative regulation of neuron death | 67/3918 | 208/18723 | 8.81e-05 | 1.35e-03 | 67 |
| GO:0043523 | Colorectum | AD | regulation of neuron apoptotic process | 64/3918 | 212/18723 | 8.95e-04 | 8.63e-03 | 64 |
| GO:0008544 | Colorectum | AD | epidermis development | 87/3918 | 324/18723 | 5.99e-03 | 3.76e-02 | 87 |
| GO:0043524 | Colorectum | AD | negative regulation of neuron apoptotic process | 43/3918 | 145/18723 | 8.04e-03 | 4.73e-02 | 43 |
| GO:00709972 | Colorectum | MSS | neuron death | 97/3467 | 361/18723 | 5.21e-05 | 9.31e-04 | 97 |
| GO:19012142 | Colorectum | MSS | regulation of neuron death | 83/3467 | 319/18723 | 5.28e-04 | 5.99e-03 | 83 |
| GO:00514022 | Colorectum | MSS | neuron apoptotic process | 66/3467 | 246/18723 | 7.94e-04 | 8.36e-03 | 66 |
| GO:19012152 | Colorectum | MSS | negative regulation of neuron death | 53/3467 | 208/18723 | 7.60e-03 | 4.77e-02 | 53 |
| GO:00709974 | Colorectum | FAP | neuron death | 81/2622 | 361/18723 | 8.35e-06 | 2.46e-04 | 81 |
| GO:00514024 | Colorectum | FAP | neuron apoptotic process | 55/2622 | 246/18723 | 2.42e-04 | 3.37e-03 | 55 |
| GO:0043588 | Colorectum | FAP | skin development | 58/2622 | 263/18723 | 2.44e-04 | 3.39e-03 | 58 |
| GO:19012144 | Colorectum | FAP | regulation of neuron death | 67/2622 | 319/18723 | 3.73e-04 | 4.63e-03 | 67 |
| GO:19012153 | Colorectum | FAP | negative regulation of neuron death | 46/2622 | 208/18723 | 9.52e-04 | 9.42e-03 | 46 |
| GO:00085441 | Colorectum | FAP | epidermis development | 66/2622 | 324/18723 | 9.63e-04 | 9.51e-03 | 66 |
| GO:0022404 | Colorectum | FAP | molting cycle process | 21/2622 | 84/18723 | 5.10e-03 | 3.37e-02 | 21 |
| GO:0022405 | Colorectum | FAP | hair cycle process | 21/2622 | 84/18723 | 5.10e-03 | 3.37e-02 | 21 |
| GO:00435233 | Colorectum | FAP | regulation of neuron apoptotic process | 43/2622 | 212/18723 | 7.28e-03 | 4.38e-02 | 43 |
| Page: 1 2 3 4 5 |
| Pathway ID | Tissue | Disease Stage | Description | Gene Ratio | Bg Ratio | pvalue | p.adjust | qvalue | Count |
| Page: 1 |
Top |
Cell-cell communication analysis |
| Identification of potential cell-cell interactions between two cell types and their ligand-receptor pairs for different disease states |
| Ligand | Receptor | LRpair | Pathway | Tissue | Disease Stage |
| Page: 1 |
Top |
Single-cell gene regulatory network inference analysis |
| Find out the significant the regulons (TFs) and the target genes of each regulon across cell types for different disease states |
| TF | Cell Type | Tissue | Disease Stage | Target Gene | RSS | Regulon Activity |
| FOXQ1 | STM | Colorectum | AD | TMEM132C,ADAM19,SOD3, etc. | 1.21e-01 |  |
| FOXQ1 | ICAF | Endometrium | AEH | ADM,PLCG2,STC2, etc. | 1.70e-02 |  |
| FOXQ1 | ICAF | Endometrium | EEC | ADM,PLCG2,STC2, etc. | 3.36e-01 |  |
| FOXQ1 | STM | Esophagus | Healthy | ODC1,CCNG2,NDEL1, etc. | 4.65e-01 |  |
| FOXQ1 | MDSCs | Esophagus | ADJ | ATG101,ZFP37,SLC19A2, etc. | 4.45e-01 |  |
| FOXQ1 | MDSCs | Esophagus | ESCC | ATG101,ZFP37,SLC19A2, etc. | 5.79e-01 |  |
| FOXQ1 | MAST | Esophagus | Healthy | ATG101,ZFP37,SLC19A2, etc. | 6.86e-02 | |
| FOXQ1 | PMC | Stomach | ADJ | CLDN18,CA2,S100P, etc. | 3.19e-01 |  |
| FOXQ1 | PMC | Stomach | CAG | CLDN18,CA2,S100P, etc. | 7.26e-01 |  |
| FOXQ1 | PMC | Stomach | CAG with IM | CLDN18,CA2,S100P, etc. | 2.37e-01 |  |
| ∗The dot plots of a searched regulon are shown for all cell subpopulations in each disease state of each tissue based on the regulon specific score inferred using pySCENIC and by calculating the average expression. |
| Page: 1 2 |
Top |
Somatic mutation of malignant transformation related genes |
| Annotation of somatic variants for genes involved in malignant transformation |
| Hugo Symbol | Variant Class | Variant Classification | dbSNP RS | HGVSc | HGVSp | HGVSp Short | SWISSPROT | BIOTYPE | SIFT | PolyPhen | Tumor Sample Barcode | Tissue | Histology | Sex | Age | Stage | Therapy Types | Drugs | Outcome |
| FOXQ1 | SNV | Missense_Mutation | c.373N>C | p.Ile125Leu | p.I125L | Q9C009 | protein_coding | deleterious(0.02) | possibly_damaging(0.761) | TCGA-FU-A3HZ-01 | Cervix | cervical & endocervical cancer | Female | <65 | I/II | Chemotherapy | cisplatin | CR | |
| FOXQ1 | SNV | Missense_Mutation | novel | c.582N>C | p.Trp194Cys | p.W194C | Q9C009 | protein_coding | deleterious(0) | probably_damaging(0.997) | TCGA-ZJ-AAXA-01 | Cervix | cervical & endocervical cancer | Female | <65 | I/II | Unknown | Unknown | SD |
| FOXQ1 | deletion | Frame_Shift_Del | novel | c.363delC | p.Tyr122ThrfsTer19 | p.Y122Tfs*19 | Q9C009 | protein_coding | TCGA-EA-A5ZE-01 | Cervix | cervical & endocervical cancer | Female | <65 | I/II | Unknown | Unknown | PD | ||
| FOXQ1 | SNV | Missense_Mutation | rs770819384 | c.463T>C | p.Phe155Leu | p.F155L | Q9C009 | protein_coding | deleterious(0) | probably_damaging(0.934) | TCGA-5M-AAT6-01 | Colorectum | colon adenocarcinoma | Female | <65 | III/IV | Unknown | Unknown | PD |
| FOXQ1 | SNV | Missense_Mutation | novel | c.242N>T | p.Ala81Val | p.A81V | Q9C009 | protein_coding | tolerated(0.06) | benign(0) | TCGA-A6-6780-01 | Colorectum | colon adenocarcinoma | Male | >=65 | I/II | Unknown | Unknown | SD |
| FOXQ1 | SNV | Missense_Mutation | novel | c.376N>A | p.Ala126Thr | p.A126T | Q9C009 | protein_coding | deleterious(0.01) | probably_damaging(0.934) | TCGA-EO-A22R-01 | Endometrium | uterine corpus endometrioid carcinoma | Female | <65 | I/II | Unknown | Unknown | SD |
| FOXQ1 | SNV | Missense_Mutation | novel | c.56A>G | p.Asp19Gly | p.D19G | Q9C009 | protein_coding | deleterious(0) | possibly_damaging(0.587) | TCGA-FI-A2D5-01 | Endometrium | uterine corpus endometrioid carcinoma | Female | <65 | III/IV | Chemotherapy | carboplatinum | PD |
| FOXQ1 | SNV | Missense_Mutation | novel | c.430G>A | p.Glu144Lys | p.E144K | Q9C009 | protein_coding | deleterious(0.02) | possibly_damaging(0.46) | TCGA-91-7771-01 | Lung | lung adenocarcinoma | Male | <65 | I/II | Chemotherapy | cisplatin | CR |
| FOXQ1 | SNV | Missense_Mutation | c.542N>C | p.Leu181Pro | p.L181P | Q9C009 | protein_coding | tolerated(0.28) | possibly_damaging(0.518) | TCGA-97-8177-01 | Lung | lung adenocarcinoma | Female | <65 | I/II | Chemotherapy | alimta | SD | |
| FOXQ1 | SNV | Missense_Mutation | novel | c.435N>G | p.Ile145Met | p.I145M | Q9C009 | protein_coding | deleterious(0) | probably_damaging(1) | TCGA-56-8626-01 | Lung | lung squamous cell carcinoma | Male | <65 | I/II | Unknown | Unknown | SD |
| Page: 1 2 |
Top |
Related drugs of malignant transformation related genes |
| Identification of chemicals and drugs interact with genes involved in malignant transfromation |
| (DGIdb 4.0) |
| Entrez ID | Symbol | Category | Interaction Types | Drug Claim Name | Drug Name | PMIDs |
| Page: 1 |

Copyright 2023-Present -The University of Texas Health Science Center at Houston |