
|
|||||
|
 | |
| |
| |
| |
| |
| |
|
Gene: FOXP4 |
Gene summary for FOXP4 |
| Gene information | Species | Human | Gene symbol | FOXP4 | Gene ID | 116113 |
| Gene name | forkhead box P4 | |
| Gene Alias | hFKHLA | |
| Cytomap | 6p21.1 | |
| Gene Type | protein-coding | GO ID | GO:0000122 | UniProtAcc | Q8IVH2 |
Top |
Malignant transformation analysis |
| Identification of the aberrant gene expression in precancerous and cancerous lesions by comparing the gene expression of stem-like cells in diseased tissues with normal stem cells |
| Entrez ID | Symbol | Replicates | Species | Organ | Tissue | Adj P-value | Log2FC | Malignancy |
| 116113 | FOXP4 | LZE2T | Human | Esophagus | ESCC | 8.58e-05 | 4.89e-01 | 0.082 |
| 116113 | FOXP4 | LZE24T | Human | Esophagus | ESCC | 6.20e-04 | 4.05e-02 | 0.0596 |
| 116113 | FOXP4 | P2T-E | Human | Esophagus | ESCC | 8.15e-18 | 2.94e-01 | 0.1177 |
| 116113 | FOXP4 | P4T-E | Human | Esophagus | ESCC | 6.19e-17 | 1.81e-01 | 0.1323 |
| 116113 | FOXP4 | P8T-E | Human | Esophagus | ESCC | 3.38e-13 | 2.63e-01 | 0.0889 |
| 116113 | FOXP4 | P9T-E | Human | Esophagus | ESCC | 8.51e-06 | 5.55e-02 | 0.1131 |
| 116113 | FOXP4 | P10T-E | Human | Esophagus | ESCC | 1.62e-03 | 4.59e-03 | 0.116 |
| 116113 | FOXP4 | P11T-E | Human | Esophagus | ESCC | 3.14e-03 | 7.37e-02 | 0.1426 |
| 116113 | FOXP4 | P12T-E | Human | Esophagus | ESCC | 2.49e-08 | 1.49e-02 | 0.1122 |
| 116113 | FOXP4 | P16T-E | Human | Esophagus | ESCC | 3.43e-09 | 1.03e-01 | 0.1153 |
| 116113 | FOXP4 | P17T-E | Human | Esophagus | ESCC | 2.23e-03 | 1.49e-01 | 0.1278 |
| 116113 | FOXP4 | P21T-E | Human | Esophagus | ESCC | 8.94e-08 | 6.31e-02 | 0.1617 |
| 116113 | FOXP4 | P22T-E | Human | Esophagus | ESCC | 3.02e-13 | 7.15e-02 | 0.1236 |
| 116113 | FOXP4 | P23T-E | Human | Esophagus | ESCC | 5.95e-10 | 1.62e-01 | 0.108 |
| 116113 | FOXP4 | P24T-E | Human | Esophagus | ESCC | 1.07e-02 | 2.25e-02 | 0.1287 |
| 116113 | FOXP4 | P26T-E | Human | Esophagus | ESCC | 1.86e-02 | -4.23e-03 | 0.1276 |
| 116113 | FOXP4 | P27T-E | Human | Esophagus | ESCC | 1.99e-09 | 7.62e-02 | 0.1055 |
| 116113 | FOXP4 | P28T-E | Human | Esophagus | ESCC | 1.46e-06 | 7.45e-02 | 0.1149 |
| 116113 | FOXP4 | P30T-E | Human | Esophagus | ESCC | 5.97e-05 | 8.81e-02 | 0.137 |
| 116113 | FOXP4 | P31T-E | Human | Esophagus | ESCC | 6.00e-07 | 7.98e-02 | 0.1251 |
| Page: 1 2 3 4 |
| Tissue | Expression Dynamics | Abbreviation |
| Esophagus |  | ESCC: Esophageal squamous cell carcinoma |
| HGIN: High-grade intraepithelial neoplasias | ||
| LGIN: Low-grade intraepithelial neoplasias | ||
| Liver | 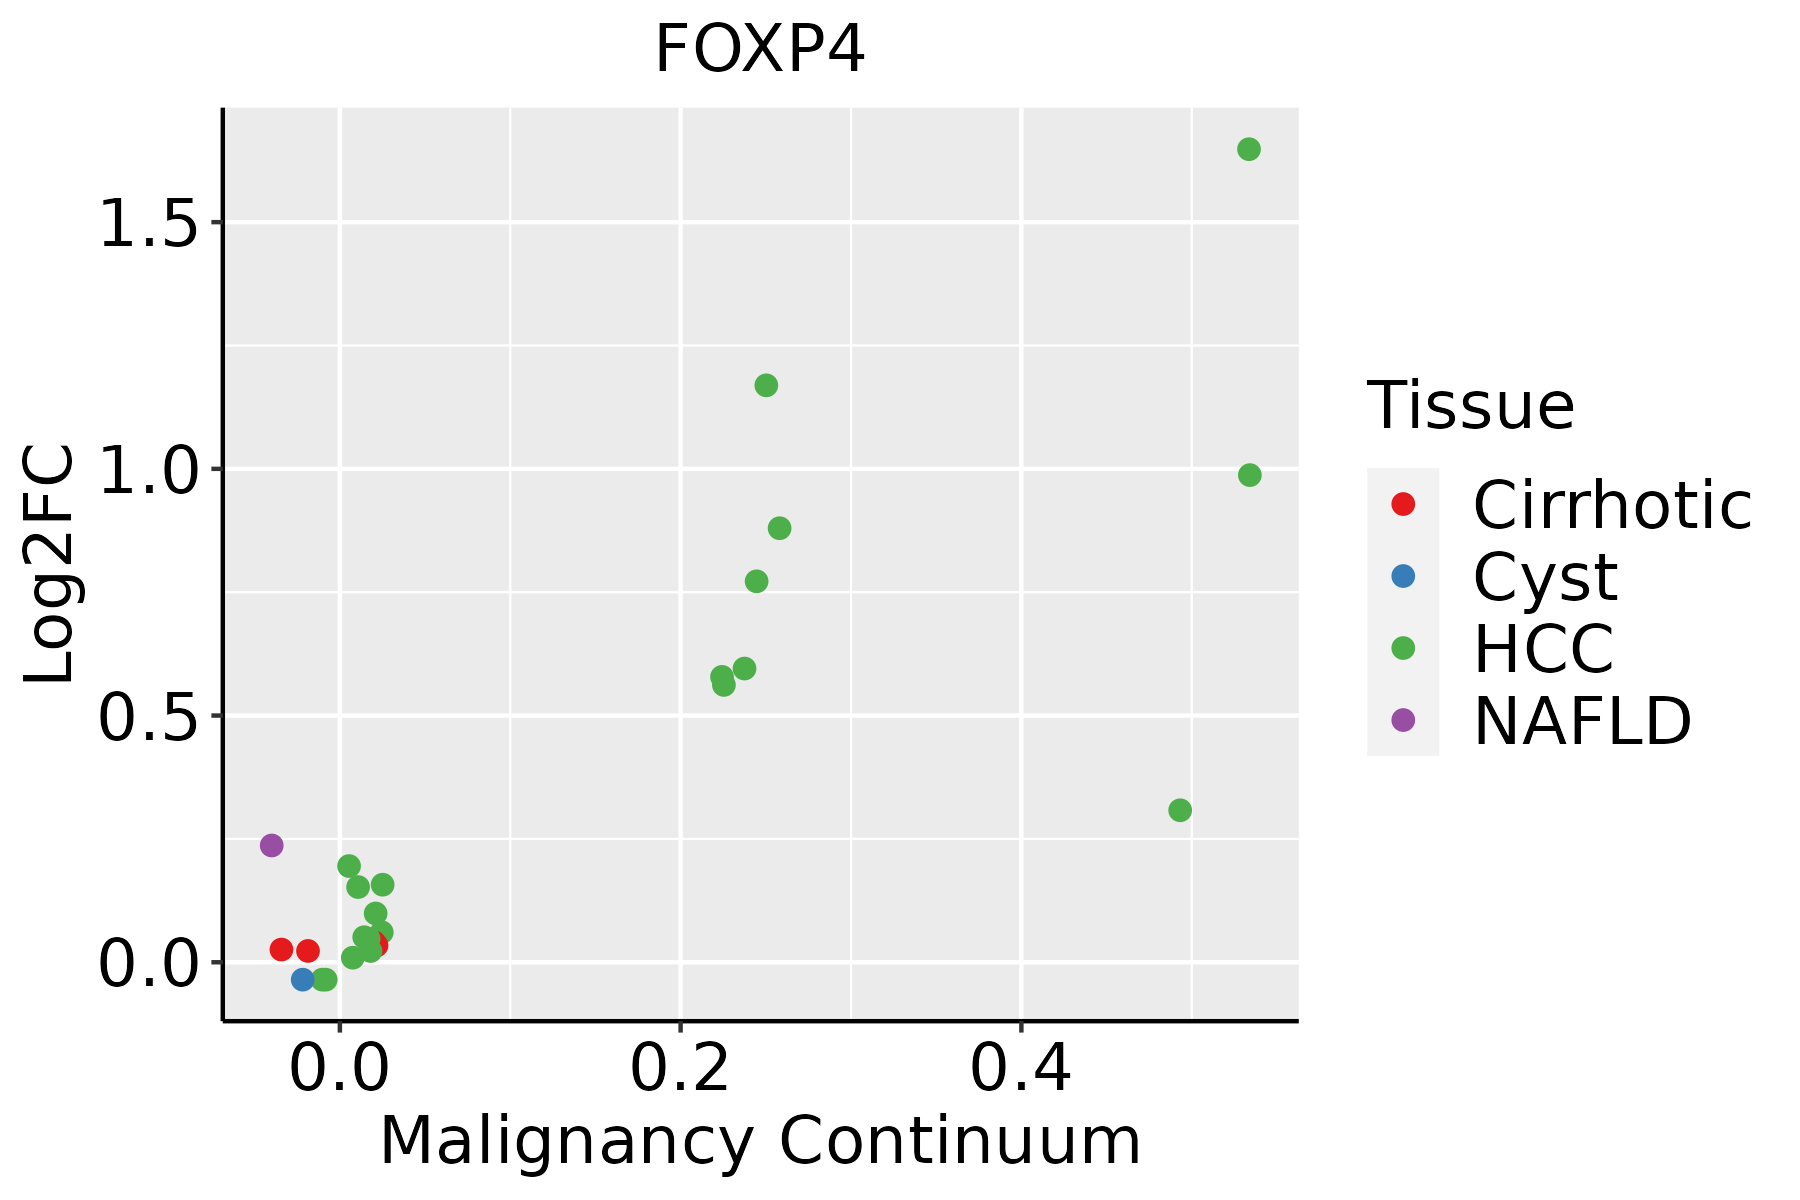 | HCC: Hepatocellular carcinoma |
| NAFLD: Non-alcoholic fatty liver disease | ||
| Thyroid | 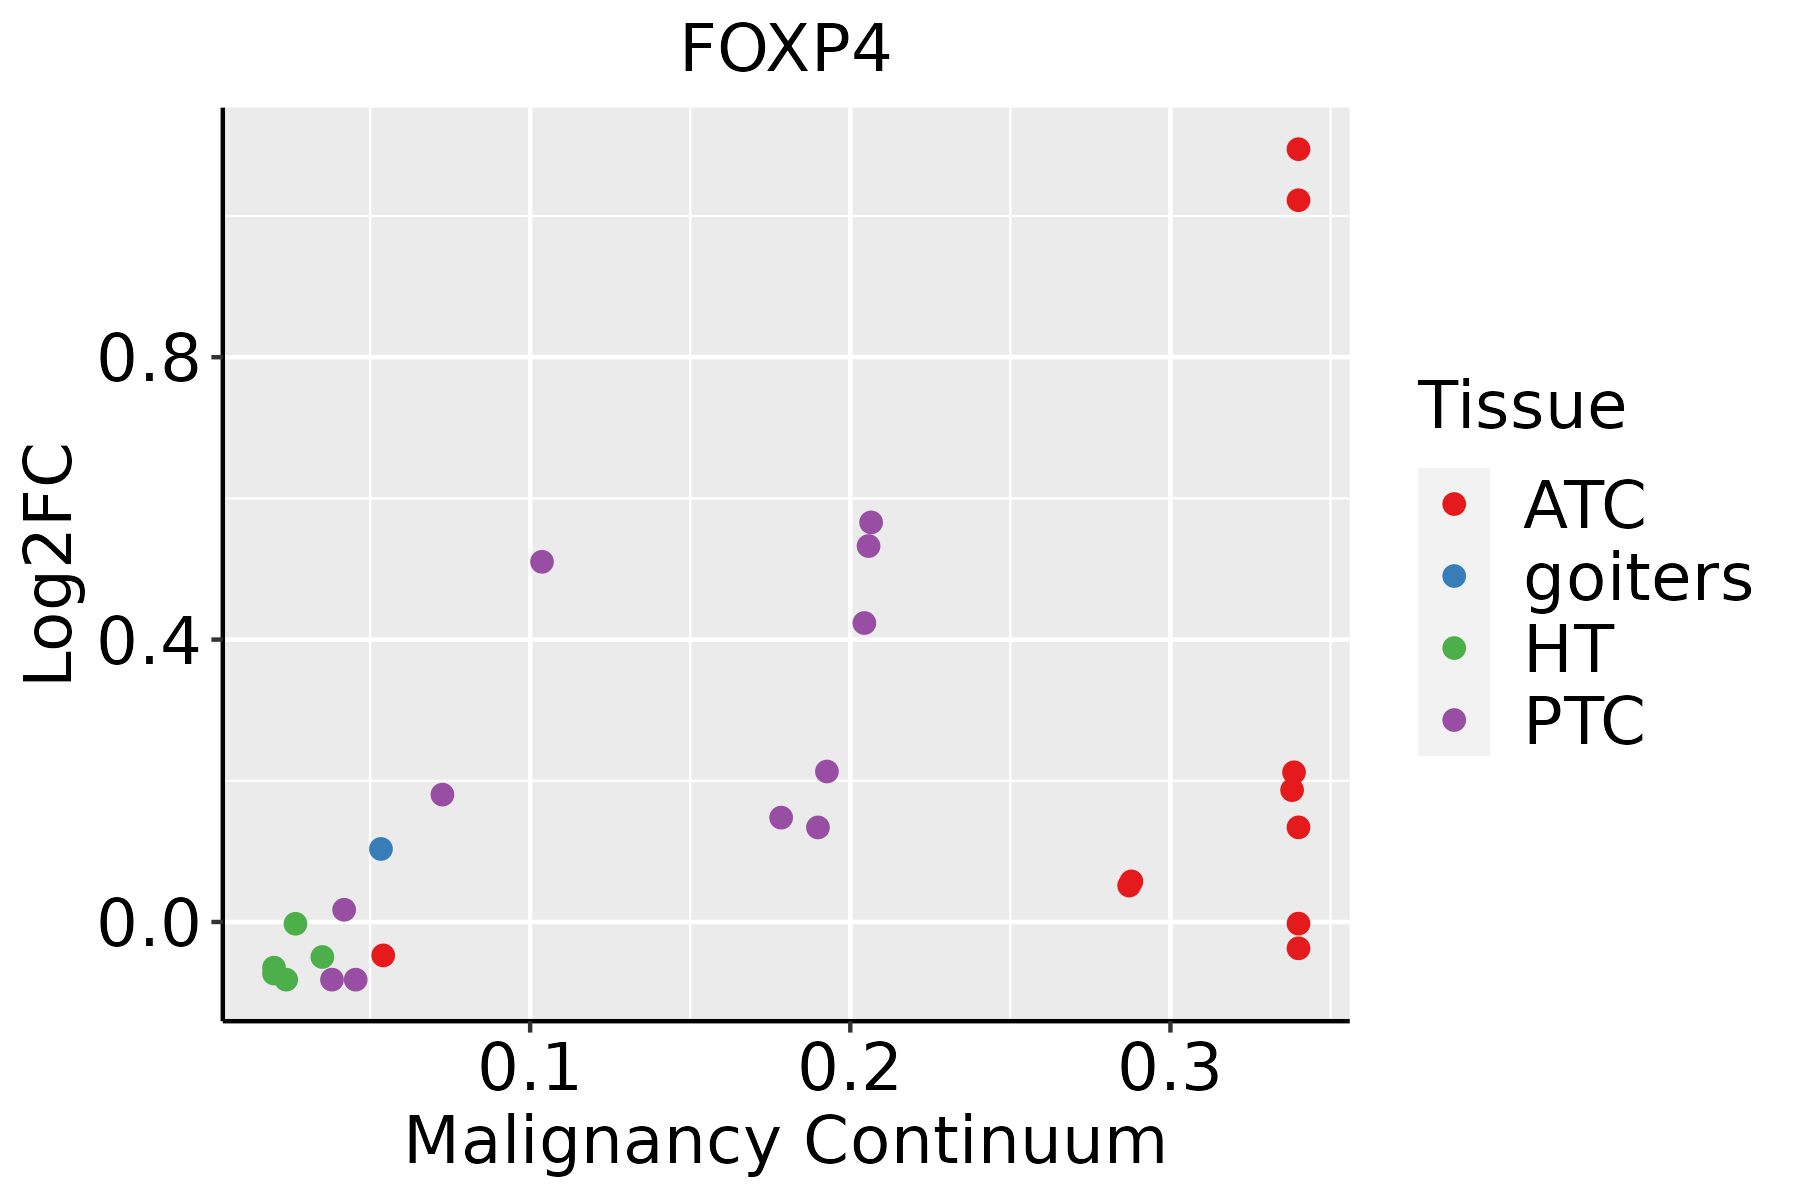 | ATC: Anaplastic thyroid cancer |
| HT: Hashimoto's thyroiditis | ||
| PTC: Papillary thyroid cancer |
| ∗log2FC in expression of this searched gene in stem-like cells from each diseased tissue sample relative to stem-like cells in normal samples in each tissue plotted against the malignancy continuum. Samples are colored based on if they are from different disease stage. |
Top |
Malignant transformation related pathway analysis |
| Find out the enriched GO biological processes and KEGG pathways involved in transition from healthy to precancer to cancer |
| Tissue | Disease Stage | Enriched GO biological Processes |
| Colorectum | AD |  |
| Colorectum | SER |  |
| Colorectum | MSS |  |
| Colorectum | MSI-H |  |
| Colorectum | FAP |  |
| ∗Top 15 enriched GO BP terms are showed in the bar plot of each disease state in each tissue. Each row represents a significant GO biological process which is colored according to the -log10(p.adjust). |
| Page: 1 2 3 4 5 6 7 8 9 |
| GO ID | Tissue | Disease Stage | Description | Gene Ratio | Bg Ratio | pvalue | p.adjust | Count |
| Page: 1 |
| Pathway ID | Tissue | Disease Stage | Description | Gene Ratio | Bg Ratio | pvalue | p.adjust | qvalue | Count |
| Page: 1 |
Top |
Cell-cell communication analysis |
| Identification of potential cell-cell interactions between two cell types and their ligand-receptor pairs for different disease states |
| Ligand | Receptor | LRpair | Pathway | Tissue | Disease Stage |
| Page: 1 |
Top |
Single-cell gene regulatory network inference analysis |
| Find out the significant the regulons (TFs) and the target genes of each regulon across cell types for different disease states |
| TF | Cell Type | Tissue | Disease Stage | Target Gene | RSS | Regulon Activity |
| FOXP4 | MSC | Breast | DCIS | TBL2,HK1,MAD2L2, etc. | 1.82e-02 |  |
| FOXP4 | MYOFIB | Cervix | ADJ | MYLK,PSD,KCNH2, etc. | 3.99e-01 |  |
| FOXP4 | IMGOB | Colorectum | Healthy | PTCD2,ZNF35,ZDHHC18, etc. | 2.08e-01 |  |
| FOXP4 | ILC | Colorectum | AD | ASS1,CAPN5,SFN, etc. | 3.12e-02 |  |
| FOXP4 | CD8TCM | Colorectum | ADJ | ASS1,CAPN5,SFN, etc. | 1.45e-02 |  |
| FOXP4 | TH1 | Colorectum | ADJ | ASS1,CAPN5,SFN, etc. | 0.00e+00 | |
| FOXP4 | ILC | Colorectum | ADJ | ASS1,CAPN5,SFN, etc. | 4.63e-03 | |
| FOXP4 | MON | Colorectum | ADJ | ASS1,CAPN5,SFN, etc. | 6.50e-03 | |
| FOXP4 | TH17 | Colorectum | CRC | ASS1,CAPN5,SFN, etc. | 6.69e-02 |  |
| FOXP4 | BMEM | Colorectum | CRC | ASS1,CAPN5,SFN, etc. | 6.12e-02 | |
| ∗The dot plots of a searched regulon are shown for all cell subpopulations in each disease state of each tissue based on the regulon specific score inferred using pySCENIC and by calculating the average expression. |
| Page: 1 2 3 4 |
Top |
Somatic mutation of malignant transformation related genes |
| Annotation of somatic variants for genes involved in malignant transformation |
| Hugo Symbol | Variant Class | Variant Classification | dbSNP RS | HGVSc | HGVSp | HGVSp Short | SWISSPROT | BIOTYPE | SIFT | PolyPhen | Tumor Sample Barcode | Tissue | Histology | Sex | Age | Stage | Therapy Types | Drugs | Outcome |
| FOXP4 | SNV | Missense_Mutation | c.594G>C | p.Gln198His | p.Q198H | Q8IVH2 | protein_coding | deleterious(0.01) | probably_damaging(0.979) | TCGA-AC-A23H-01 | Breast | breast invasive carcinoma | Female | >=65 | I/II | Unknown | Unknown | PD | |
| FOXP4 | SNV | Missense_Mutation | rs779277938 | c.1264C>G | p.Leu422Val | p.L422V | Q8IVH2 | protein_coding | tolerated(0.31) | benign(0.074) | TCGA-AC-A3W5-01 | Breast | breast invasive carcinoma | Female | >=65 | I/II | Chemotherapy | docetaxel | CR |
| FOXP4 | SNV | Missense_Mutation | novel | c.637N>A | p.Pro213Thr | p.P213T | Q8IVH2 | protein_coding | deleterious(0.03) | benign(0.222) | TCGA-AC-A62X-01 | Breast | breast invasive carcinoma | Female | >=65 | I/II | Unknown | Unknown | SD |
| FOXP4 | SNV | Missense_Mutation | novel | c.1235N>A | p.Pro412Gln | p.P412Q | Q8IVH2 | protein_coding | deleterious(0) | possibly_damaging(0.905) | TCGA-AN-A0FN-01 | Breast | breast invasive carcinoma | Female | <65 | I/II | Unknown | Unknown | SD |
| FOXP4 | insertion | Frame_Shift_Ins | novel | c.1236_1237insAGACACAT | p.Thr413ArgfsTer79 | p.T413Rfs*79 | Q8IVH2 | protein_coding | TCGA-AN-A0FN-01 | Breast | breast invasive carcinoma | Female | <65 | I/II | Unknown | Unknown | SD | ||
| FOXP4 | SNV | Missense_Mutation | c.1411N>G | p.Thr471Ala | p.T471A | Q8IVH2 | protein_coding | deleterious(0) | probably_damaging(0.983) | TCGA-AA-3492-01 | Colorectum | colon adenocarcinoma | Female | >=65 | I/II | Unknown | Unknown | SD | |
| FOXP4 | SNV | Missense_Mutation | rs767113603 | c.1246N>A | p.Ala416Thr | p.A416T | Q8IVH2 | protein_coding | tolerated(1) | benign(0.003) | TCGA-AA-3821-01 | Colorectum | colon adenocarcinoma | Female | >=65 | I/II | Unknown | Unknown | SD |
| FOXP4 | SNV | Missense_Mutation | rs773406772 | c.1580N>A | p.Arg527His | p.R527H | Q8IVH2 | protein_coding | deleterious(0) | probably_damaging(0.998) | TCGA-AZ-4313-01 | Colorectum | colon adenocarcinoma | Female | <65 | I/II | Unknown | Unknown | SD |
| FOXP4 | SNV | Missense_Mutation | c.107N>T | p.Gly36Val | p.G36V | Q8IVH2 | protein_coding | tolerated_low_confidence(0.18) | benign(0.093) | TCGA-AH-6549-01 | Colorectum | rectum adenocarcinoma | Male | >=65 | III/IV | Unknown | Unknown | SD | |
| FOXP4 | SNV | Missense_Mutation | c.1027N>T | p.Arg343Trp | p.R343W | Q8IVH2 | protein_coding | deleterious(0) | benign(0.261) | TCGA-EF-5830-01 | Colorectum | rectum adenocarcinoma | Male | <65 | I/II | Unknown | Unknown | SD |
| Page: 1 2 3 4 5 6 |
Top |
Related drugs of malignant transformation related genes |
| Identification of chemicals and drugs interact with genes involved in malignant transfromation |
| (DGIdb 4.0) |
| Entrez ID | Symbol | Category | Interaction Types | Drug Claim Name | Drug Name | PMIDs |
| Page: 1 |

Copyright 2023-Present -The University of Texas Health Science Center at Houston |