
|
|||||
|
 | |
| |
| |
| |
| |
| |
|
Gene: FOXP2 |
Gene summary for FOXP2 |
| Gene information | Species | Human | Gene symbol | FOXP2 | Gene ID | 93986 |
| Gene name | forkhead box P2 | |
| Gene Alias | CAGH44 | |
| Cytomap | 7q31.1 | |
| Gene Type | protein-coding | GO ID | GO:0000122 | UniProtAcc | B7ZLK5 |
Top |
Malignant transformation analysis |
| Identification of the aberrant gene expression in precancerous and cancerous lesions by comparing the gene expression of stem-like cells in diseased tissues with normal stem cells |
| Entrez ID | Symbol | Replicates | Species | Organ | Tissue | Adj P-value | Log2FC | Malignancy |
| 93986 | FOXP2 | HTA11_3410_2000001011 | Human | Colorectum | AD | 3.19e-65 | -1.08e+00 | 0.0155 |
| 93986 | FOXP2 | HTA11_2487_2000001011 | Human | Colorectum | SER | 2.30e-27 | -1.01e+00 | -0.1808 |
| 93986 | FOXP2 | HTA11_2951_2000001011 | Human | Colorectum | AD | 8.08e-11 | -1.26e+00 | 0.0216 |
| 93986 | FOXP2 | HTA11_1938_2000001011 | Human | Colorectum | AD | 5.14e-26 | -1.23e+00 | -0.0811 |
| 93986 | FOXP2 | HTA11_78_2000001011 | Human | Colorectum | AD | 3.12e-13 | -7.61e-01 | -0.1088 |
| 93986 | FOXP2 | HTA11_2112_2000001011 | Human | Colorectum | SER | 2.65e-06 | -1.01e+00 | -0.2196 |
| 93986 | FOXP2 | HTA11_3361_2000001011 | Human | Colorectum | AD | 2.40e-30 | -1.20e+00 | -0.1207 |
| 93986 | FOXP2 | HTA11_83_2000001011 | Human | Colorectum | SER | 5.75e-10 | -7.26e-01 | -0.1526 |
| 93986 | FOXP2 | HTA11_696_2000001011 | Human | Colorectum | AD | 7.66e-27 | -6.93e-01 | -0.1464 |
| 93986 | FOXP2 | HTA11_866_2000001011 | Human | Colorectum | AD | 2.16e-17 | -6.68e-01 | -0.1001 |
| 93986 | FOXP2 | HTA11_1391_2000001011 | Human | Colorectum | AD | 1.15e-28 | -9.29e-01 | -0.059 |
| 93986 | FOXP2 | HTA11_2992_2000001011 | Human | Colorectum | SER | 3.16e-03 | -7.15e-01 | -0.1706 |
| 93986 | FOXP2 | HTA11_5212_2000001011 | Human | Colorectum | AD | 1.91e-18 | -1.04e+00 | -0.2061 |
| 93986 | FOXP2 | HTA11_5216_2000001011 | Human | Colorectum | SER | 1.54e-10 | -9.21e-01 | -0.1462 |
| 93986 | FOXP2 | HTA11_9341_2000001011 | Human | Colorectum | SER | 7.00e-12 | -9.35e-01 | -0.00410000000000005 |
| 93986 | FOXP2 | HTA11_866_3004761011 | Human | Colorectum | AD | 1.03e-58 | -1.26e+00 | 0.096 |
| 93986 | FOXP2 | HTA11_4255_2000001011 | Human | Colorectum | SER | 1.50e-12 | -9.65e-01 | 0.0446 |
| 93986 | FOXP2 | HTA11_9408_2000001011 | Human | Colorectum | AD | 2.22e-14 | -1.10e+00 | 0.0451 |
| 93986 | FOXP2 | HTA11_8622_2000001021 | Human | Colorectum | SER | 1.21e-16 | -1.31e+00 | 0.0528 |
| 93986 | FOXP2 | HTA11_7663_2000001011 | Human | Colorectum | SER | 3.40e-05 | -4.46e-01 | 0.0131 |
| Page: 1 2 3 4 5 6 7 |
| Tissue | Expression Dynamics | Abbreviation |
| Colorectum (GSE201348) |  | FAP: Familial adenomatous polyposis |
| CRC: Colorectal cancer | ||
| Colorectum (HTA11) |  | AD: Adenomas |
| SER: Sessile serrated lesions | ||
| MSI-H: Microsatellite-high colorectal cancer | ||
| MSS: Microsatellite stable colorectal cancer | ||
| Esophagus | 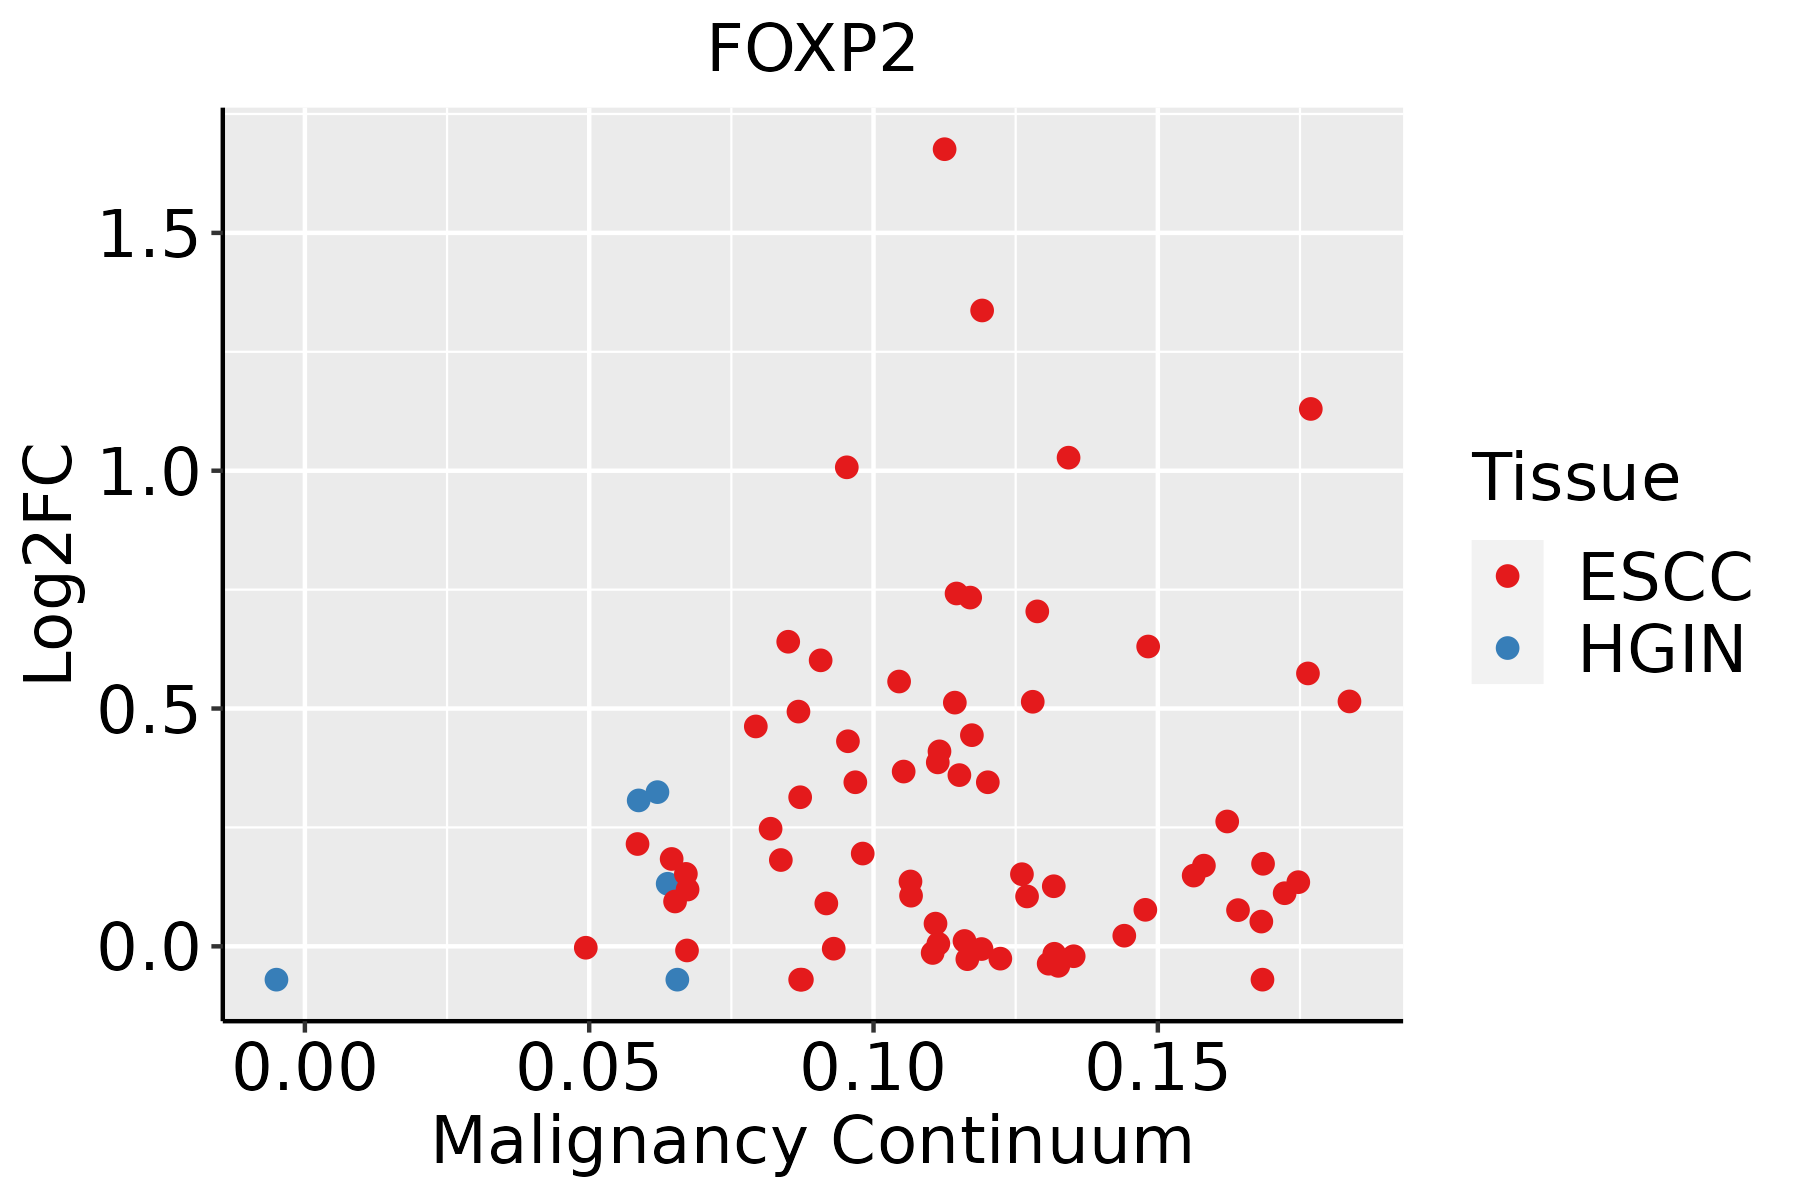 | ESCC: Esophageal squamous cell carcinoma |
| HGIN: High-grade intraepithelial neoplasias | ||
| LGIN: Low-grade intraepithelial neoplasias | ||
| Liver |  | HCC: Hepatocellular carcinoma |
| NAFLD: Non-alcoholic fatty liver disease | ||
| Lung | 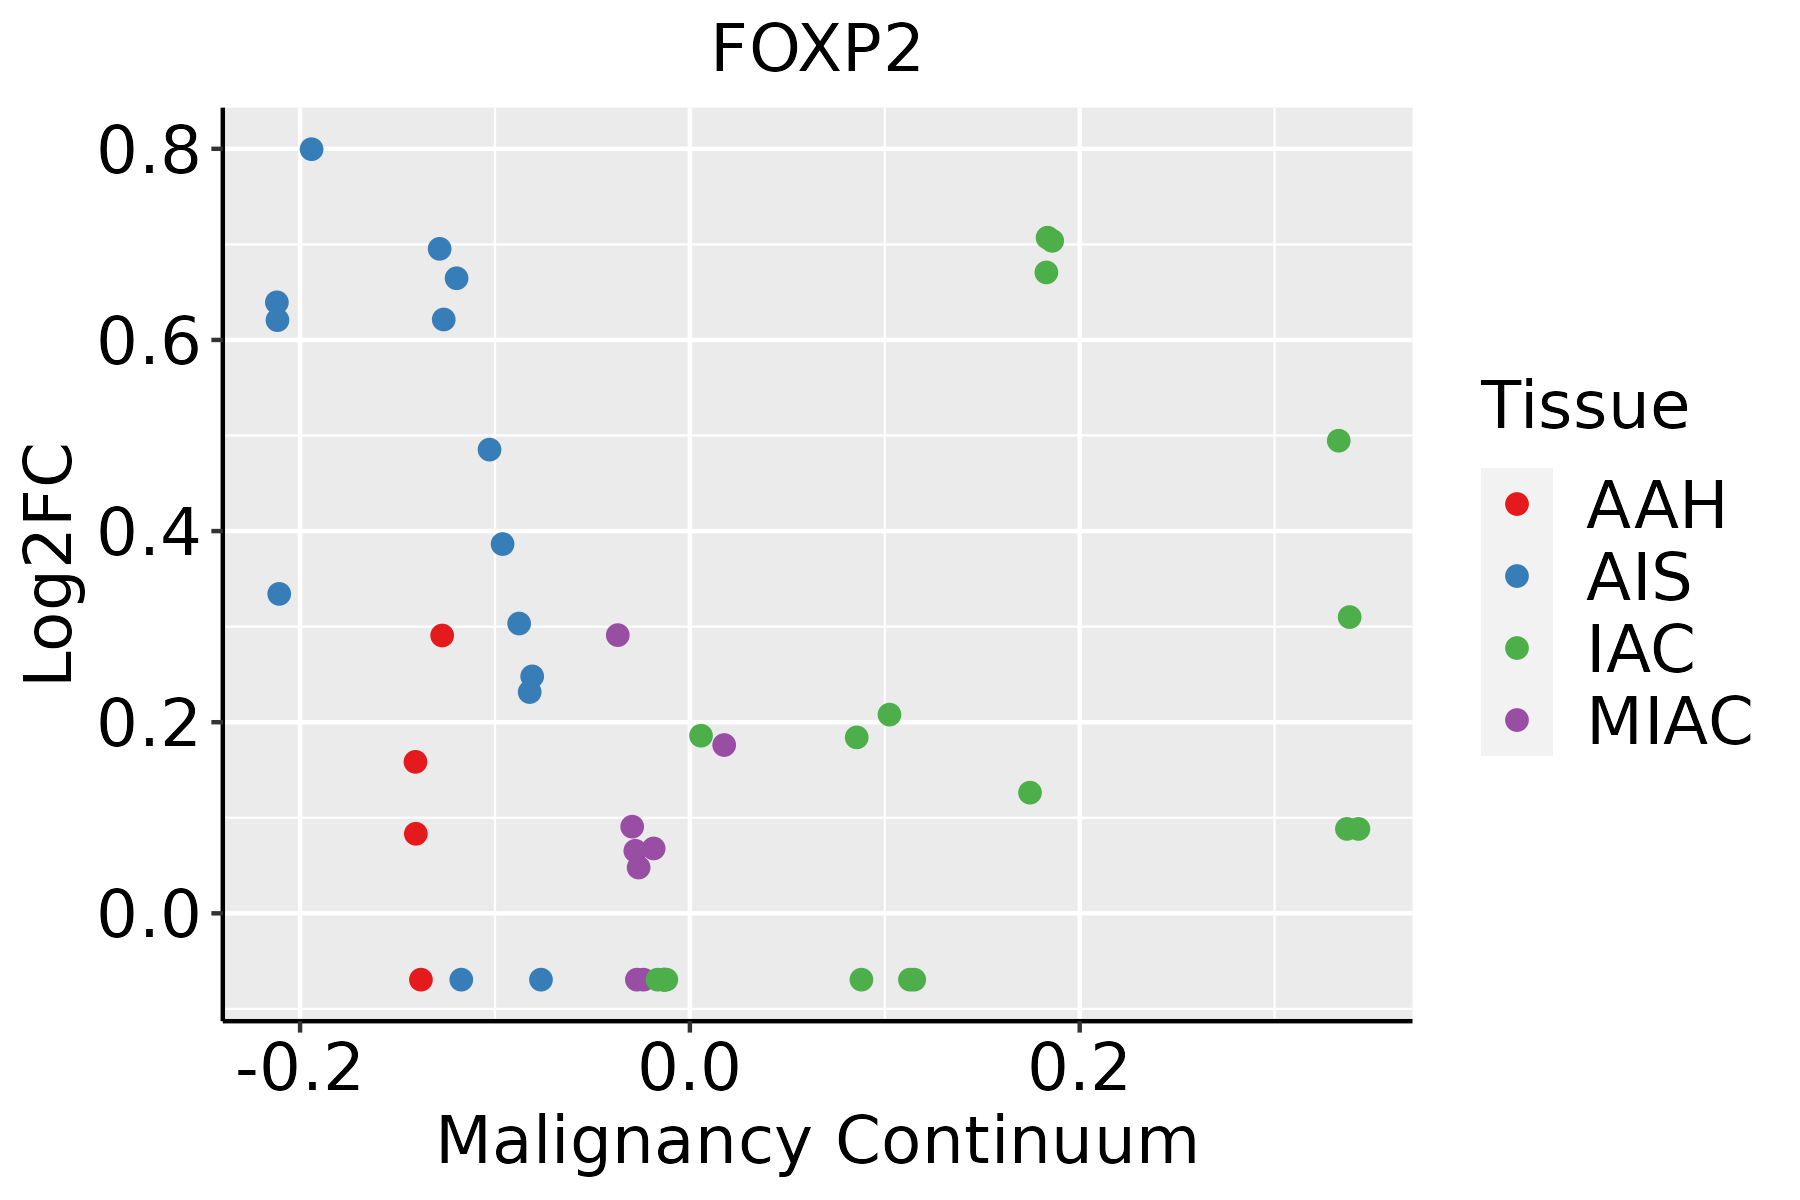 | AAH: Atypical adenomatous hyperplasia |
| AIS: Adenocarcinoma in situ | ||
| IAC: Invasive lung adenocarcinoma | ||
| MIA: Minimally invasive adenocarcinoma |
| ∗log2FC in expression of this searched gene in stem-like cells from each diseased tissue sample relative to stem-like cells in normal samples in each tissue plotted against the malignancy continuum. Samples are colored based on if they are from different disease stage. |
Top |
Malignant transformation related pathway analysis |
| Find out the enriched GO biological processes and KEGG pathways involved in transition from healthy to precancer to cancer |
| Tissue | Disease Stage | Enriched GO biological Processes |
| Colorectum | AD |  |
| Colorectum | SER |  |
| Colorectum | MSS |  |
| Colorectum | MSI-H |  |
| Colorectum | FAP |  |
| ∗Top 15 enriched GO BP terms are showed in the bar plot of each disease state in each tissue. Each row represents a significant GO biological process which is colored according to the -log10(p.adjust). |
| Page: 1 2 3 4 5 6 7 8 9 |
| GO ID | Tissue | Disease Stage | Description | Gene Ratio | Bg Ratio | pvalue | p.adjust | Count |
| GO:0048857 | Colorectum | AD | neural nucleus development | 27/3918 | 64/18723 | 9.57e-05 | 1.45e-03 | 27 |
| GO:1901654 | Colorectum | AD | response to ketone | 59/3918 | 194/18723 | 1.14e-03 | 1.04e-02 | 59 |
| GO:00488571 | Colorectum | SER | neural nucleus development | 26/2897 | 64/18723 | 1.09e-06 | 5.11e-05 | 26 |
| GO:19016541 | Colorectum | SER | response to ketone | 44/2897 | 194/18723 | 5.01e-03 | 3.88e-02 | 44 |
| GO:00488572 | Colorectum | MSS | neural nucleus development | 26/3467 | 64/18723 | 3.19e-05 | 6.30e-04 | 26 |
| GO:19016542 | Colorectum | MSS | response to ketone | 58/3467 | 194/18723 | 7.70e-05 | 1.28e-03 | 58 |
| GO:00488573 | Colorectum | MSI-H | neural nucleus development | 13/1319 | 64/18723 | 4.43e-04 | 9.50e-03 | 13 |
| GO:19016543 | Colorectum | MSI-H | response to ketone | 26/1319 | 194/18723 | 1.17e-03 | 1.92e-02 | 26 |
| GO:19016544 | Colorectum | FAP | response to ketone | 45/2622 | 194/18723 | 3.67e-04 | 4.63e-03 | 45 |
| GO:00488574 | Colorectum | FAP | neural nucleus development | 19/2622 | 64/18723 | 8.94e-04 | 9.08e-03 | 19 |
| GO:0021987 | Colorectum | FAP | cerebral cortex development | 28/2622 | 114/18723 | 1.80e-03 | 1.55e-02 | 28 |
| GO:0021543 | Colorectum | FAP | pallium development | 36/2622 | 169/18723 | 6.06e-03 | 3.81e-02 | 36 |
| GO:0030900 | Colorectum | FAP | forebrain development | 70/2622 | 379/18723 | 8.64e-03 | 4.98e-02 | 70 |
| GO:00309001 | Colorectum | CRC | forebrain development | 66/2078 | 379/18723 | 1.36e-04 | 2.57e-03 | 66 |
| GO:00488575 | Colorectum | CRC | neural nucleus development | 17/2078 | 64/18723 | 4.59e-04 | 6.70e-03 | 17 |
| GO:00219871 | Colorectum | CRC | cerebral cortex development | 24/2078 | 114/18723 | 1.45e-03 | 1.57e-02 | 24 |
| GO:00215431 | Colorectum | CRC | pallium development | 32/2078 | 169/18723 | 1.74e-03 | 1.79e-02 | 32 |
| GO:0021537 | Colorectum | CRC | telencephalon development | 43/2078 | 248/18723 | 2.01e-03 | 2.01e-02 | 43 |
| GO:190165420 | Esophagus | HGIN | response to ketone | 48/2587 | 194/18723 | 3.17e-05 | 8.12e-04 | 48 |
| GO:00335748 | Esophagus | HGIN | response to testosterone | 15/2587 | 42/18723 | 3.03e-04 | 5.13e-03 | 15 |
| Page: 1 2 |
| Pathway ID | Tissue | Disease Stage | Description | Gene Ratio | Bg Ratio | pvalue | p.adjust | qvalue | Count |
| Page: 1 |
Top |
Cell-cell communication analysis |
| Identification of potential cell-cell interactions between two cell types and their ligand-receptor pairs for different disease states |
| Ligand | Receptor | LRpair | Pathway | Tissue | Disease Stage |
| Page: 1 |
Top |
Single-cell gene regulatory network inference analysis |
| Find out the significant the regulons (TFs) and the target genes of each regulon across cell types for different disease states |
| TF | Cell Type | Tissue | Disease Stage | Target Gene | RSS | Regulon Activity |
| FOXP2 | INCAF | Breast | Healthy | LTBP2,ALDH1A1,NFIB, etc. | 1.38e-01 |  |
| FOXP2 | INCAF | Endometrium | EEC | BNC2,OGN,COL21A1, etc. | 4.48e-01 |  |
| FOXP2 | MYOFIB | Endometrium | Healthy | BNC2,OGN,COL21A1, etc. | 1.63e-01 |  |
| FOXP2 | ECM | Esophagus | ADJ | LAMA2,LRP1,DST, etc. | 7.73e-01 |  |
| FOXP2 | ECM | Esophagus | Healthy | LAMA2,LRP1,DST, etc. | 6.63e-01 |  |
| FOXP2 | STM | Oral cavity | OSCC | THSD4,AHCYL2,GRIP1, etc. | 4.00e-01 |  |
| FOXP2 | CAF | Pancreas | PDAC | ABCA10,ABCA6,ABCA9, etc. | 6.68e-02 |  |
| FOXP2 | LUM | Prostate | BPH | LINC01297,ZBTB20,BMPR1B, etc. | 4.91e-01 |  |
| FOXP2 | INCAF | Stomach | ADJ | FBLN1,MIR99AHG,BNC2, etc. | 5.47e-01 |  |
| FOXP2 | INCAF | Stomach | CAG | FBLN1,MIR99AHG,BNC2, etc. | 4.93e-01 |  |
| ∗The dot plots of a searched regulon are shown for all cell subpopulations in each disease state of each tissue based on the regulon specific score inferred using pySCENIC and by calculating the average expression. |
| Page: 1 2 |
Top |
Somatic mutation of malignant transformation related genes |
| Annotation of somatic variants for genes involved in malignant transformation |
| Hugo Symbol | Variant Class | Variant Classification | dbSNP RS | HGVSc | HGVSp | HGVSp Short | SWISSPROT | BIOTYPE | SIFT | PolyPhen | Tumor Sample Barcode | Tissue | Histology | Sex | Age | Stage | Therapy Types | Drugs | Outcome |
| FOXP2 | SNV | Missense_Mutation | novel | c.2042G>T | p.Gly681Val | p.G681V | O15409 | protein_coding | deleterious(0) | probably_damaging(0.998) | TCGA-AN-A046-01 | Breast | breast invasive carcinoma | Female | >=65 | I/II | Unknown | Unknown | SD |
| FOXP2 | SNV | Missense_Mutation | rs760842249 | c.113N>A | p.Gly38Asp | p.G38D | O15409 | protein_coding | deleterious_low_confidence(0.01) | probably_damaging(0.997) | TCGA-AO-A03V-01 | Breast | breast invasive carcinoma | Female | <65 | I/II | Chemotherapy | fluorouracil | SD |
| FOXP2 | SNV | Missense_Mutation | c.2122G>A | p.Glu708Lys | p.E708K | O15409 | protein_coding | deleterious(0.02) | benign(0.217) | TCGA-AO-A0J9-01 | Breast | breast invasive carcinoma | Female | <65 | III/IV | Chemotherapy | cyclophosphamide | PD | |
| FOXP2 | SNV | Missense_Mutation | c.86N>A | p.Ala29Asp | p.A29D | O15409 | protein_coding | deleterious_low_confidence(0.02) | probably_damaging(0.997) | TCGA-E2-A1IN-01 | Breast | breast invasive carcinoma | Female | <65 | I/II | Hormone Therapy | arimidex | SD | |
| FOXP2 | SNV | Missense_Mutation | novel | c.1280T>C | p.Leu427Pro | p.L427P | O15409 | protein_coding | deleterious(0.01) | probably_damaging(0.994) | TCGA-GI-A2C9-01 | Breast | breast invasive carcinoma | Female | <65 | I/II | Unspecific | SD | |
| FOXP2 | insertion | Nonsense_Mutation | novel | c.1839_1840insCCCTTTAGTTAATAATAAATTCTATTTT | p.Thr614ProfsTer4 | p.T614Pfs*4 | O15409 | protein_coding | TCGA-A2-A0EQ-01 | Breast | breast invasive carcinoma | Female | <65 | I/II | Chemotherapy | adriamycin | SD | ||
| FOXP2 | insertion | Frame_Shift_Ins | novel | c.2005_2006insGAAGAAGCAAGAAGGACACCCTGTGGCAAAATCTGGA | p.Asp669GlyfsTer22 | p.D669Gfs*22 | O15409 | protein_coding | TCGA-A7-A0CE-01 | Breast | breast invasive carcinoma | Female | <65 | I/II | Chemotherapy | adriamycin | SD | ||
| FOXP2 | insertion | Nonsense_Mutation | novel | c.154_155insATTAGTGATATTCTTGATAGATTTTATTTCCAGCTTTCATATCT | p.Leu52HisfsTer2 | p.L52Hfs*2 | O15409 | protein_coding | TCGA-A8-A09B-01 | Breast | breast invasive carcinoma | Female | <65 | III/IV | Chemotherapy | 5-fluorouracil | SD | ||
| FOXP2 | insertion | Nonsense_Mutation | novel | c.1814_1815insGTTAATAATAAATT | p.Tyr605Ter | p.Y605* | O15409 | protein_coding | TCGA-A8-A0A1-01 | Breast | breast invasive carcinoma | Female | >=65 | I/II | Hormone Therapy | tamoxiphen | SD | ||
| FOXP2 | insertion | Nonsense_Mutation | novel | c.1815_1816insTATTTTATCAGTTTGTGATTG | p.Tyr605_Gln606insTyrPheIleSerLeuTerLeu | p.Y605_Q606insYFISL*L | O15409 | protein_coding | TCGA-A8-A0A1-01 | Breast | breast invasive carcinoma | Female | >=65 | I/II | Hormone Therapy | tamoxiphen | SD |
| Page: 1 2 3 4 5 6 7 8 9 10 11 12 |
Top |
Related drugs of malignant transformation related genes |
| Identification of chemicals and drugs interact with genes involved in malignant transfromation |
| (DGIdb 4.0) |
| Entrez ID | Symbol | Category | Interaction Types | Drug Claim Name | Drug Name | PMIDs |
| Page: 1 |

Copyright 2023-Present -The University of Texas Health Science Center at Houston |