Schematic overview of the cellular and molecular mechanisms involved in the cancer progression, including the proposed cellular and molecular mechanisms in cancer cells trajectory. AT1: alveolar type 1 cells; AT2: alveolar type 2 cells; AAH: atypical adenomatous hyperplasia; AIS: adenocarcinoma in situ; MIA: minimally invasive adenocarcinoma; IA: invasive adenocarcinoma; EMT: epithelial-mesenchymal transition

Home

Download

Statistics

Help

Contact

Center for Computational Systems Medicine
leaf

Gene summary

leaf

Malignant transformation analysis

leaf

Malignant transformation related pathway analysis

leaf

Cell-cell communication analysis

leaf

Single-cell gene regulatory network inference analysis

leaf

Somatic mutation of malignant transformation related genes

leaf

Related drugs of malignant transformation related genes

Gene: FOXP1

Gene summary for FOXP1

check button Gene summary.

Gene informationSpeciesHuman
Gene symbol

FOXP1

Gene ID

27086

Gene nameforkhead box P1
Gene Alias12CC4
Cytomap3p13
Gene Typeprotein-coding
GO ID

GO:0000122

UniProtAcc

Q9H334


Top

Malignant transformation analysis

check button Identification of the aberrant gene expression in precancerous and cancerous lesions by comparing the gene expression of stem-like cells in diseased tissues with normal stem cells
check button Malignant transformation involving gene list.
Entrez IDSymbolReplicatesSpeciesOrganTissueAdj P-valueLog2FCMalignancy
27086FOXP1GSM4909286HumanBreastIDC1.99e-048.58e-020.1081
27086FOXP1GSM4909290HumanBreastIDC6.29e-064.22e-010.2096
27086FOXP1GSM4909293HumanBreastIDC6.65e-144.31e-010.1581
27086FOXP1GSM4909297HumanBreastIDC1.95e-051.86e-010.1517
27086FOXP1GSM4909298HumanBreastIDC2.29e-336.16e-010.1551
27086FOXP1GSM4909299HumanBreastIDC1.93e-063.27e-010.035
27086FOXP1GSM4909301HumanBreastIDC3.51e-276.96e-010.1577
27086FOXP1GSM4909309HumanBreastIDC2.58e-022.50e-010.0483
27086FOXP1GSM4909311HumanBreastIDC6.34e-14-4.15e-020.1534
27086FOXP1GSM4909313HumanBreastIDC2.19e-073.62e-010.0391
27086FOXP1GSM4909317HumanBreastIDC3.46e-022.98e-010.1355
27086FOXP1GSM4909319HumanBreastIDC2.30e-17-2.30e-010.1563
27086FOXP1GSM4909320HumanBreastIDC4.15e-051.06e-010.1575
27086FOXP1GSM4909321HumanBreastIDC1.35e-068.99e-020.1559
27086FOXP1brca1HumanBreastPrecancer1.18e-02-2.95e-01-0.0338
27086FOXP1M1HumanBreastIDC2.17e-064.47e-010.1577
27086FOXP1NCCBC14HumanBreastDCIS7.98e-08-6.33e-020.2021
27086FOXP1NCCBC5HumanBreastDCIS1.88e-09-2.61e-010.2046
27086FOXP1P1HumanBreastIDC1.26e-122.50e-020.1527
27086FOXP1P2HumanBreastIDC4.38e-062.64e-010.21
Page: 1 2 3 4 5 6 7 8 9 10 11 12 13 14 15 

check button Transcriptomic changes along malignancy continuum.
TissueExpression DynamicsAbbreviation
BreastThe image shows the transcriptomic changes along malignancy continuum.log2FC in expression of this searched gene in stem-like cells from each diseased tissue sample relative to stem-like cells in normal samples in each tissue plotted against the malignancy continuum. Samples are colored based on if they are from different disease stage.IDC: Invasive ductal carcinoma
DCIS: Ductal carcinoma in situ
Precancer(BRCA1-mut): Precancerous lesion from BRCA1 mutation carriers
CervixThe image shows the transcriptomic changes along malignancy continuum.log2FC in expression of this searched gene in stem-like cells from each diseased tissue sample relative to stem-like cells in normal samples in each tissue plotted against the malignancy continuum. Samples are colored based on if they are from different disease stage.CC: Cervix cancer
HSIL_HPV: HPV-infected high-grade squamous intraepithelial lesions
N_HPV: HPV-infected normal cervix
Colorectum (GSE201348)The image shows the transcriptomic changes along malignancy continuum.log2FC in expression of this searched gene in stem-like cells from each diseased tissue sample relative to stem-like cells in normal samples in each tissue plotted against the malignancy continuum. Samples are colored based on if they are from different disease stage.
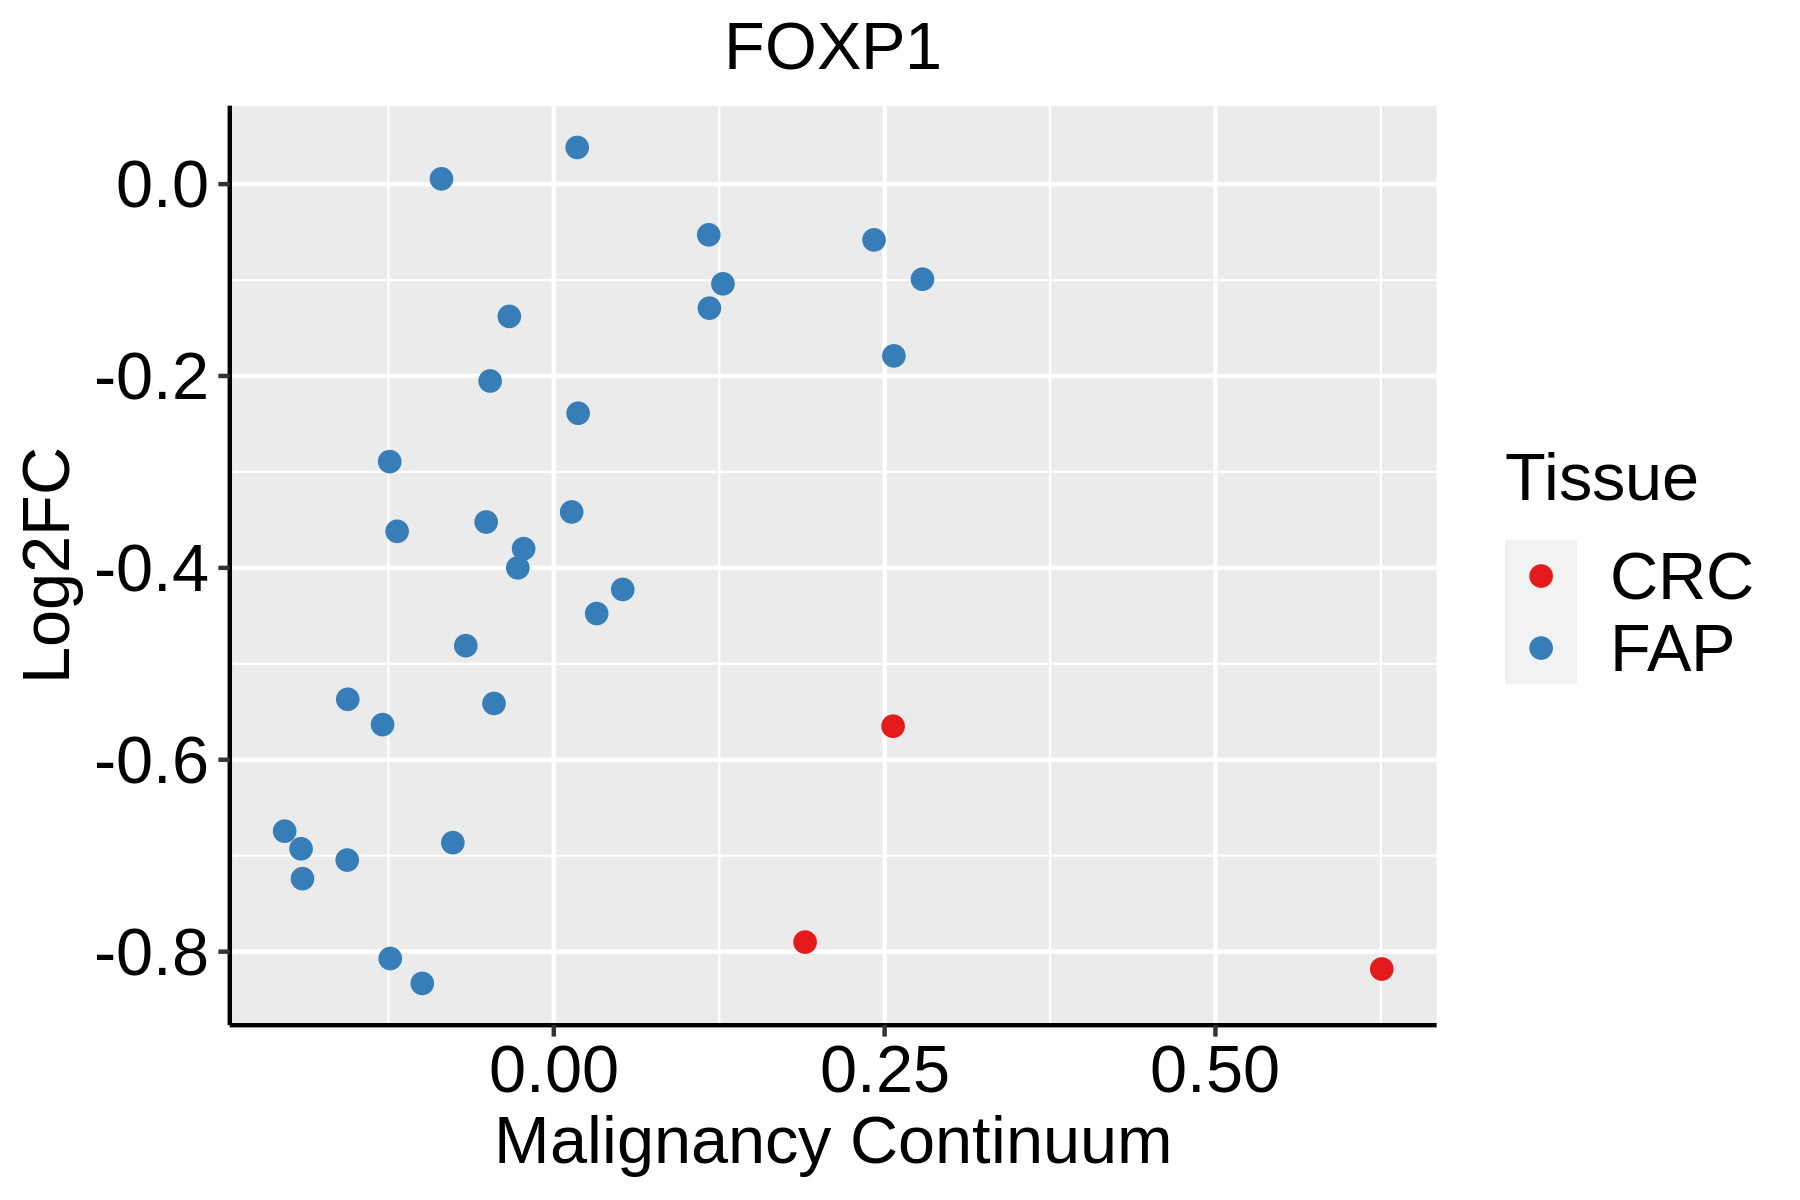
FAP: Familial adenomatous polyposis
CRC: Colorectal cancer
Colorectum (HTA11)The image shows the transcriptomic changes along malignancy continuum.log2FC in expression of this searched gene in stem-like cells from each diseased tissue sample relative to stem-like cells in normal samples in each tissue plotted against the malignancy continuum. Samples are colored based on if they are from different disease stage.AD: Adenomas
SER: Sessile serrated lesions
MSI-H: Microsatellite-high colorectal cancer
MSS: Microsatellite stable colorectal cancer
EndometriumThe image shows the transcriptomic changes along malignancy continuum.log2FC in expression of this searched gene in stem-like cells from each diseased tissue sample relative to stem-like cells in normal samples in each tissue plotted against the malignancy continuum. Samples are colored based on if they are from different disease stage.AEH: Atypical endometrial hyperplasia
EEC: Endometrioid Cancer
EsophagusThe image shows the transcriptomic changes along malignancy continuum.log2FC in expression of this searched gene in stem-like cells from each diseased tissue sample relative to stem-like cells in normal samples in each tissue plotted against the malignancy continuum. Samples are colored based on if they are from different disease stage.
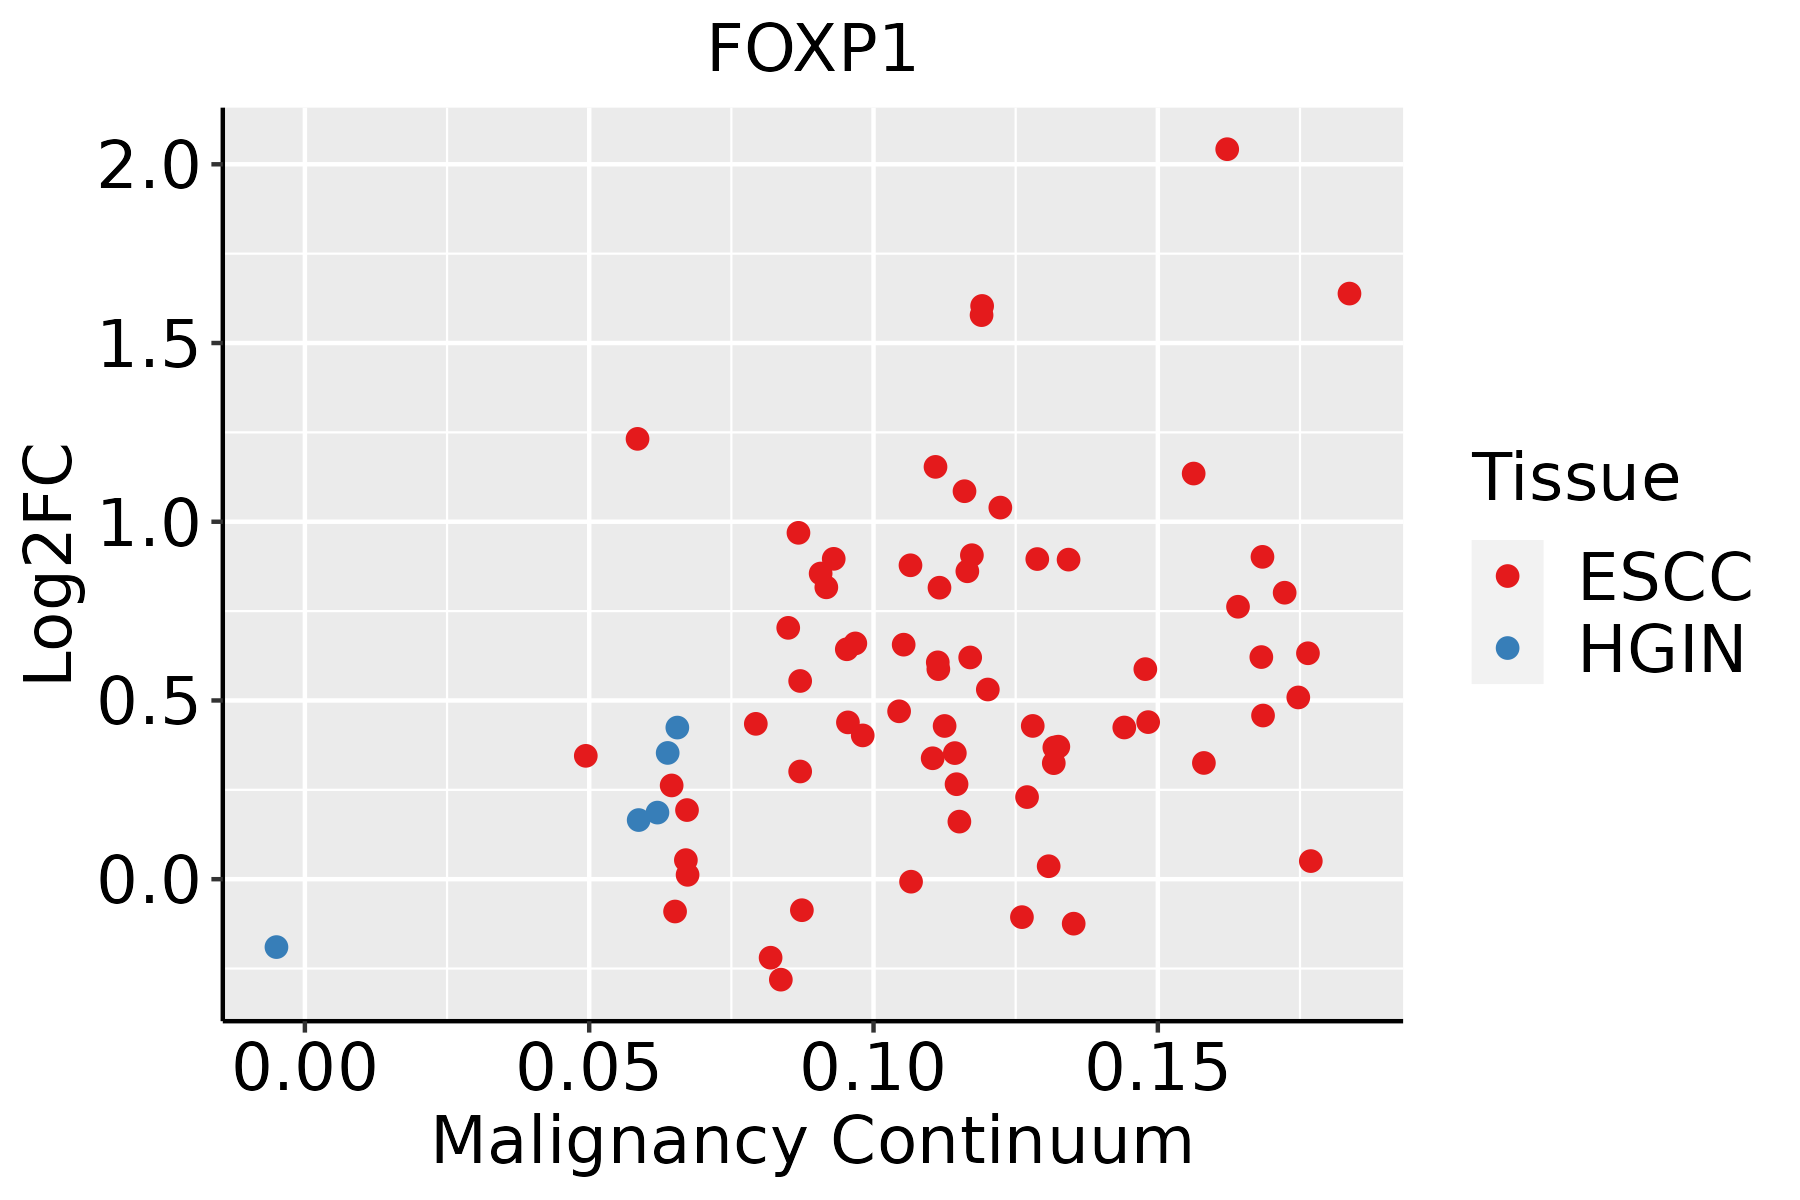
ESCC: Esophageal squamous cell carcinoma
HGIN: High-grade intraepithelial neoplasias
LGIN: Low-grade intraepithelial neoplasias
GCThe image shows the transcriptomic changes along malignancy continuum.log2FC in expression of this searched gene in stem-like cells from each diseased tissue sample relative to stem-like cells in normal samples in each tissue plotted against the malignancy continuum. Samples are colored based on if they are from different disease stage.
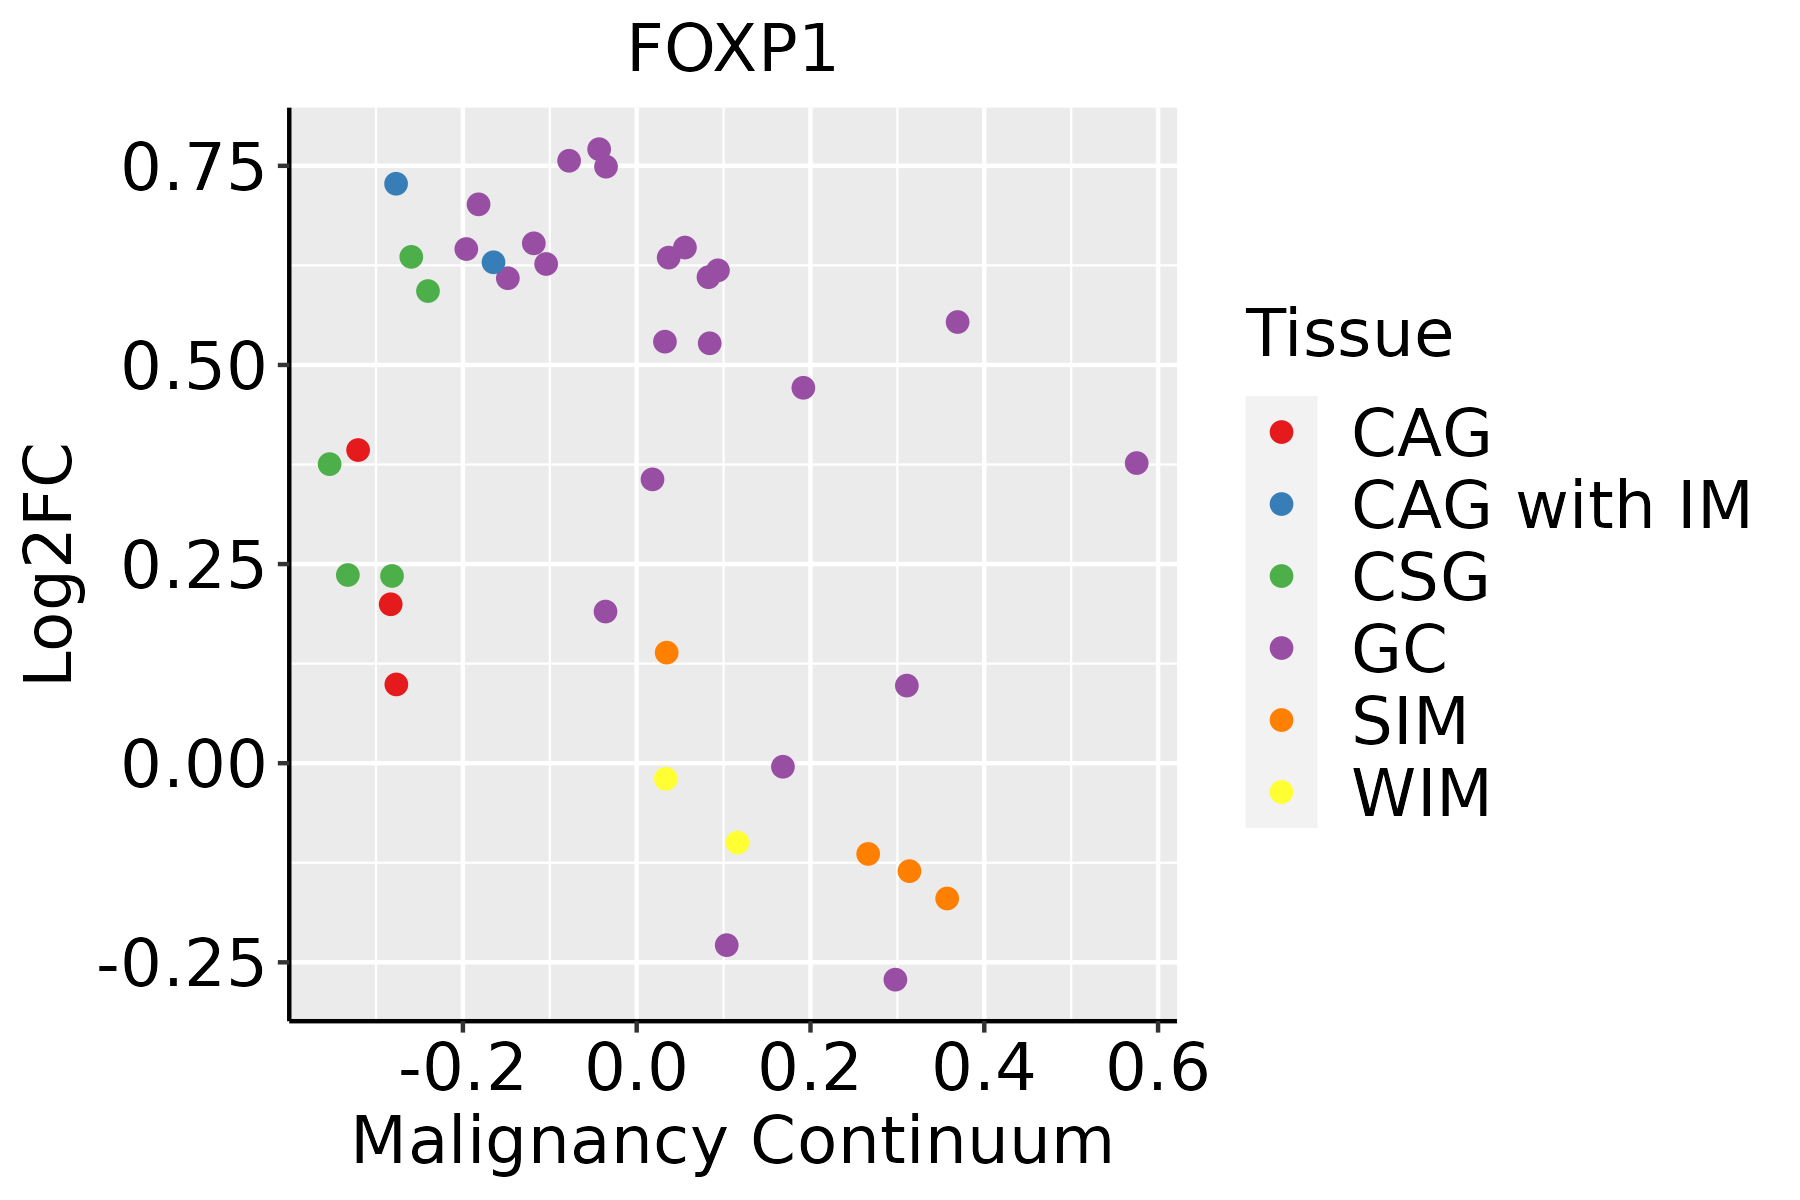
CAG: Chronic atrophic gastritis
CAG with IM: Chronic atrophic gastritis with intestinal metaplasia
CSG: Chronic superficial gastritis
GC: Gastric cancer
SIM: Severe intestinal metaplasia
WIM: Wild intestinal metaplasia
LiverThe image shows the transcriptomic changes along malignancy continuum.log2FC in expression of this searched gene in stem-like cells from each diseased tissue sample relative to stem-like cells in normal samples in each tissue plotted against the malignancy continuum. Samples are colored based on if they are from different disease stage.
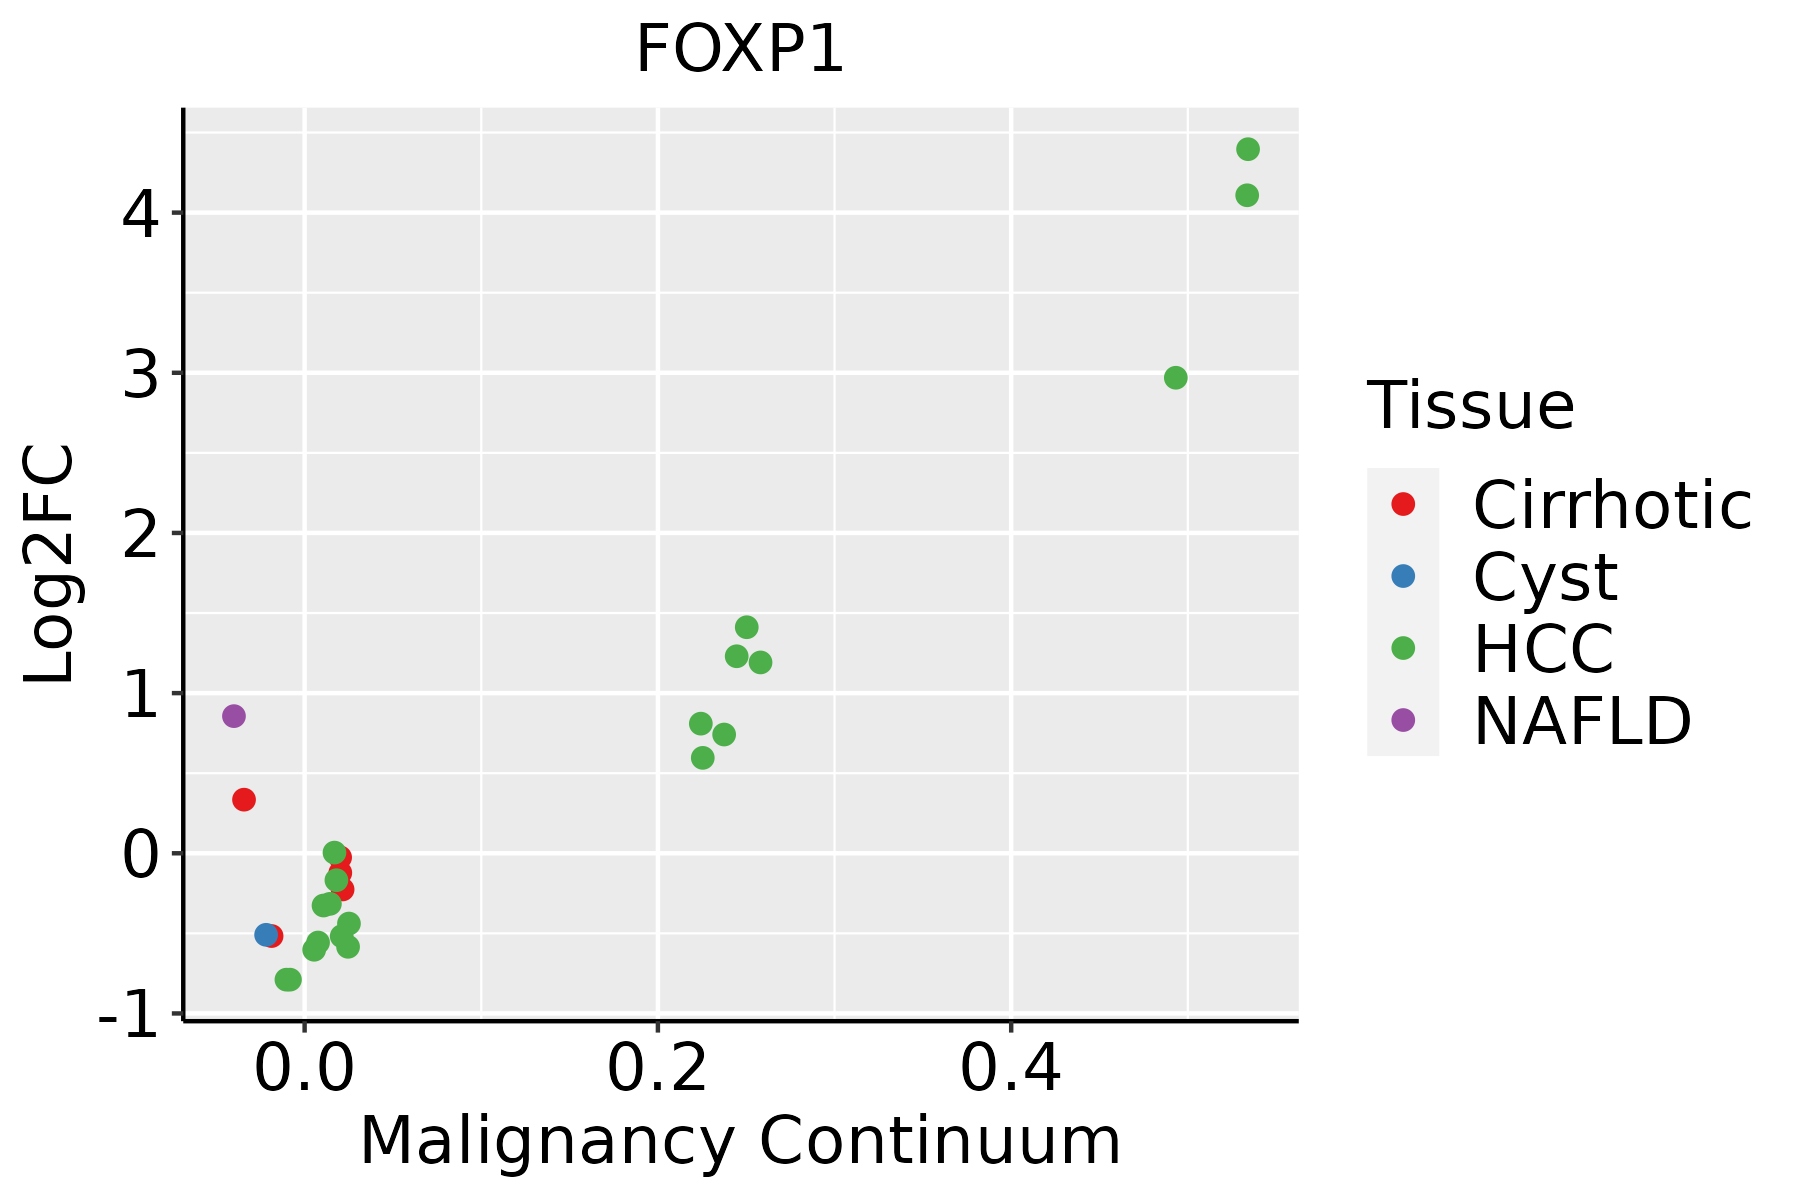
HCC: Hepatocellular carcinoma
NAFLD: Non-alcoholic fatty liver disease
LungThe image shows the transcriptomic changes along malignancy continuum.log2FC in expression of this searched gene in stem-like cells from each diseased tissue sample relative to stem-like cells in normal samples in each tissue plotted against the malignancy continuum. Samples are colored based on if they are from different disease stage.
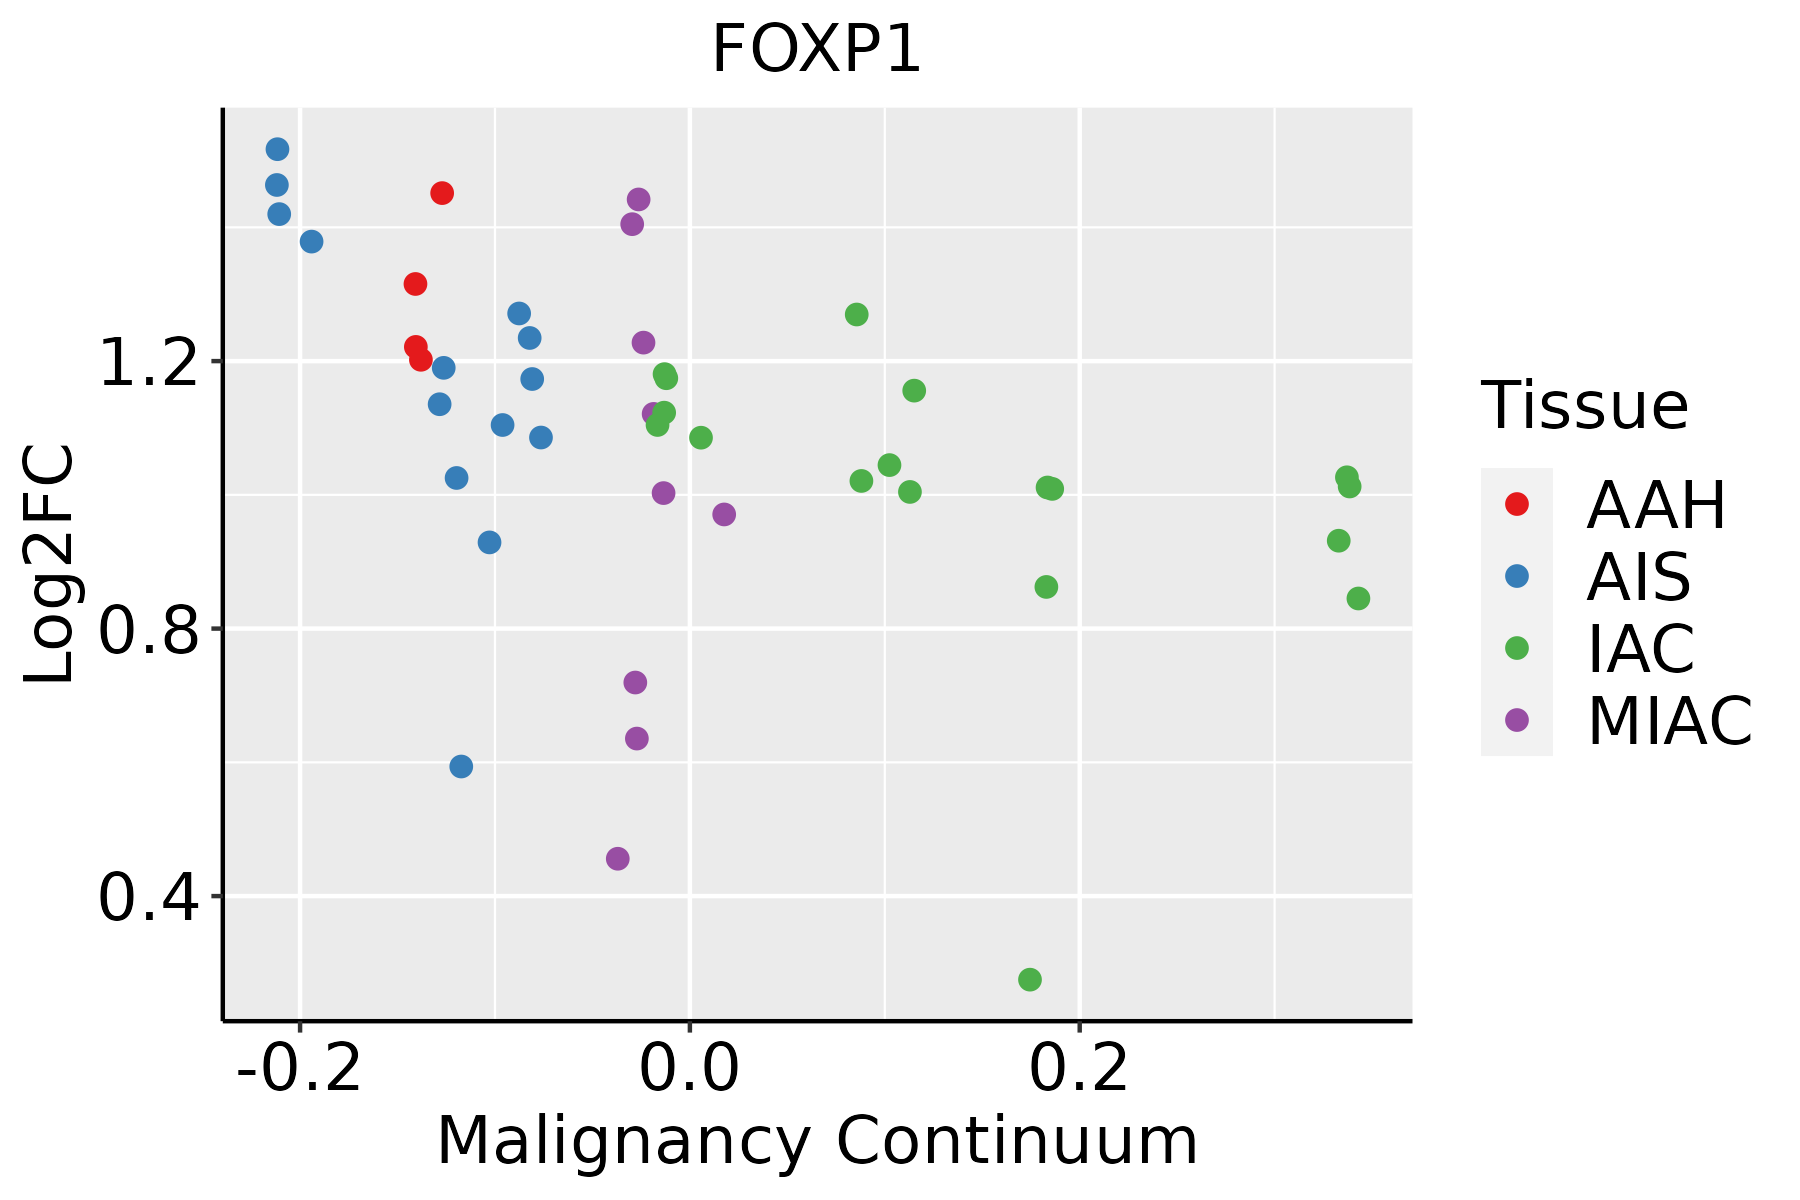
AAH: Atypical adenomatous hyperplasia
AIS: Adenocarcinoma in situ
IAC: Invasive lung adenocarcinoma
MIA: Minimally invasive adenocarcinoma
Oral CavityThe image shows the transcriptomic changes along malignancy continuum.log2FC in expression of this searched gene in stem-like cells from each diseased tissue sample relative to stem-like cells in normal samples in each tissue plotted against the malignancy continuum. Samples are colored based on if they are from different disease stage.
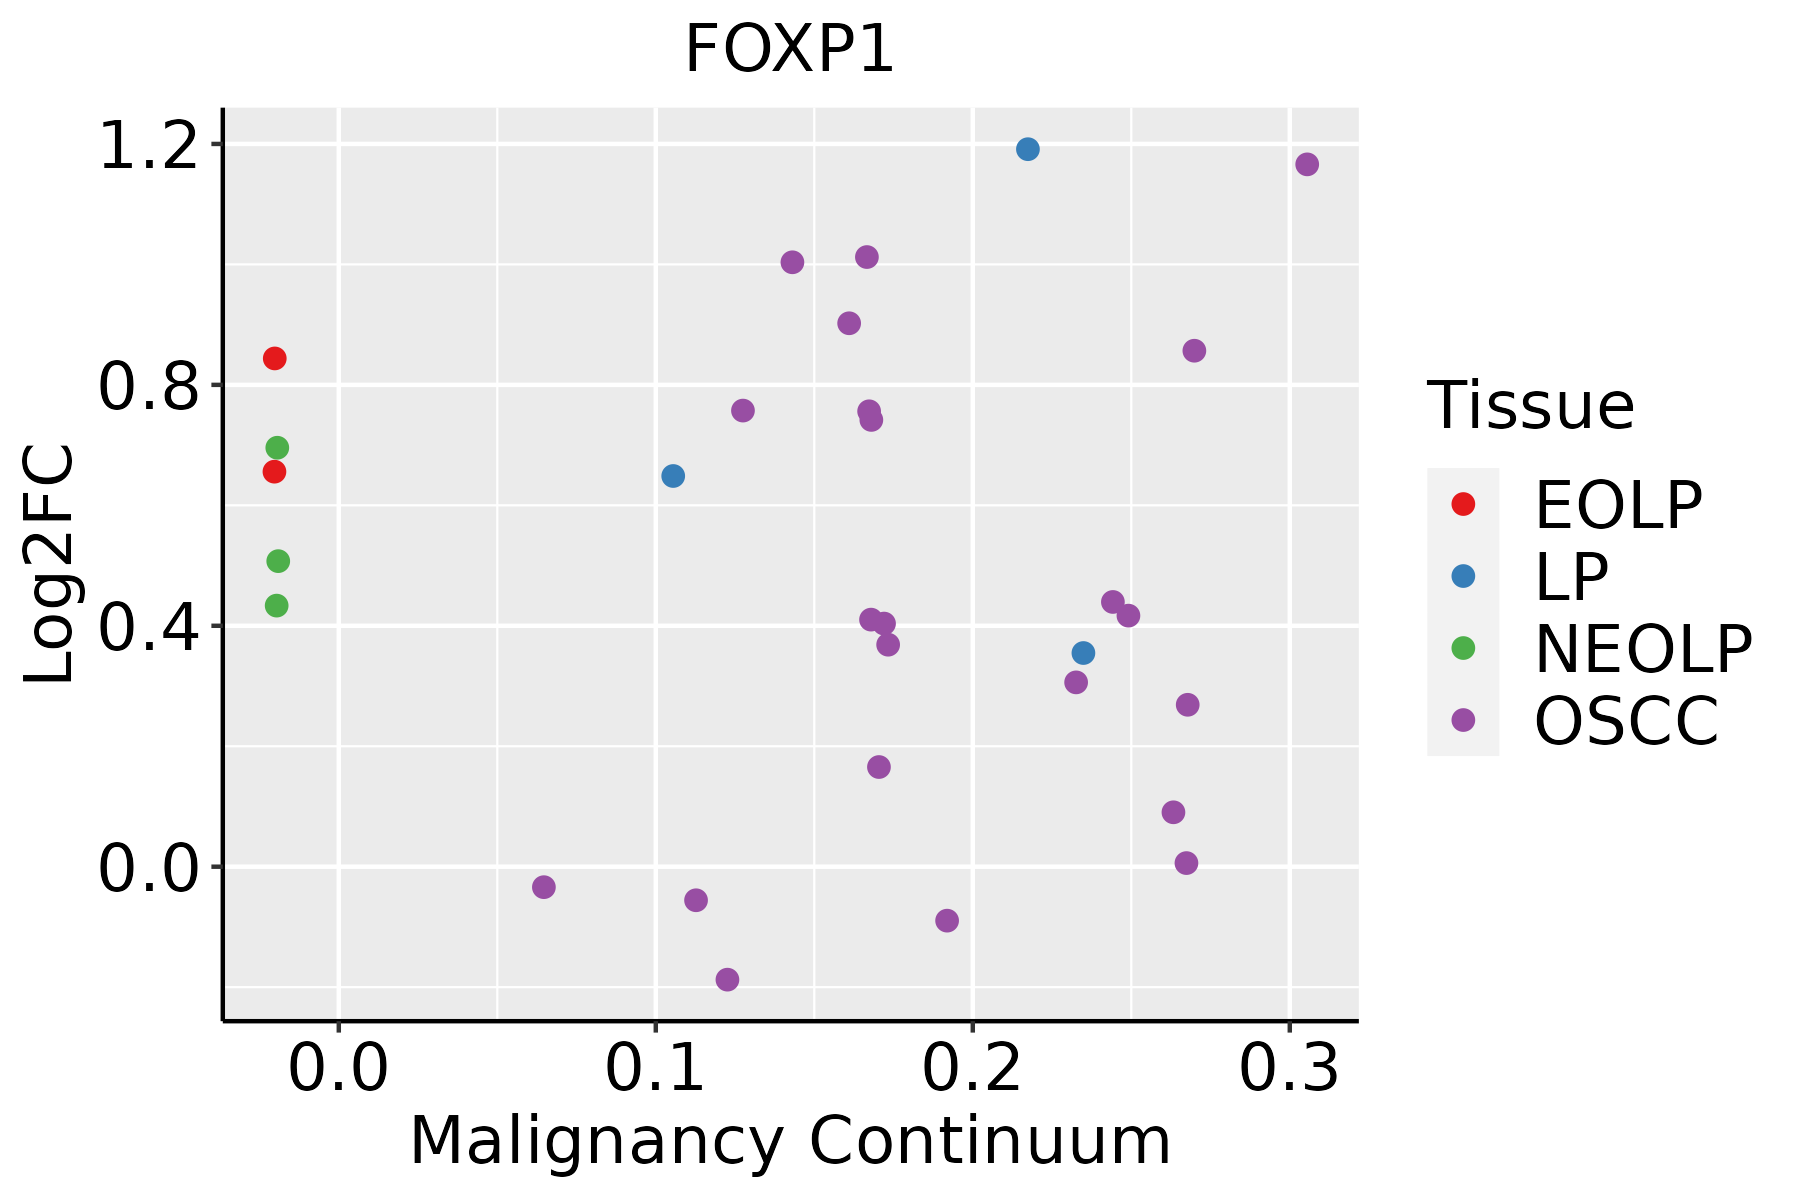
EOLP: Erosive Oral lichen planus
LP: leukoplakia
NEOLP: Non-erosive oral lichen planus
OSCC: Oral squamous cell carcinoma
ProstateThe image shows the transcriptomic changes along malignancy continuum.log2FC in expression of this searched gene in stem-like cells from each diseased tissue sample relative to stem-like cells in normal samples in each tissue plotted against the malignancy continuum. Samples are colored based on if they are from different disease stage.BPH: Benign Prostatic Hyperplasia
SkinThe image shows the transcriptomic changes along malignancy continuum.log2FC in expression of this searched gene in stem-like cells from each diseased tissue sample relative to stem-like cells in normal samples in each tissue plotted against the malignancy continuum. Samples are colored based on if they are from different disease stage.
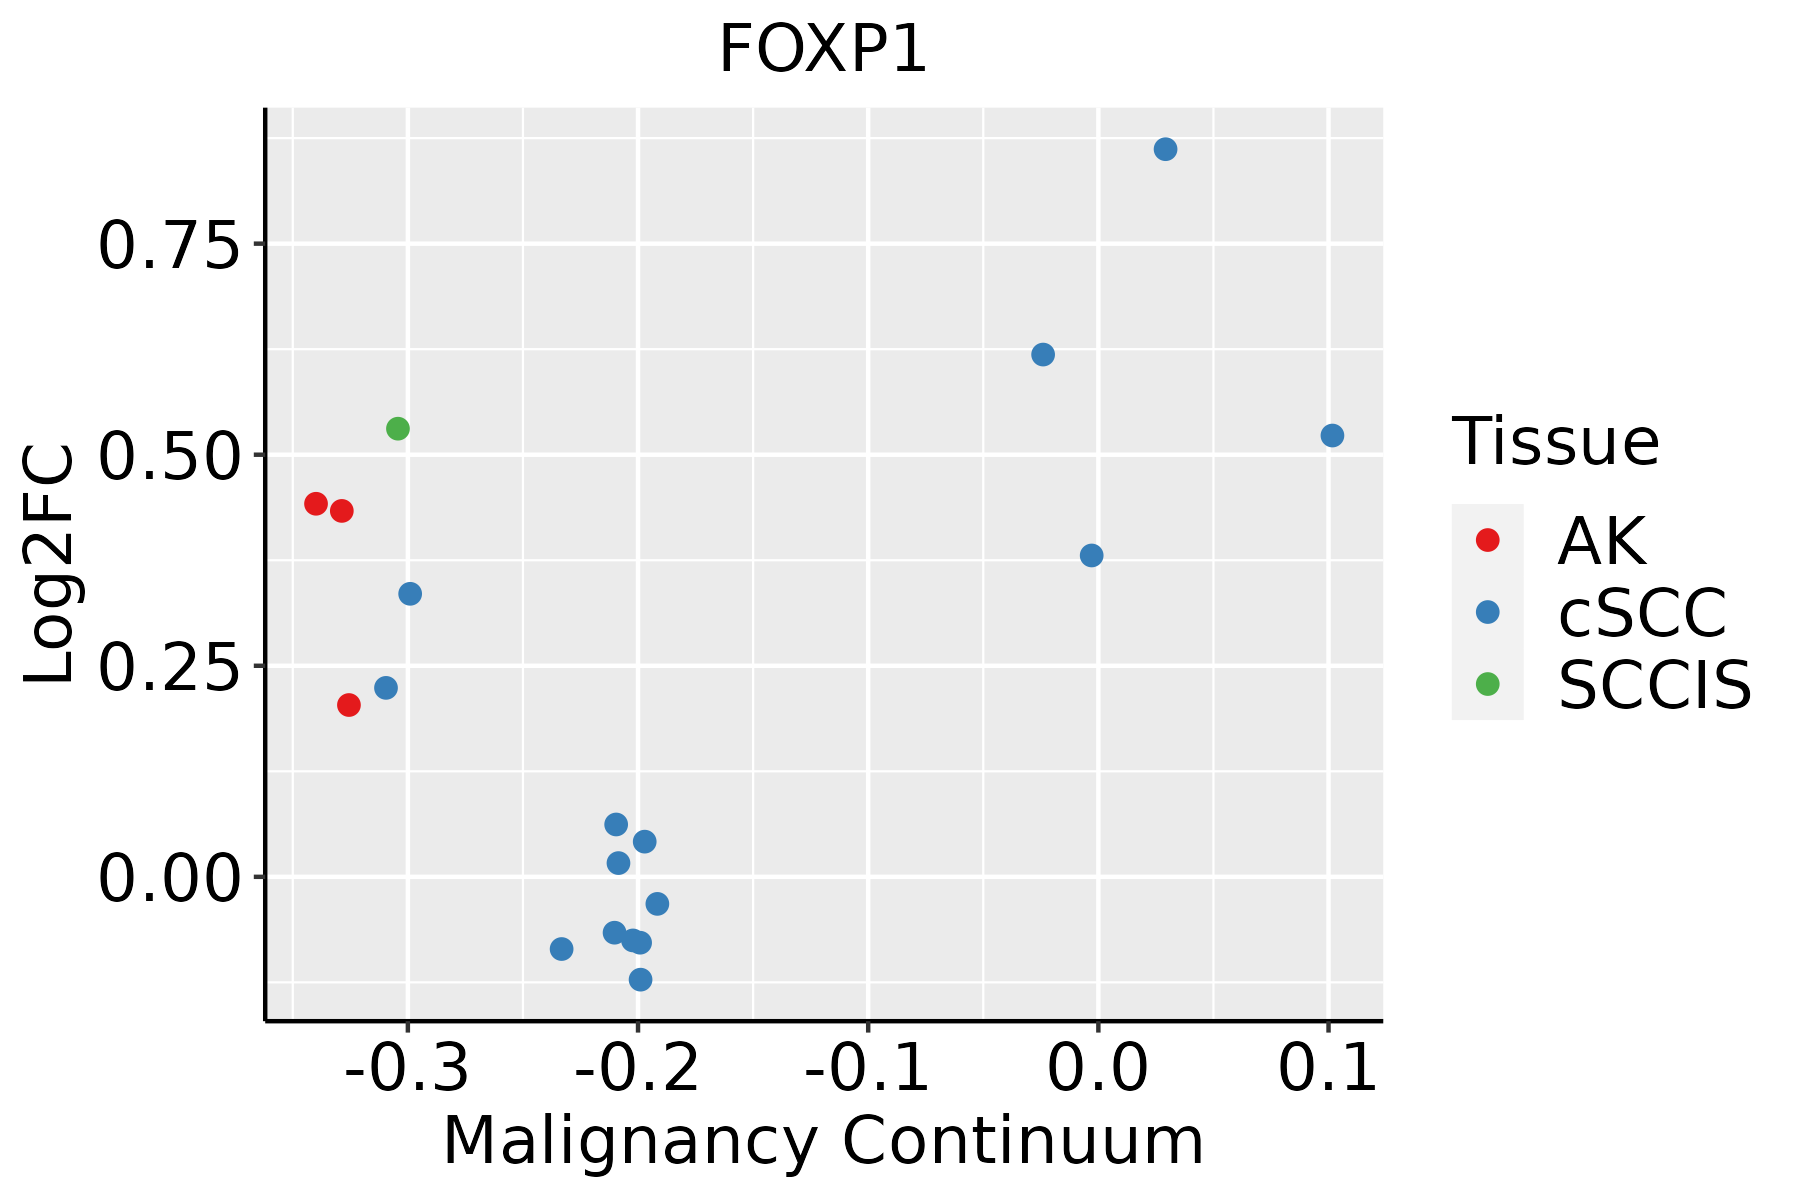
AK: Actinic keratosis
cSCC: Cutaneous squamous cell carcinoma
SCCIS:squamous cell carcinoma in situ
ThyroidThe image shows the transcriptomic changes along malignancy continuum.log2FC in expression of this searched gene in stem-like cells from each diseased tissue sample relative to stem-like cells in normal samples in each tissue plotted against the malignancy continuum. Samples are colored based on if they are from different disease stage.
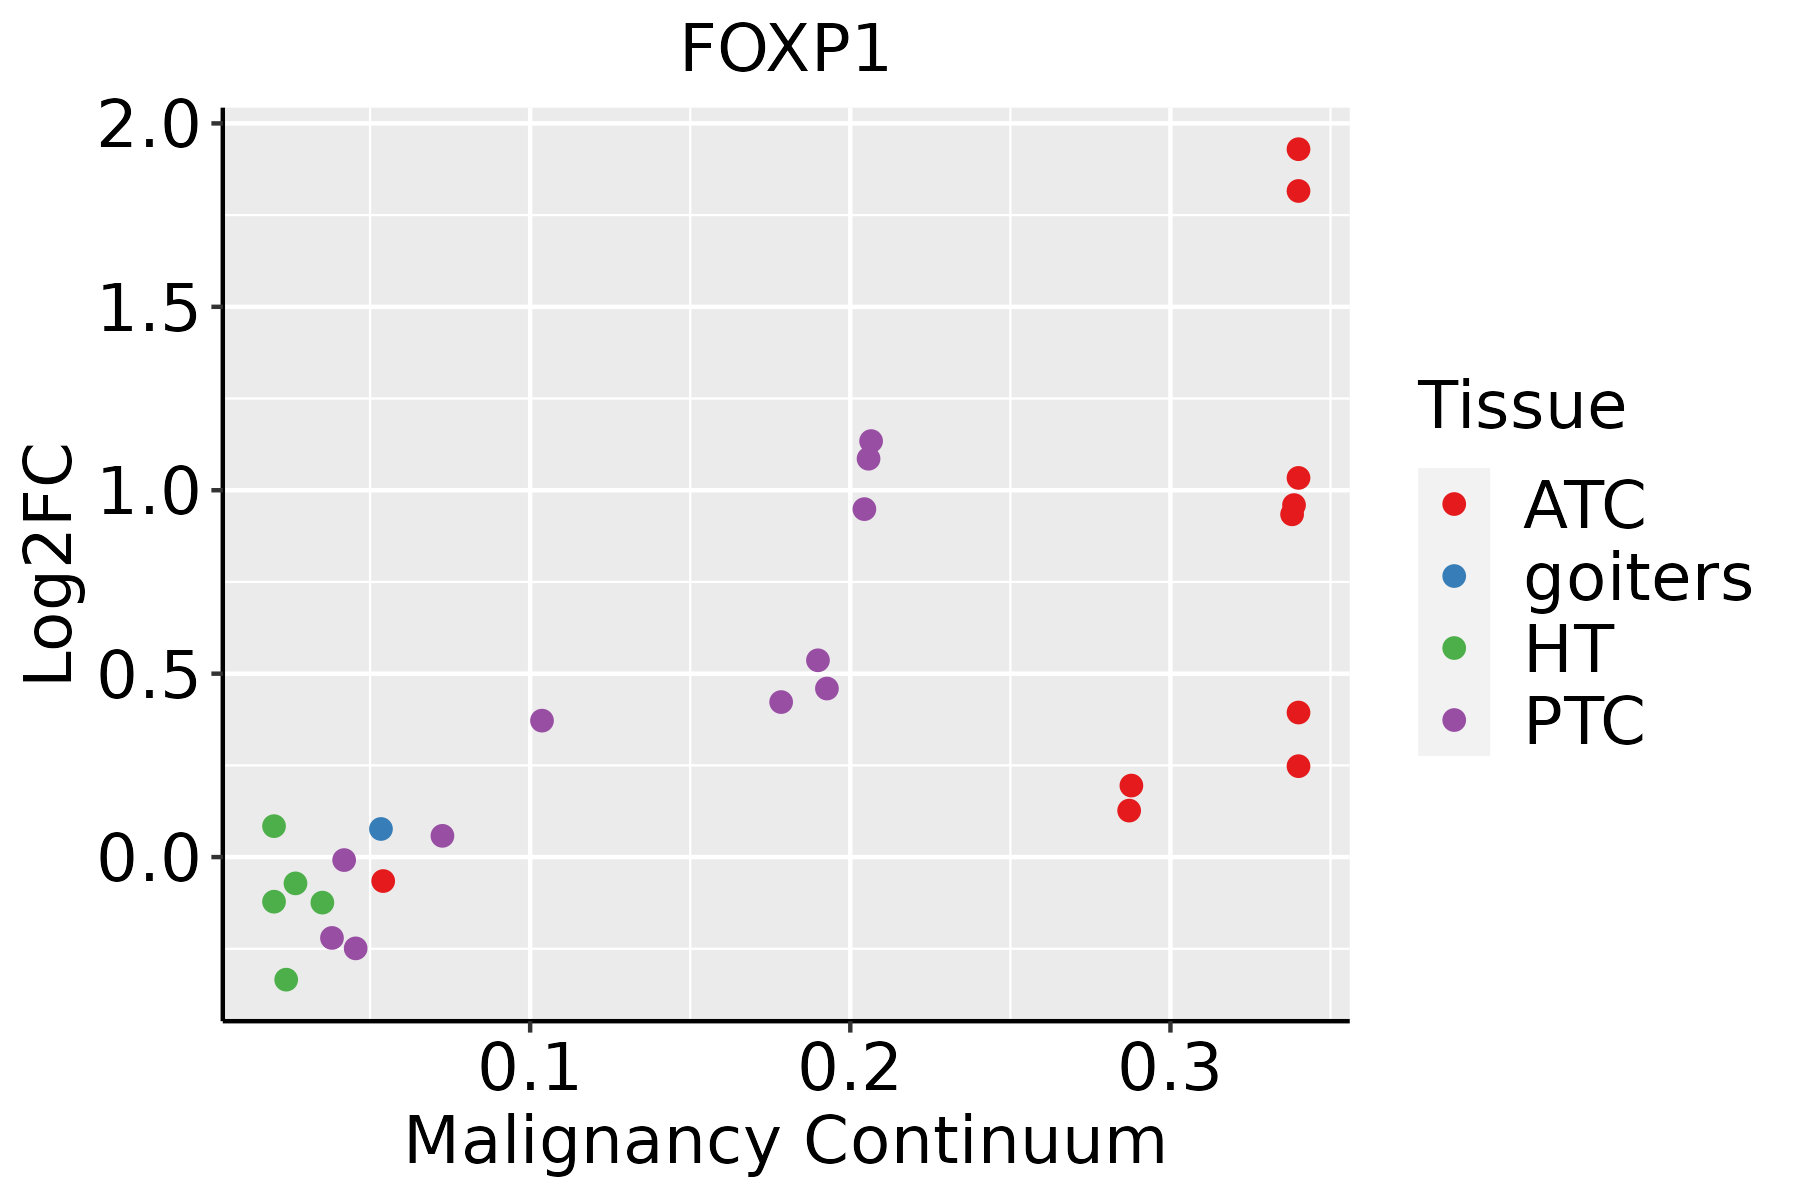
ATC: Anaplastic thyroid cancer
HT: Hashimoto's thyroiditis
PTC: Papillary thyroid cancer
∗log2FC in expression of this searched gene in stem-like cells from each diseased tissue sample relative to stem-like cells in normal samples in each tissue plotted against the malignancy continuum. Samples are colored based on if they are from different disease stage.

Top

Malignant transformation related pathway analysis

check buttonFind out the enriched GO biological processes and KEGG pathways involved in transition from healthy to precancer to cancer
check button Figure of enriched GO biological processes.
TissueDisease StageEnriched GO biological Processes
ColorectumADGO analysis - Figure of enriched GO biological processes: Top 15 enriched GO BP terms are showed in the bar plot of each disease state in each tissue. Each row represents a significant GO biological process which is colored according to the -log10(p.adjust).
ColorectumSERGO analysis - Figure of enriched GO biological processes: Top 15 enriched GO BP terms are showed in the bar plot of each disease state in each tissue. Each row represents a significant GO biological process which is colored according to the -log10(p.adjust).
ColorectumMSSGO analysis - Figure of enriched GO biological processes: Top 15 enriched GO BP terms are showed in the bar plot of each disease state in each tissue. Each row represents a significant GO biological process which is colored according to the -log10(p.adjust).
ColorectumMSI-HGO analysis - Figure of enriched GO biological processes: Top 15 enriched GO BP terms are showed in the bar plot of each disease state in each tissue. Each row represents a significant GO biological process which is colored according to the -log10(p.adjust).
ColorectumFAPGO analysis - Figure of enriched GO biological processes: Top 15 enriched GO BP terms are showed in the bar plot of each disease state in each tissue. Each row represents a significant GO biological process which is colored according to the -log10(p.adjust).
∗Top 15 enriched GO BP terms are showed in the bar plot of each disease state in each tissue. Each row represents a significant GO biological process which is colored according to the -log10(p.adjust).
Page: 1 2 3 4 5 6 7 8 9 

check button Enriched GO biological processes.
GO IDTissueDisease StageDescriptionGene RatioBg Ratiopvaluep.adjustCount
GO:00485459BreastPrecancerresponse to steroid hormone53/1080339/187233.07e-113.66e-0953
GO:00300999BreastPrecancermyeloid cell differentiation45/1080381/187234.00e-061.25e-0445
GO:00018196BreastPrecancerpositive regulation of cytokine production52/1080467/187234.18e-061.29e-0452
GO:00022378BreastPrecancerresponse to molecule of bacterial origin43/1080363/187236.05e-061.72e-0443
GO:00324968BreastPrecancerresponse to lipopolysaccharide41/1080343/187237.94e-062.17e-0441
GO:0050727BreastPrecancerregulation of inflammatory response44/1080386/187231.26e-053.22e-0444
GO:00421107BreastPrecancerT cell activation52/1080487/187231.37e-053.42e-0452
GO:00713838BreastPrecancercellular response to steroid hormone stimulus28/1080204/187231.78e-054.26e-0428
GO:00106348BreastPrecancerpositive regulation of epithelial cell migration25/1080176/187232.75e-056.21e-0425
GO:00456379BreastPrecancerregulation of myeloid cell differentiation28/1080210/187233.05e-056.72e-0428
GO:19037069BreastPrecancerregulation of hemopoiesis41/1080367/187233.95e-058.52e-0441
GO:00106319BreastPrecancerepithelial cell migration40/1080357/187234.57e-059.71e-0440
GO:00901329BreastPrecancerepithelium migration40/1080360/187235.51e-051.14e-0340
GO:00025737BreastPrecancermyeloid leukocyte differentiation27/1080208/187236.72e-051.35e-0327
GO:00435426BreastPrecancerendothelial cell migration33/1080279/187237.28e-051.44e-0333
GO:00901309BreastPrecancertissue migration40/1080365/187237.48e-051.47e-0340
GO:00105953BreastPrecancerpositive regulation of endothelial cell migration20/1080133/187237.59e-051.48e-0320
GO:00302248BreastPrecancermonocyte differentiation9/108036/187231.56e-042.66e-039
GO:00305217BreastPrecancerandrogen receptor signaling pathway10/108044/187231.61e-042.69e-0310
GO:19021055BreastPrecancerregulation of leukocyte differentiation32/1080279/187231.66e-042.74e-0332
Page: 1 2 3 4 5 6 7 8 9 10 11 12 13 14 15 16 17 18 19 20 21 22 23 24 25 26 27 28 29 30 31 32 33 34 35 36 37 38 39 40 41 42 43 44 45 46 47 48 49 50 51 52 53 54 55 56 57 

check button Enriched KEGG pathways.
Pathway IDTissueDisease StageDescriptionGene RatioBg Ratiopvaluep.adjustqvalueCount
Page: 1 

Top

Cell-cell communication analysis

check buttonIdentification of potential cell-cell interactions between two cell types and their ligand-receptor pairs for different disease states
LigandReceptorLRpairPathwayTissueDisease Stage
Page: 1 

Top

Single-cell gene regulatory network inference analysis

check buttonFind out the significant the regulons (TFs) and the target genes of each regulon across cell types for different disease states
TFCell TypeTissueDisease StageTarget GeneRSSRegulon Activity
FOXP1INCAFBreastDCISNNMT,COL6A3,MT-CO3, etc.9.41e-02The dot plots of a searched regulon are shown for all cell subpopulations in each disease state of each tissue based on the regulon specific score inferred using pySCENIC and by calculating the average expression.
FOXP1ECMBreastDCISNNMT,COL6A3,MT-CO3, etc.4.53e-01The dot plots of a searched regulon are shown for all cell subpopulations in each disease state of each tissue based on the regulon specific score inferred using pySCENIC and by calculating the average expression.
FOXP1INCAFBreastIDCNNMT,COL6A3,MT-CO3, etc.5.45e-01The dot plots of a searched regulon are shown for all cell subpopulations in each disease state of each tissue based on the regulon specific score inferred using pySCENIC and by calculating the average expression.
FOXP1IMGOBColorectumMSI-HGMDS,MCTP2,FRYL, etc.2.57e-01The dot plots of a searched regulon are shown for all cell subpopulations in each disease state of each tissue based on the regulon specific score inferred using pySCENIC and by calculating the average expression.
FOXP1STMColorectumMSSGMDS,MCTP2,FRYL, etc.2.64e-01The dot plots of a searched regulon are shown for all cell subpopulations in each disease state of each tissue based on the regulon specific score inferred using pySCENIC and by calculating the average expression.
FOXP1IMGOBColorectumMSSGMDS,MCTP2,FRYL, etc.2.90e-02The dot plots of a searched regulon are shown for all cell subpopulations in each disease state of each tissue based on the regulon specific score inferred using pySCENIC and by calculating the average expression.
FOXP1MYOFIBColorectumHealthyPDZRN3,MYLK,ARHGEF3, etc.6.57e-01The dot plots of a searched regulon are shown for all cell subpopulations in each disease state of each tissue based on the regulon specific score inferred using pySCENIC and by calculating the average expression.
FOXP1CILIAEndometriumEECPDGFD,SHANK2,ZBTB20, etc.1.95e-01The dot plots of a searched regulon are shown for all cell subpopulations in each disease state of each tissue based on the regulon specific score inferred using pySCENIC and by calculating the average expression.
FOXP1BMEMEndometriumADJBCL11B,CAMK4,SARAF, etc.1.39e-01The dot plots of a searched regulon are shown for all cell subpopulations in each disease state of each tissue based on the regulon specific score inferred using pySCENIC and by calculating the average expression.
FOXP1CD8TEXPEndometriumHealthyBCL11B,CAMK4,SARAF, etc.1.62e-01The dot plots of a searched regulon are shown for all cell subpopulations in each disease state of each tissue based on the regulon specific score inferred using pySCENIC and by calculating the average expression.
∗The dot plots of a searched regulon are shown for all cell subpopulations in each disease state of each tissue based on the regulon specific score inferred using pySCENIC and by calculating the average expression.
Page: 1 2 3 4 

Top

Somatic mutation of malignant transformation related genes

check buttonAnnotation of somatic variants for genes involved in malignant transformation
Hugo SymbolVariant ClassVariant ClassificationdbSNP RSHGVScHGVSpHGVSp ShortSWISSPROTBIOTYPESIFTPolyPhenTumor Sample BarcodeTissueHistologySexAgeStageTherapy TypesDrugsOutcome
FOXP1SNVMissense_Mutationrs797045585c.1510N>Gp.Arg504Glyp.R504Gprotein_codingdeleterious(0.02)probably_damaging(0.999)TCGA-BH-A1F8-01Breastbreast invasive carcinomaFemale>=65III/IVUnknownUnknownPD
FOXP1SNVMissense_Mutationc.1323N>Gp.Asp441Glup.D441Eprotein_codingtolerated(0.24)benign(0.015)TCGA-C8-A12L-01Breastbreast invasive carcinomaFemale>=65I/IIUnknownUnknownSD
FOXP1deletionFrame_Shift_Delnovelc.679_680delNNp.Glu227ThrfsTer67p.E227Tfs*67protein_codingTCGA-A2-A4RY-01Breastbreast invasive carcinomaFemale<65III/IVChemotherapytaxotereCR
FOXP1insertionNonsense_Mutationnovelc.1964_1965insTACTTTTTGTTGAAAAAAGGAATTTGTACTCTGTGCATTp.Pro655_Leu656insThrPheCysTerLysLysGluPheValLeuCysAlaPhep.P655_L656insTFC*KKEFVLCAFprotein_codingTCGA-A8-A09E-01Breastbreast invasive carcinomaFemale>=65III/IVHormone TherapyanastrozoleSD
FOXP1insertionNonsense_Mutationnovelc.198_199insACAGCTCTGGAGGATGAAATACGACTATGTTGACCTTTp.Gln67ThrfsTer11p.Q67Tfs*11protein_codingTCGA-A8-A09E-01Breastbreast invasive carcinomaFemale>=65III/IVHormone TherapyanastrozoleSD
FOXP1insertionFrame_Shift_Insnovelc.706_707insGTGAp.Thr236SerfsTer60p.T236Sfs*60protein_codingTCGA-AC-A3YJ-01Breastbreast invasive carcinomaFemale>=65I/IIHormone TherapyarimidexSD
FOXP1deletionFrame_Shift_Delnovelc.328delNp.Gln110SerfsTer12p.Q110Sfs*12protein_codingTCGA-D8-A27V-01Breastbreast invasive carcinomaFemale<65I/IIHormone TherapytamoxiphenSD
FOXP1SNVMissense_Mutationnovelc.1306C>Tp.Arg436Cysp.R436Cprotein_codingdeleterious(0)probably_damaging(0.987)TCGA-2W-A8YY-01Cervixcervical & endocervical cancerFemale<65I/IIChemotherapycisplatinCR
FOXP1SNVMissense_Mutationc.1091C>Tp.Ala364Valp.A364Vprotein_codingdeleterious(0.03)possibly_damaging(0.87)TCGA-IR-A3LK-01Cervixcervical & endocervical cancerFemale>=65I/IIChemotherapycisplatinPD
FOXP1SNVMissense_Mutationc.1235N>Tp.Ala412Valp.A412Vprotein_codingdeleterious(0.02)benign(0.225)TCGA-MA-AA41-01Cervixcervical & endocervical cancerFemale<65I/IIUnknownUnknownSD
Page: 1 2 3 4 5 6 7 8 9 10 

Top

Related drugs of malignant transformation related genes

check buttonIdentification of chemicals and drugs interact with genes involved in malignant transfromation
(DGIdb 4.0)
Entrez IDSymbolCategoryInteraction TypesDrug Claim NameDrug NamePMIDs
Page: 1