
|
|||||
|
 | |
| |
| |
| |
| |
| |
|
Gene: FOXO1 |
Gene summary for FOXO1 |
| Gene information | Species | Human | Gene symbol | FOXO1 | Gene ID | 2308 |
| Gene name | forkhead box O1 | |
| Gene Alias | FKH1 | |
| Cytomap | 13q14.11 | |
| Gene Type | protein-coding | GO ID | GO:0000165 | UniProtAcc | Q12778 |
Top |
Malignant transformation analysis |
| Identification of the aberrant gene expression in precancerous and cancerous lesions by comparing the gene expression of stem-like cells in diseased tissues with normal stem cells |
| Entrez ID | Symbol | Replicates | Species | Organ | Tissue | Adj P-value | Log2FC | Malignancy |
| 2308 | FOXO1 | CCI_1 | Human | Cervix | CC | 5.36e-22 | 1.88e+00 | 0.528 |
| 2308 | FOXO1 | CCI_2 | Human | Cervix | CC | 5.07e-08 | 1.08e+00 | 0.5249 |
| 2308 | FOXO1 | CCI_3 | Human | Cervix | CC | 1.93e-11 | 7.93e-01 | 0.516 |
| 2308 | FOXO1 | HTA11_3410_2000001011 | Human | Colorectum | AD | 9.18e-18 | -6.72e-01 | 0.0155 |
| 2308 | FOXO1 | HTA11_866_3004761011 | Human | Colorectum | AD | 1.34e-04 | -5.24e-01 | 0.096 |
| 2308 | FOXO1 | HTA11_10711_2000001011 | Human | Colorectum | AD | 1.73e-03 | -4.94e-01 | 0.0338 |
| 2308 | FOXO1 | HTA11_7696_3000711011 | Human | Colorectum | AD | 3.86e-12 | -5.39e-01 | 0.0674 |
| 2308 | FOXO1 | HTA11_6818_2000001021 | Human | Colorectum | AD | 1.78e-03 | -5.35e-01 | 0.0588 |
| 2308 | FOXO1 | HTA11_99999970781_79442 | Human | Colorectum | MSS | 1.97e-16 | -5.91e-01 | 0.294 |
| 2308 | FOXO1 | HTA11_99999974143_84620 | Human | Colorectum | MSS | 4.37e-34 | -8.11e-01 | 0.3005 |
| 2308 | FOXO1 | F007 | Human | Colorectum | FAP | 1.07e-02 | -4.04e-01 | 0.1176 |
| 2308 | FOXO1 | A002-C-010 | Human | Colorectum | FAP | 1.54e-11 | -4.92e-01 | 0.242 |
| 2308 | FOXO1 | A001-C-207 | Human | Colorectum | FAP | 3.00e-08 | -5.83e-01 | 0.1278 |
| 2308 | FOXO1 | A015-C-203 | Human | Colorectum | FAP | 1.97e-33 | -6.55e-01 | -0.1294 |
| 2308 | FOXO1 | A015-C-204 | Human | Colorectum | FAP | 2.00e-07 | -4.54e-01 | -0.0228 |
| 2308 | FOXO1 | A014-C-040 | Human | Colorectum | FAP | 6.53e-07 | -7.48e-01 | -0.1184 |
| 2308 | FOXO1 | A002-C-201 | Human | Colorectum | FAP | 7.16e-18 | -6.07e-01 | 0.0324 |
| 2308 | FOXO1 | A002-C-203 | Human | Colorectum | FAP | 9.86e-13 | -5.49e-01 | 0.2786 |
| 2308 | FOXO1 | A001-C-119 | Human | Colorectum | FAP | 3.78e-09 | -6.35e-01 | -0.1557 |
| 2308 | FOXO1 | A001-C-108 | Human | Colorectum | FAP | 5.56e-25 | -5.57e-01 | -0.0272 |
| Page: 1 2 3 4 5 6 |
| Tissue | Expression Dynamics | Abbreviation |
| Cervix | 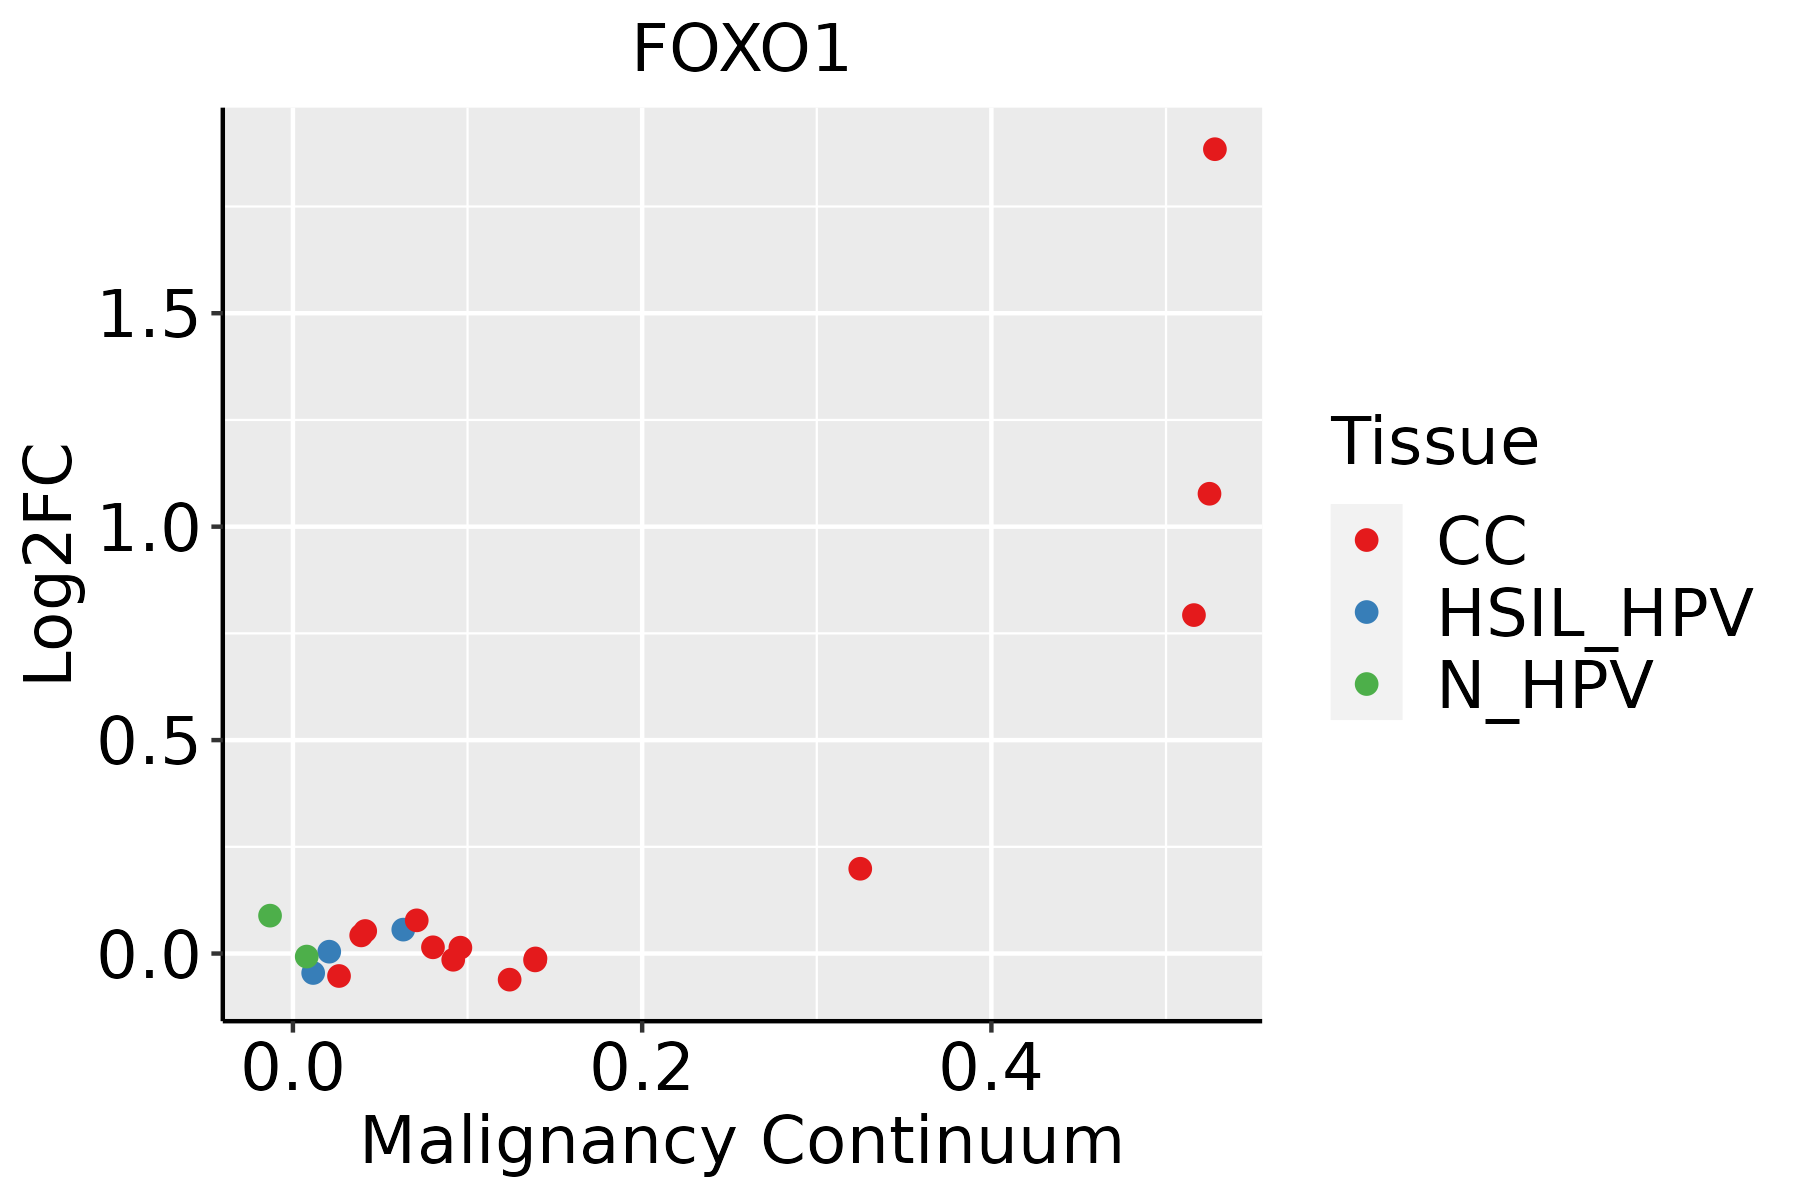 | CC: Cervix cancer |
| HSIL_HPV: HPV-infected high-grade squamous intraepithelial lesions | ||
| N_HPV: HPV-infected normal cervix | ||
| Colorectum (GSE201348) |  | FAP: Familial adenomatous polyposis |
| CRC: Colorectal cancer | ||
| Colorectum (HTA11) |  | AD: Adenomas |
| SER: Sessile serrated lesions | ||
| MSI-H: Microsatellite-high colorectal cancer | ||
| MSS: Microsatellite stable colorectal cancer | ||
| Endometrium |  | AEH: Atypical endometrial hyperplasia |
| EEC: Endometrioid Cancer | ||
| Liver | 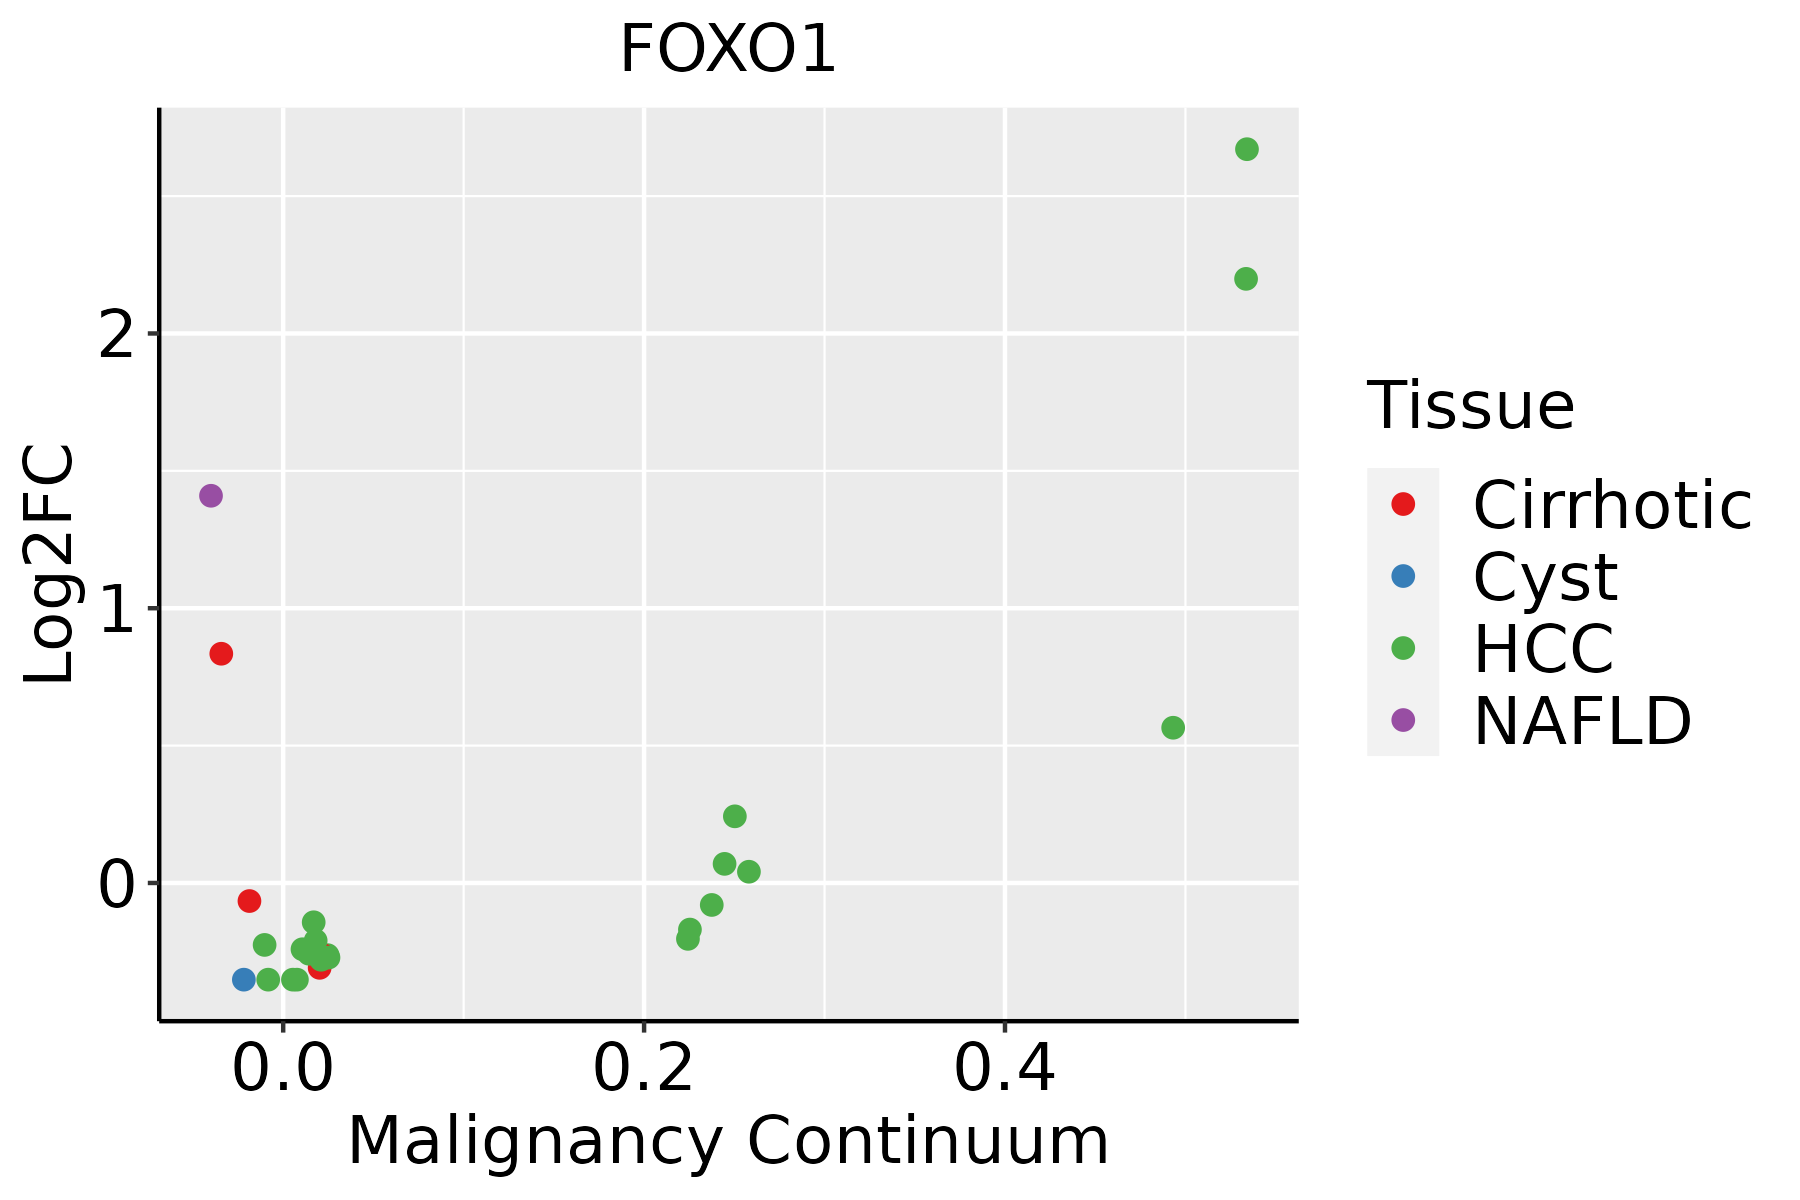 | HCC: Hepatocellular carcinoma |
| NAFLD: Non-alcoholic fatty liver disease | ||
| Prostate | 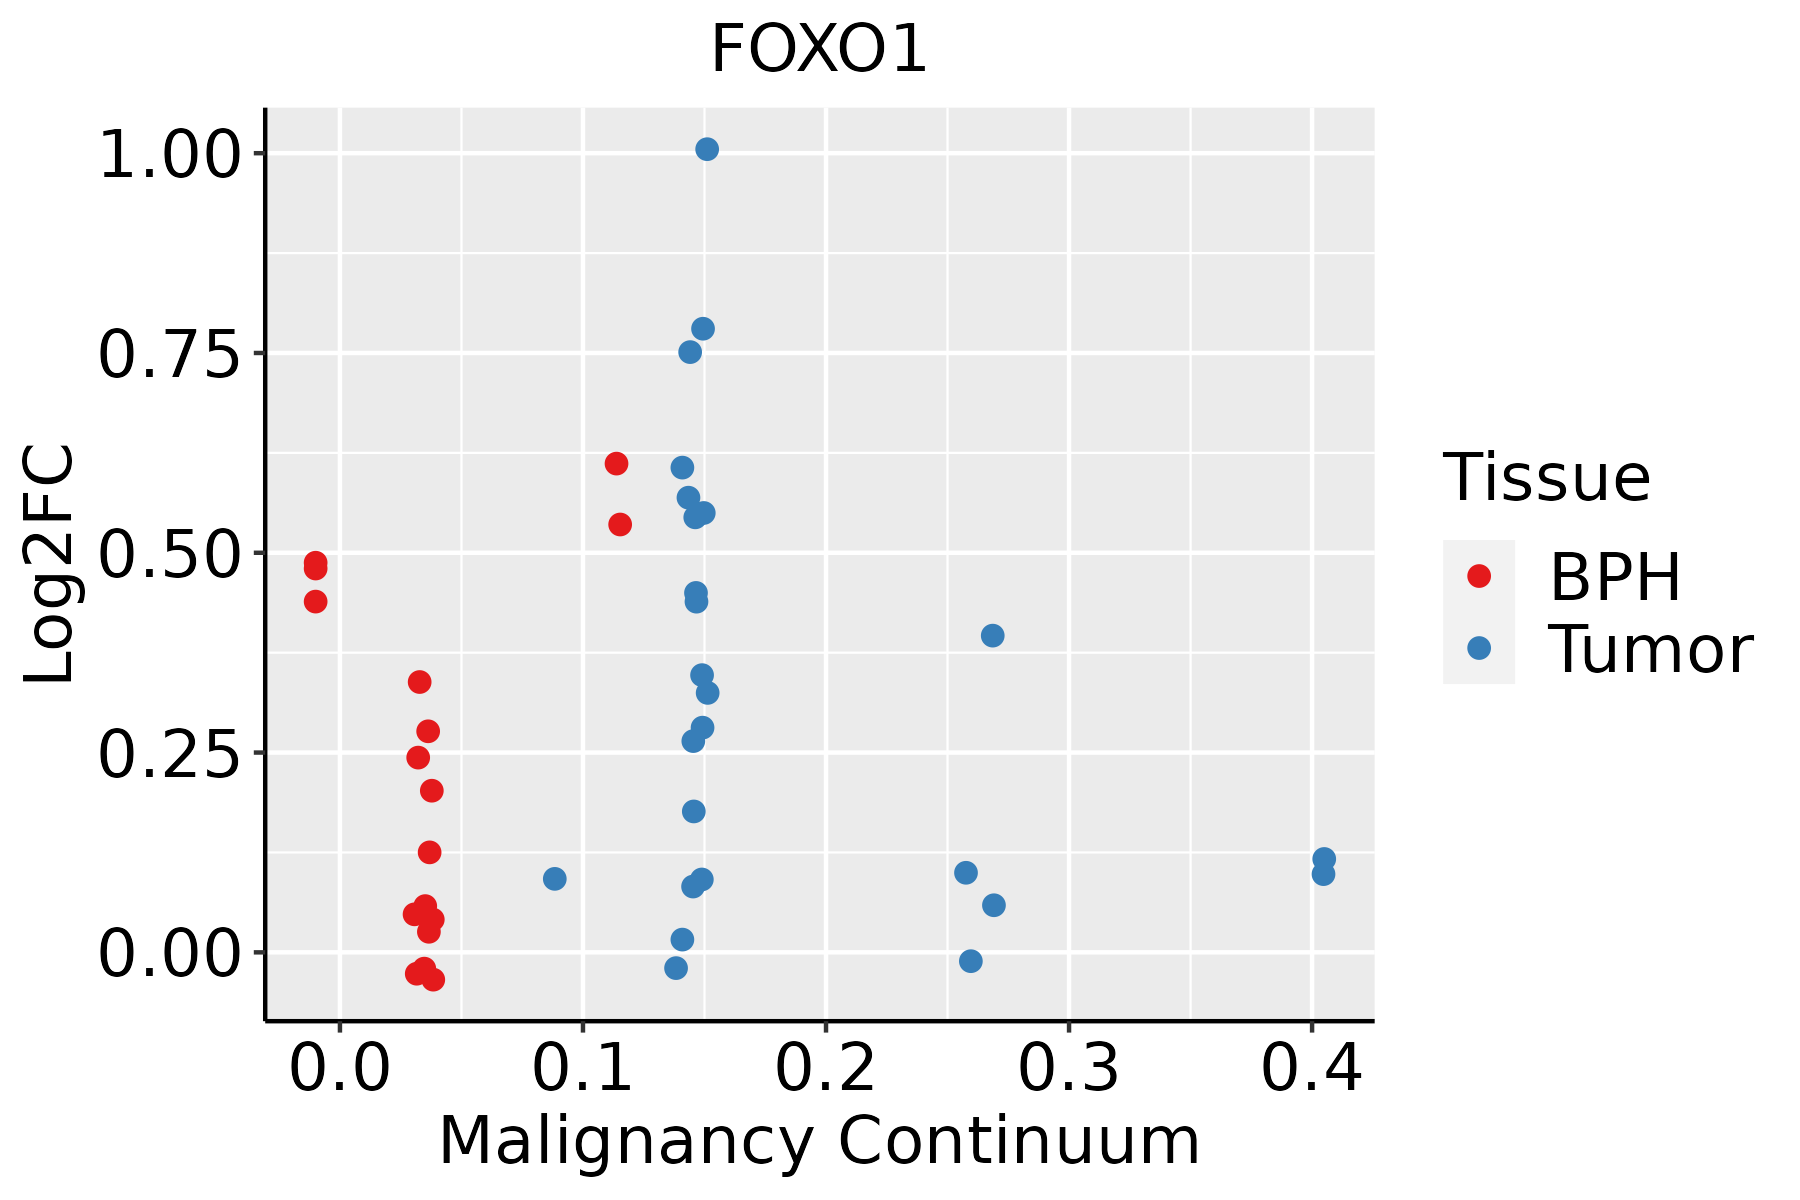 | BPH: Benign Prostatic Hyperplasia |
| Thyroid | 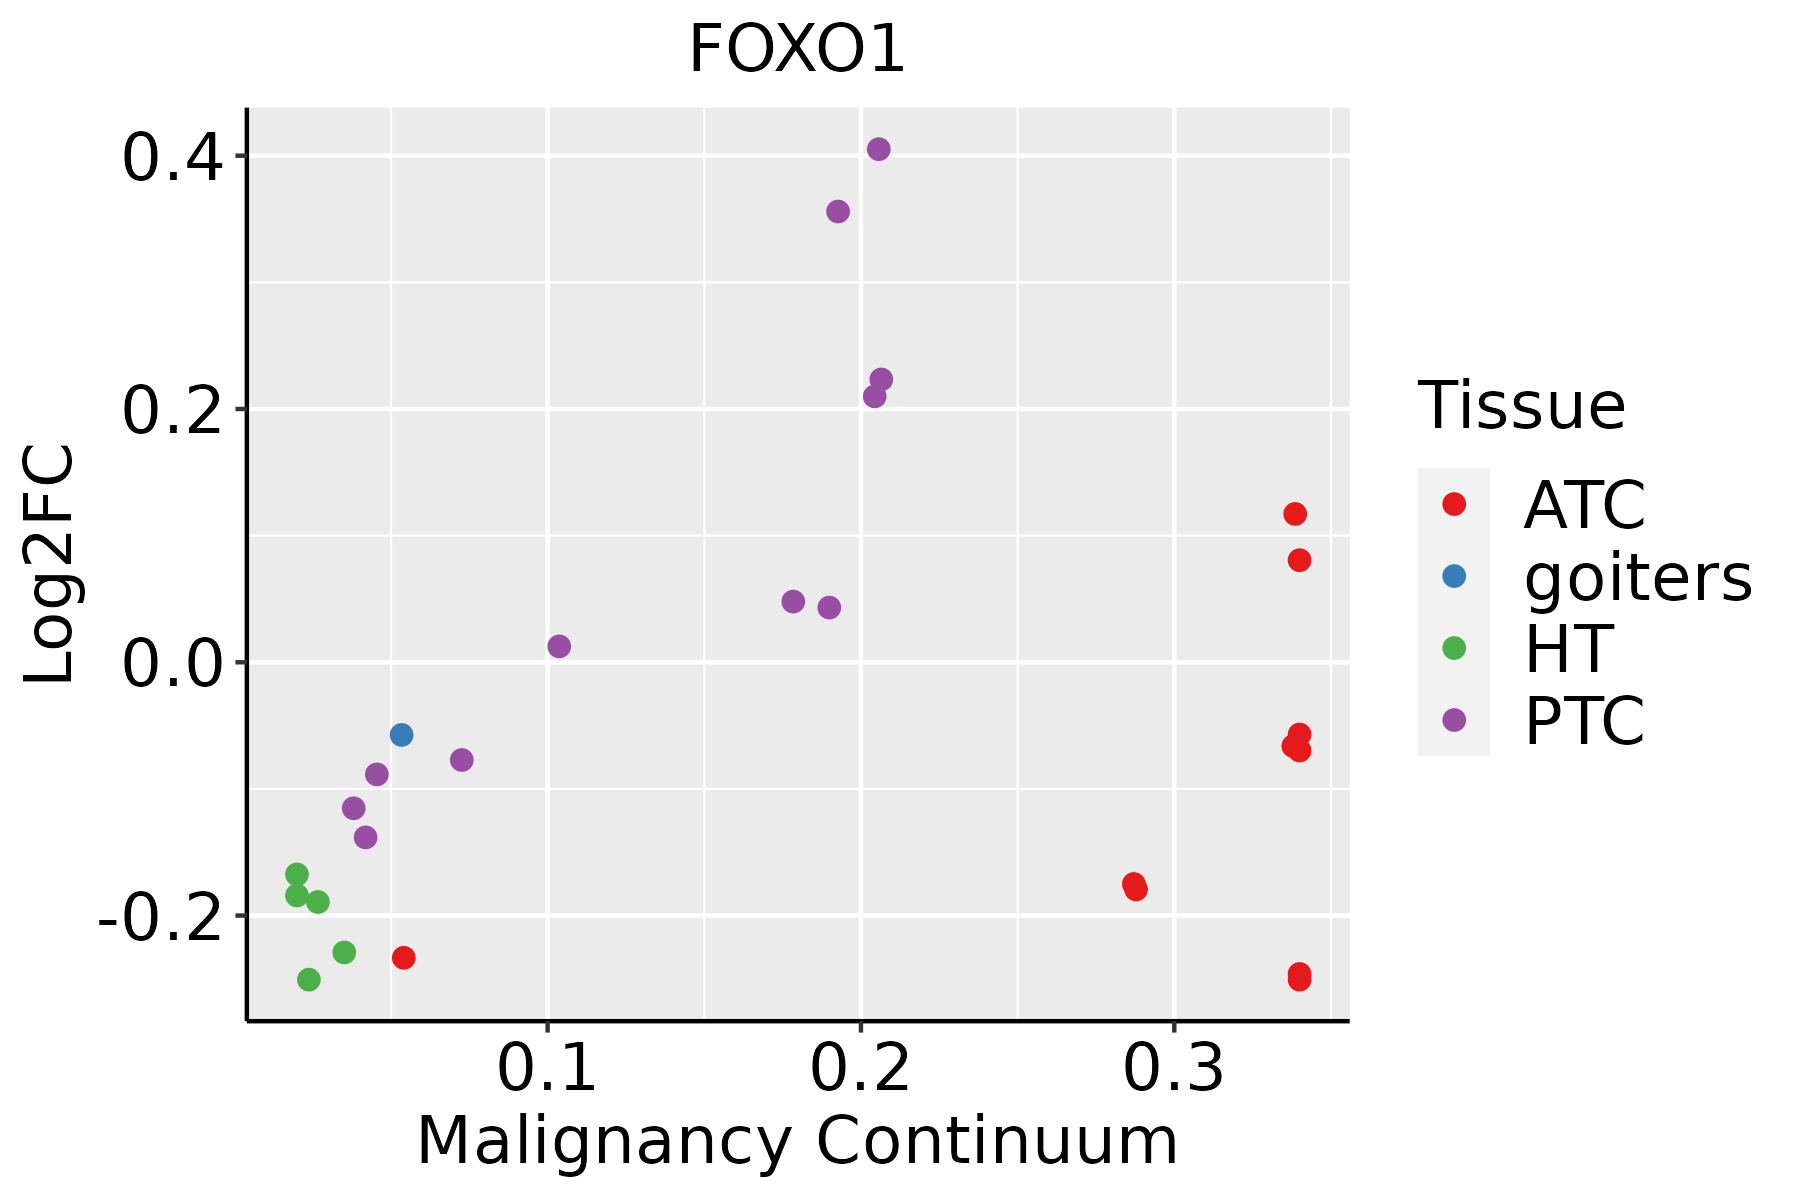 | ATC: Anaplastic thyroid cancer |
| HT: Hashimoto's thyroiditis | ||
| PTC: Papillary thyroid cancer |
| ∗log2FC in expression of this searched gene in stem-like cells from each diseased tissue sample relative to stem-like cells in normal samples in each tissue plotted against the malignancy continuum. Samples are colored based on if they are from different disease stage. |
Top |
Malignant transformation related pathway analysis |
| Find out the enriched GO biological processes and KEGG pathways involved in transition from healthy to precancer to cancer |
| Tissue | Disease Stage | Enriched GO biological Processes |
| Colorectum | AD |  |
| Colorectum | SER |  |
| Colorectum | MSS |  |
| Colorectum | MSI-H |  |
| Colorectum | FAP |  |
| ∗Top 15 enriched GO BP terms are showed in the bar plot of each disease state in each tissue. Each row represents a significant GO biological process which is colored according to the -log10(p.adjust). |
| Page: 1 2 3 4 5 6 7 8 9 |
| GO ID | Tissue | Disease Stage | Description | Gene Ratio | Bg Ratio | pvalue | p.adjust | Count |
| GO:004217610 | Cervix | CC | regulation of protein catabolic process | 104/2311 | 391/18723 | 9.39e-15 | 9.36e-12 | 104 |
| GO:004573210 | Cervix | CC | positive regulation of protein catabolic process | 65/2311 | 231/18723 | 7.44e-11 | 1.39e-08 | 65 |
| GO:000697910 | Cervix | CC | response to oxidative stress | 102/2311 | 446/18723 | 2.99e-10 | 4.36e-08 | 102 |
| GO:000989610 | Cervix | CC | positive regulation of catabolic process | 109/2311 | 492/18723 | 5.26e-10 | 6.99e-08 | 109 |
| GO:007149610 | Cervix | CC | cellular response to external stimulus | 78/2311 | 320/18723 | 1.82e-09 | 1.98e-07 | 78 |
| GO:003133110 | Cervix | CC | positive regulation of cellular catabolic process | 91/2311 | 427/18723 | 9.64e-08 | 5.25e-06 | 91 |
| GO:000030210 | Cervix | CC | response to reactive oxygen species | 56/2311 | 222/18723 | 1.00e-07 | 5.25e-06 | 56 |
| GO:006219710 | Cervix | CC | cellular response to chemical stress | 76/2311 | 337/18723 | 1.01e-07 | 5.25e-06 | 76 |
| GO:00316689 | Cervix | CC | cellular response to extracellular stimulus | 59/2311 | 246/18723 | 3.03e-07 | 1.24e-05 | 59 |
| GO:004854510 | Cervix | CC | response to steroid hormone | 74/2311 | 339/18723 | 5.71e-07 | 2.09e-05 | 74 |
| GO:004254210 | Cervix | CC | response to hydrogen peroxide | 40/2311 | 146/18723 | 6.79e-07 | 2.46e-05 | 40 |
| GO:00310988 | Cervix | CC | stress-activated protein kinase signaling cascade | 58/2311 | 247/18723 | 8.02e-07 | 2.89e-05 | 58 |
| GO:00514038 | Cervix | CC | stress-activated MAPK cascade | 55/2311 | 239/18723 | 2.96e-06 | 8.31e-05 | 55 |
| GO:003459910 | Cervix | CC | cellular response to oxidative stress | 63/2311 | 288/18723 | 3.58e-06 | 9.50e-05 | 63 |
| GO:00454445 | Cervix | CC | fat cell differentiation | 53/2311 | 229/18723 | 3.72e-06 | 9.75e-05 | 53 |
| GO:003166710 | Cervix | CC | response to nutrient levels | 92/2311 | 474/18723 | 5.80e-06 | 1.42e-04 | 92 |
| GO:00703027 | Cervix | CC | regulation of stress-activated protein kinase signaling cascade | 46/2311 | 195/18723 | 9.35e-06 | 2.11e-04 | 46 |
| GO:00092678 | Cervix | CC | cellular response to starvation | 39/2311 | 156/18723 | 1.04e-05 | 2.32e-04 | 39 |
| GO:00425948 | Cervix | CC | response to starvation | 46/2311 | 197/18723 | 1.24e-05 | 2.59e-04 | 46 |
| GO:00316698 | Cervix | CC | cellular response to nutrient levels | 49/2311 | 215/18723 | 1.32e-05 | 2.68e-04 | 49 |
| Page: 1 2 3 4 5 6 7 8 9 10 11 12 13 14 15 16 17 18 19 20 21 22 23 24 25 26 27 28 29 30 31 32 33 34 35 36 37 38 39 |
| Pathway ID | Tissue | Disease Stage | Description | Gene Ratio | Bg Ratio | pvalue | p.adjust | qvalue | Count |
| hsa0513120 | Cervix | CC | Shigellosis | 69/1267 | 247/8465 | 7.64e-08 | 1.03e-06 | 6.10e-07 | 69 |
| hsa0421810 | Cervix | CC | Cellular senescence | 49/1267 | 156/8465 | 1.30e-07 | 1.63e-06 | 9.61e-07 | 49 |
| hsa051657 | Cervix | CC | Human papillomavirus infection | 74/1267 | 331/8465 | 1.70e-04 | 1.02e-03 | 6.03e-04 | 74 |
| hsa0491918 | Cervix | CC | Thyroid hormone signaling pathway | 33/1267 | 121/8465 | 3.11e-04 | 1.65e-03 | 9.78e-04 | 33 |
| hsa052157 | Cervix | CC | Prostate cancer | 27/1267 | 97/8465 | 7.54e-04 | 3.39e-03 | 2.01e-03 | 27 |
| hsa049336 | Cervix | CC | AGE-RAGE signaling pathway in diabetic complications | 25/1267 | 100/8465 | 5.64e-03 | 1.88e-02 | 1.11e-02 | 25 |
| hsa05131110 | Cervix | CC | Shigellosis | 69/1267 | 247/8465 | 7.64e-08 | 1.03e-06 | 6.10e-07 | 69 |
| hsa0421815 | Cervix | CC | Cellular senescence | 49/1267 | 156/8465 | 1.30e-07 | 1.63e-06 | 9.61e-07 | 49 |
| hsa0516512 | Cervix | CC | Human papillomavirus infection | 74/1267 | 331/8465 | 1.70e-04 | 1.02e-03 | 6.03e-04 | 74 |
| hsa0491919 | Cervix | CC | Thyroid hormone signaling pathway | 33/1267 | 121/8465 | 3.11e-04 | 1.65e-03 | 9.78e-04 | 33 |
| hsa0521512 | Cervix | CC | Prostate cancer | 27/1267 | 97/8465 | 7.54e-04 | 3.39e-03 | 2.01e-03 | 27 |
| hsa0493313 | Cervix | CC | AGE-RAGE signaling pathway in diabetic complications | 25/1267 | 100/8465 | 5.64e-03 | 1.88e-02 | 1.11e-02 | 25 |
| hsa05131 | Colorectum | AD | Shigellosis | 109/2092 | 247/8465 | 1.09e-11 | 2.44e-10 | 1.55e-10 | 109 |
| hsa04919 | Colorectum | AD | Thyroid hormone signaling pathway | 51/2092 | 121/8465 | 1.71e-05 | 1.73e-04 | 1.10e-04 | 51 |
| hsa04152 | Colorectum | AD | AMPK signaling pathway | 47/2092 | 121/8465 | 3.74e-04 | 2.82e-03 | 1.80e-03 | 47 |
| hsa04213 | Colorectum | AD | Longevity regulating pathway - multiple species | 27/2092 | 62/8465 | 8.72e-04 | 5.96e-03 | 3.80e-03 | 27 |
| hsa04922 | Colorectum | AD | Glucagon signaling pathway | 41/2092 | 107/8465 | 1.18e-03 | 7.75e-03 | 4.94e-03 | 41 |
| hsa04218 | Colorectum | AD | Cellular senescence | 53/2092 | 156/8465 | 5.55e-03 | 2.48e-02 | 1.58e-02 | 53 |
| hsa04211 | Colorectum | AD | Longevity regulating pathway | 33/2092 | 89/8465 | 6.15e-03 | 2.68e-02 | 1.71e-02 | 33 |
| hsa05215 | Colorectum | AD | Prostate cancer | 35/2092 | 97/8465 | 7.95e-03 | 3.13e-02 | 2.00e-02 | 35 |
| Page: 1 2 3 4 5 6 7 8 9 10 |
Top |
Cell-cell communication analysis |
| Identification of potential cell-cell interactions between two cell types and their ligand-receptor pairs for different disease states |
| Ligand | Receptor | LRpair | Pathway | Tissue | Disease Stage |
| Page: 1 |
Top |
Single-cell gene regulatory network inference analysis |
| Find out the significant the regulons (TFs) and the target genes of each regulon across cell types for different disease states |
| TF | Cell Type | Tissue | Disease Stage | Target Gene | RSS | Regulon Activity |
| FOXO1 | TREG | Breast | IDC | AC062029.1,CUL9,IL1R2, etc. | 1.56e-01 |  |
| FOXO1 | CD8TRM | Cervix | ADJ | IKZF2,LINC02694,IL12RB2, etc. | 2.92e-01 |  |
| FOXO1 | NK | Cervix | CC | IKZF2,LINC02694,IL12RB2, etc. | 2.35e-01 |  |
| FOXO1 | MSC | Cervix | CC | CUX1,MACF1,SYNJ2, etc. | 5.13e-01 | |
| FOXO1 | MSC.SEC | Liver | Cirrhotic | MAGI1,COMMD10,NFAT5, etc. | 3.06e-01 |  |
| FOXO1 | MSC.SEC | Liver | Healthy | MAGI1,COMMD10,NFAT5, etc. | 6.20e-01 |  |
| FOXO1 | TREG | Lung | IAC | DUSP16,NIBAN1,FOXP1, etc. | 1.98e-01 |  |
| FOXO1 | CD8TEXP | Lung | IAC | DUSP16,NIBAN1,FOXP1, etc. | 1.49e-01 | |
| FOXO1 | CD4TN | Lung | IAC | DUSP16,NIBAN1,FOXP1, etc. | 2.04e-01 | |
| FOXO1 | PVA | Lung | ADJ | BMP6,ADGRG6,FAM155A, etc. | 2.65e-01 |  |
| ∗The dot plots of a searched regulon are shown for all cell subpopulations in each disease state of each tissue based on the regulon specific score inferred using pySCENIC and by calculating the average expression. |
| Page: 1 2 |
Top |
Somatic mutation of malignant transformation related genes |
| Annotation of somatic variants for genes involved in malignant transformation |
| Hugo Symbol | Variant Class | Variant Classification | dbSNP RS | HGVSc | HGVSp | HGVSp Short | SWISSPROT | BIOTYPE | SIFT | PolyPhen | Tumor Sample Barcode | Tissue | Histology | Sex | Age | Stage | Therapy Types | Drugs | Outcome |
| FOXO1 | insertion | Nonsense_Mutation | novel | c.1650_1651insCTCTTCAATAAATGAATACATTTGATATAAATCAAATGCT | p.Gly551LeufsTer5 | p.G551Lfs*5 | Q12778 | protein_coding | TCGA-B6-A0RG-01 | Breast | breast invasive carcinoma | Female | <65 | I/II | Unknown | Unknown | SD | ||
| FOXO1 | SNV | Missense_Mutation | c.1595C>T | p.Ser532Phe | p.S532F | Q12778 | protein_coding | tolerated(0.69) | benign(0.054) | TCGA-IR-A3LA-01 | Cervix | cervical & endocervical cancer | Female | <65 | I/II | Chemotherapy | cisplatin | CR | |
| FOXO1 | SNV | Missense_Mutation | c.1105N>A | p.Glu369Lys | p.E369K | Q12778 | protein_coding | tolerated(0.7) | benign(0.029) | TCGA-AA-A00N-01 | Colorectum | colon adenocarcinoma | Male | >=65 | I/II | Unknown | Unknown | PD | |
| FOXO1 | SNV | Missense_Mutation | rs377728010 | c.836N>T | p.Ser279Phe | p.S279F | Q12778 | protein_coding | deleterious(0.01) | possibly_damaging(0.592) | TCGA-AZ-6598-01 | Colorectum | colon adenocarcinoma | Female | >=65 | I/II | Unknown | Unknown | SD |
| FOXO1 | SNV | Missense_Mutation | c.591N>G | p.Phe197Leu | p.F197L | Q12778 | protein_coding | deleterious(0.01) | probably_damaging(0.997) | TCGA-D5-6535-01 | Colorectum | colon adenocarcinoma | Female | >=65 | III/IV | Unknown | Unknown | SD | |
| FOXO1 | SNV | Missense_Mutation | c.562N>A | p.Glu188Lys | p.E188K | Q12778 | protein_coding | deleterious(0) | benign(0.115) | TCGA-D5-6924-01 | Colorectum | colon adenocarcinoma | Male | >=65 | I/II | Unknown | Unknown | SD | |
| FOXO1 | SNV | Missense_Mutation | c.940N>T | p.Arg314Cys | p.R314C | Q12778 | protein_coding | deleterious(0) | probably_damaging(0.997) | TCGA-F4-6570-01 | Colorectum | colon adenocarcinoma | Female | >=65 | I/II | Unknown | Unknown | SD | |
| FOXO1 | SNV | Missense_Mutation | c.947G>A | p.Arg316Gln | p.R316Q | Q12778 | protein_coding | deleterious(0) | probably_damaging(0.994) | TCGA-AG-A002-01 | Colorectum | rectum adenocarcinoma | Male | <65 | I/II | Unknown | Unknown | SD | |
| FOXO1 | SNV | Missense_Mutation | rs760747458 | c.941G>A | p.Arg314His | p.R314H | Q12778 | protein_coding | deleterious(0) | probably_damaging(0.997) | TCGA-F5-6814-01 | Colorectum | rectum adenocarcinoma | Male | <65 | I/II | Unknown | Unknown | SD |
| FOXO1 | insertion | Frame_Shift_Ins | novel | c.482_483insG | p.Asn162GlnfsTer39 | p.N162Qfs*39 | Q12778 | protein_coding | TCGA-AA-3492-01 | Colorectum | colon adenocarcinoma | Female | >=65 | I/II | Unknown | Unknown | SD |
| Page: 1 2 3 4 5 6 7 |
Top |
Related drugs of malignant transformation related genes |
| Identification of chemicals and drugs interact with genes involved in malignant transfromation |
| (DGIdb 4.0) |
| Entrez ID | Symbol | Category | Interaction Types | Drug Claim Name | Drug Name | PMIDs |
| 2308 | FOXO1 | CLINICALLY ACTIONABLE, TRANSCRIPTION FACTOR | fluorouracil | FLUOROURACIL | ||
| 2308 | FOXO1 | CLINICALLY ACTIONABLE, TRANSCRIPTION FACTOR | cyclophosphamide | CYCLOPHOSPHAMIDE | ||
| 2308 | FOXO1 | CLINICALLY ACTIONABLE, TRANSCRIPTION FACTOR | FAS LIGAND | 12172378 | ||
| 2308 | FOXO1 | CLINICALLY ACTIONABLE, TRANSCRIPTION FACTOR | epirubicin | EPIRUBICIN | ||
| 2308 | FOXO1 | CLINICALLY ACTIONABLE, TRANSCRIPTION FACTOR | BET INHIBITOR | 28446439 |
| Page: 1 |

Copyright 2023-Present -The University of Texas Health Science Center at Houston |