
|
|||||
|
 | |
| |
| |
| |
| |
| |
|
Gene: FOXN3 |
Gene summary for FOXN3 |
| Gene information | Species | Human | Gene symbol | FOXN3 | Gene ID | 1112 |
| Gene name | forkhead box N3 | |
| Gene Alias | C14orf116 | |
| Cytomap | 14q31.3-q32.11 | |
| Gene Type | protein-coding | GO ID | GO:0000075 | UniProtAcc | A0A024R6I1 |
Top |
Malignant transformation analysis |
| Identification of the aberrant gene expression in precancerous and cancerous lesions by comparing the gene expression of stem-like cells in diseased tissues with normal stem cells |
| Entrez ID | Symbol | Replicates | Species | Organ | Tissue | Adj P-value | Log2FC | Malignancy |
| 1112 | FOXN3 | CCI_1 | Human | Cervix | CC | 1.69e-08 | 9.61e-01 | 0.528 |
| 1112 | FOXN3 | CCI_2 | Human | Cervix | CC | 6.36e-03 | 8.05e-01 | 0.5249 |
| 1112 | FOXN3 | CCI_3 | Human | Cervix | CC | 8.74e-12 | 1.20e+00 | 0.516 |
| 1112 | FOXN3 | HTA11_3410_2000001011 | Human | Colorectum | AD | 5.70e-09 | -3.82e-01 | 0.0155 |
| 1112 | FOXN3 | HTA11_347_2000001011 | Human | Colorectum | AD | 2.10e-11 | 6.06e-01 | -0.1954 |
| 1112 | FOXN3 | HTA11_2112_2000001011 | Human | Colorectum | SER | 9.92e-10 | -5.41e-01 | -0.2196 |
| 1112 | FOXN3 | HTA11_866_3004761011 | Human | Colorectum | AD | 4.05e-02 | -3.21e-01 | 0.096 |
| 1112 | FOXN3 | HTA11_4255_2000001011 | Human | Colorectum | SER | 1.32e-02 | -3.09e-01 | 0.0446 |
| 1112 | FOXN3 | HTA11_11156_2000001011 | Human | Colorectum | AD | 4.30e-04 | -8.60e-01 | 0.0397 |
| 1112 | FOXN3 | HTA11_99999965104_69814 | Human | Colorectum | MSS | 3.61e-06 | 6.34e-01 | 0.281 |
| 1112 | FOXN3 | HTA11_99999971662_82457 | Human | Colorectum | MSS | 2.52e-12 | -5.49e-01 | 0.3859 |
| 1112 | FOXN3 | HTA11_99999973899_84307 | Human | Colorectum | MSS | 8.25e-12 | -7.31e-01 | 0.2585 |
| 1112 | FOXN3 | HTA11_99999974143_84620 | Human | Colorectum | MSS | 3.14e-06 | -3.93e-01 | 0.3005 |
| 1112 | FOXN3 | F007 | Human | Colorectum | FAP | 2.86e-02 | -2.18e-01 | 0.1176 |
| 1112 | FOXN3 | A001-C-207 | Human | Colorectum | FAP | 9.03e-07 | -3.58e-01 | 0.1278 |
| 1112 | FOXN3 | A015-C-203 | Human | Colorectum | FAP | 9.09e-38 | -5.66e-01 | -0.1294 |
| 1112 | FOXN3 | A015-C-204 | Human | Colorectum | FAP | 9.44e-13 | -5.31e-01 | -0.0228 |
| 1112 | FOXN3 | A014-C-040 | Human | Colorectum | FAP | 1.65e-07 | -3.19e-01 | -0.1184 |
| 1112 | FOXN3 | A002-C-201 | Human | Colorectum | FAP | 3.18e-19 | -4.27e-01 | 0.0324 |
| 1112 | FOXN3 | A001-C-119 | Human | Colorectum | FAP | 2.39e-14 | -5.47e-01 | -0.1557 |
| Page: 1 2 3 4 5 6 7 8 9 10 11 12 13 |
| Tissue | Expression Dynamics | Abbreviation |
| Cervix |  | CC: Cervix cancer |
| HSIL_HPV: HPV-infected high-grade squamous intraepithelial lesions | ||
| N_HPV: HPV-infected normal cervix | ||
| Colorectum (GSE201348) |  | FAP: Familial adenomatous polyposis |
| CRC: Colorectal cancer | ||
| Colorectum (HTA11) |  | AD: Adenomas |
| SER: Sessile serrated lesions | ||
| MSI-H: Microsatellite-high colorectal cancer | ||
| MSS: Microsatellite stable colorectal cancer | ||
| Endometrium | 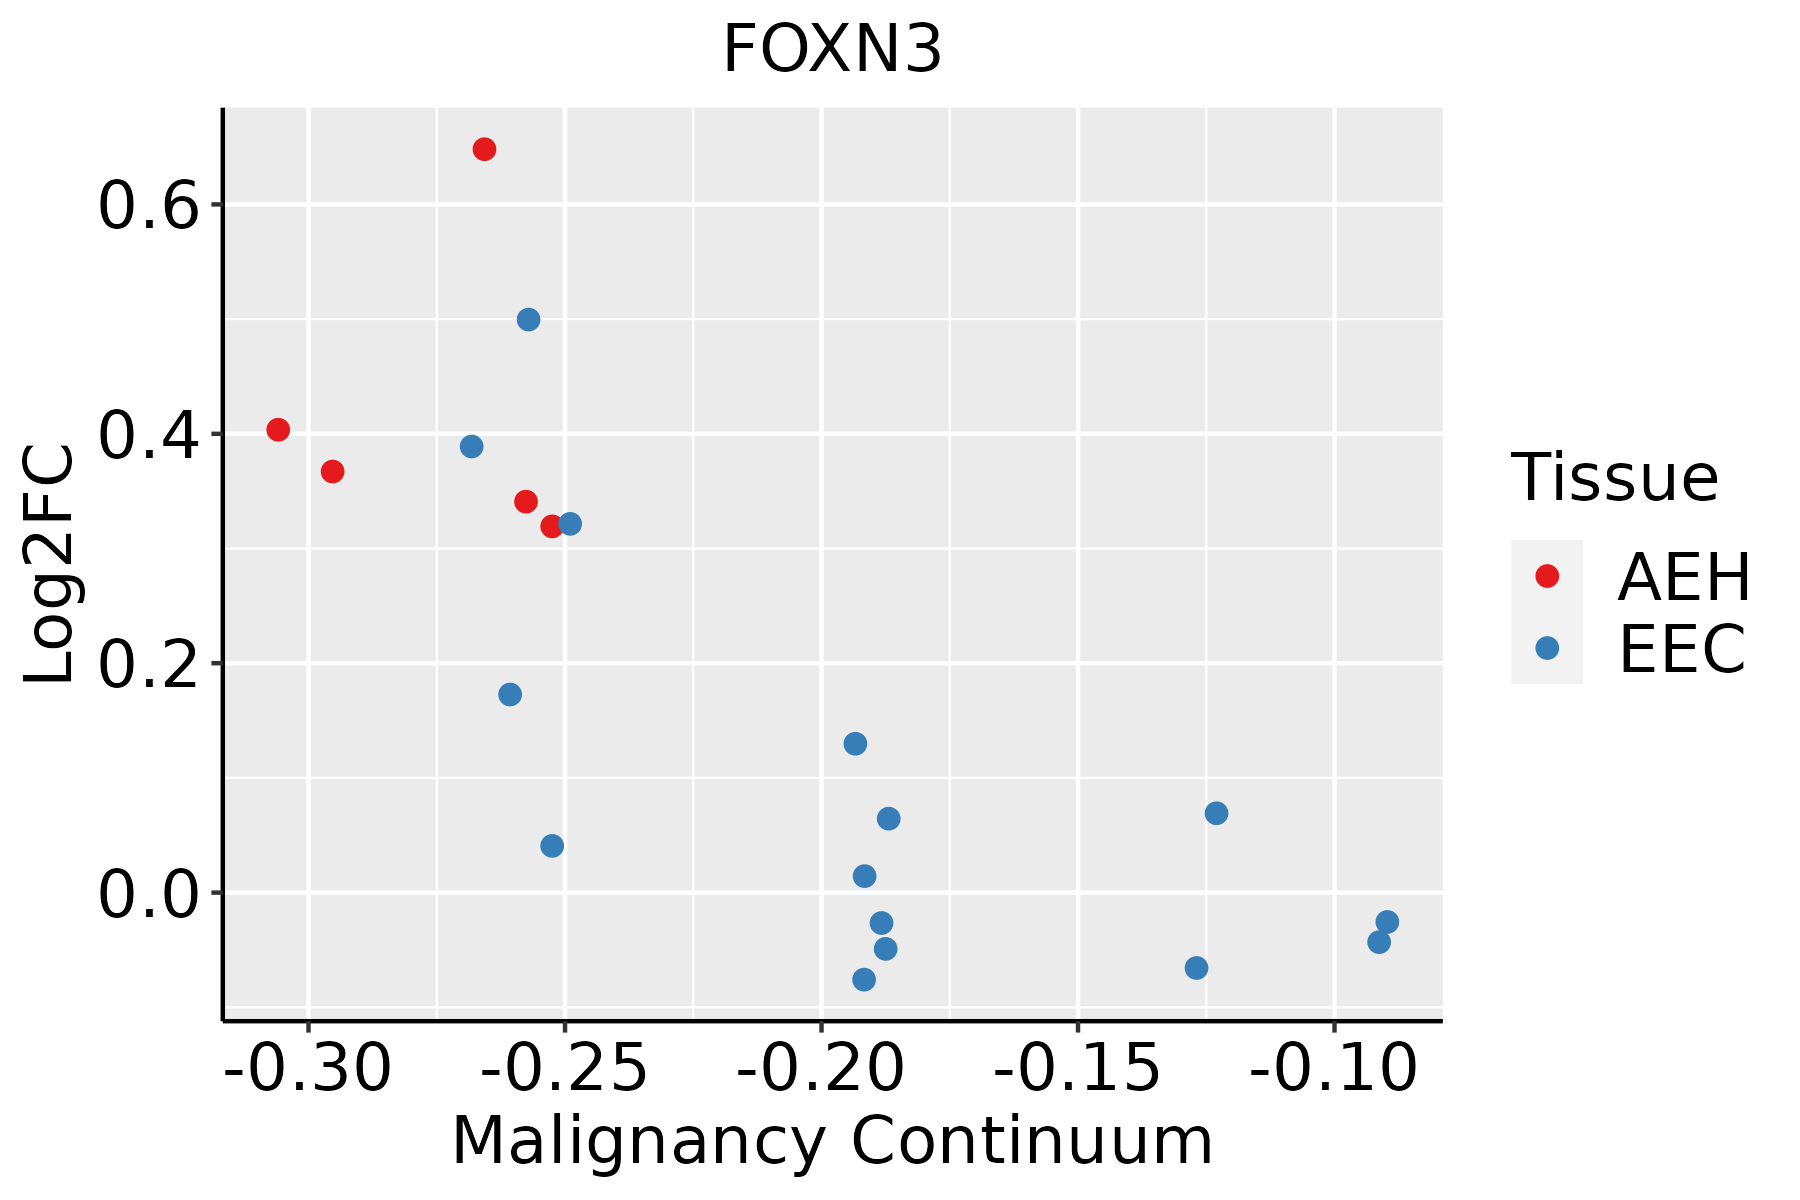 | AEH: Atypical endometrial hyperplasia |
| EEC: Endometrioid Cancer | ||
| Esophagus |  | ESCC: Esophageal squamous cell carcinoma |
| HGIN: High-grade intraepithelial neoplasias | ||
| LGIN: Low-grade intraepithelial neoplasias | ||
| GC | 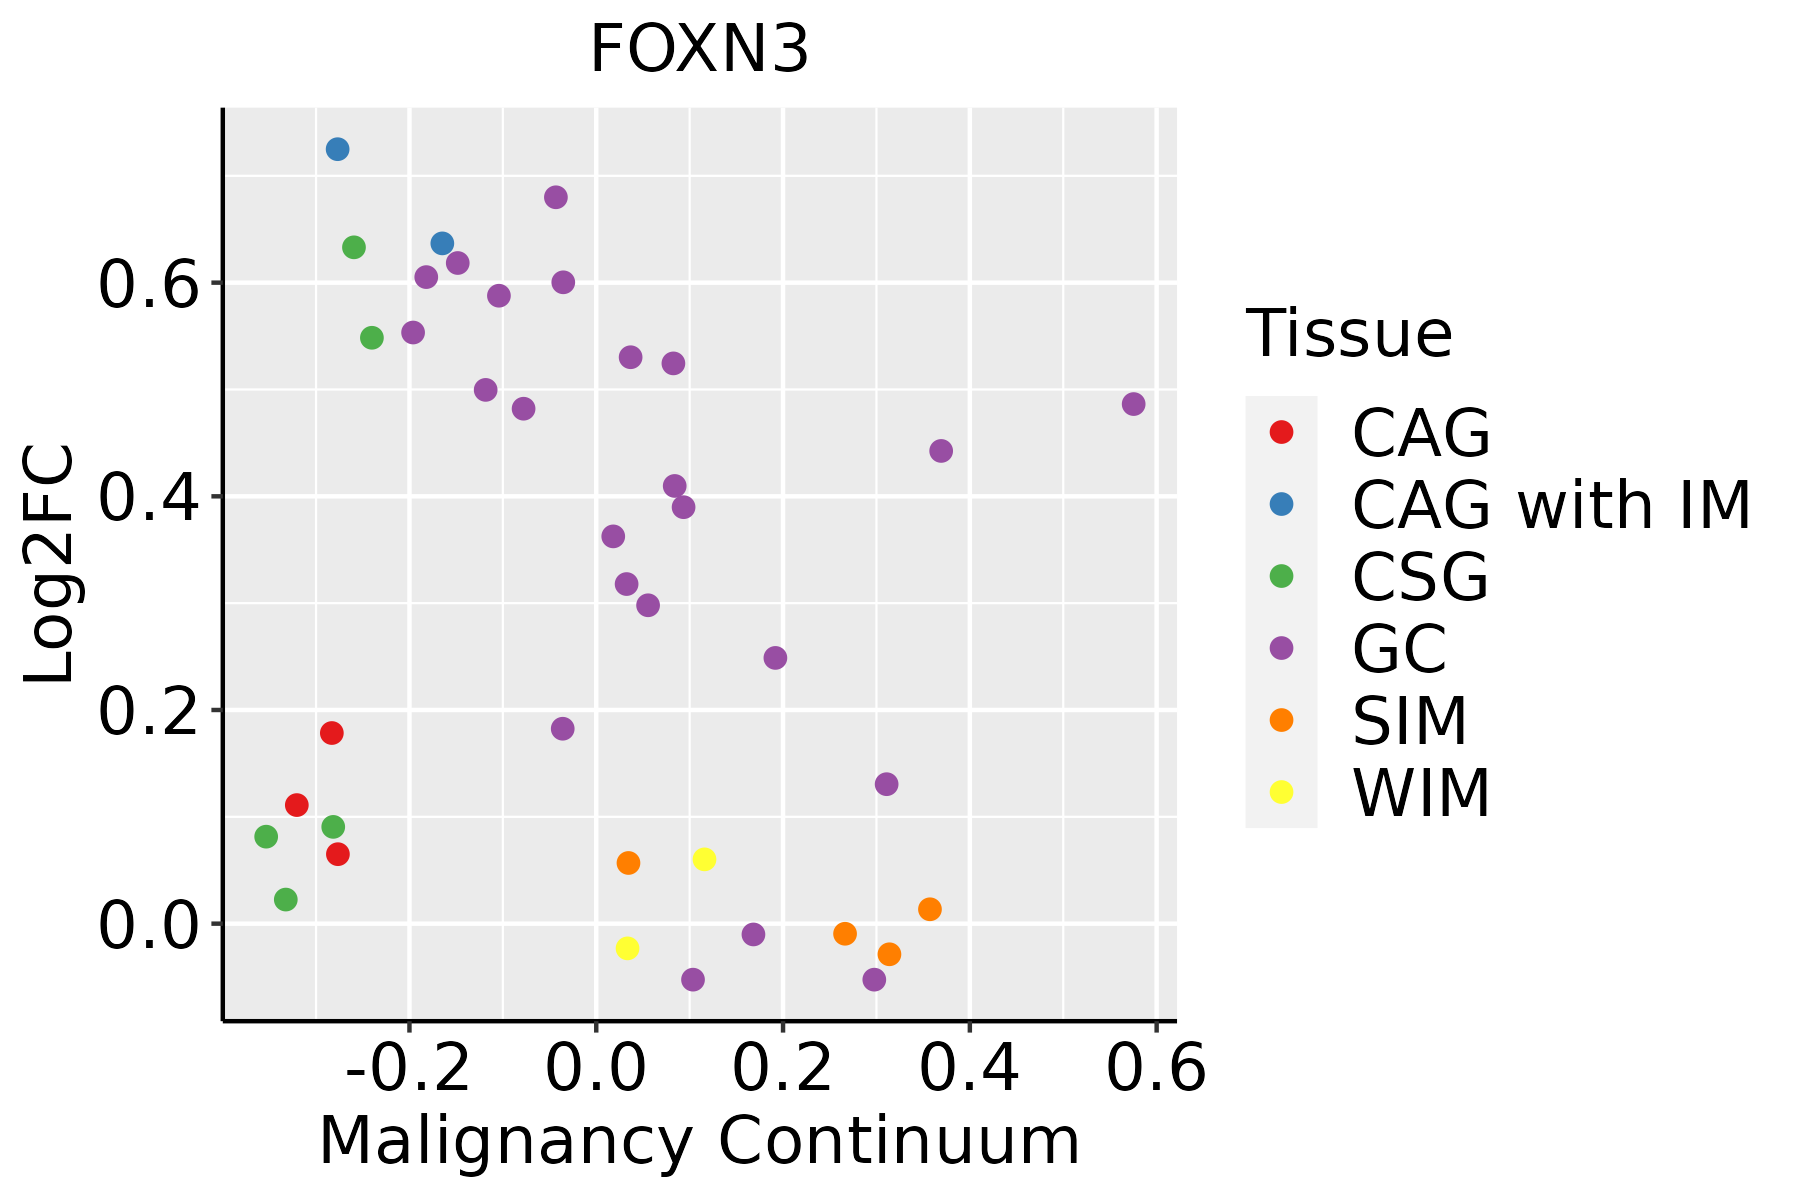 | CAG: Chronic atrophic gastritis |
| CAG with IM: Chronic atrophic gastritis with intestinal metaplasia | ||
| CSG: Chronic superficial gastritis | ||
| GC: Gastric cancer | ||
| SIM: Severe intestinal metaplasia | ||
| WIM: Wild intestinal metaplasia | ||
| Liver | 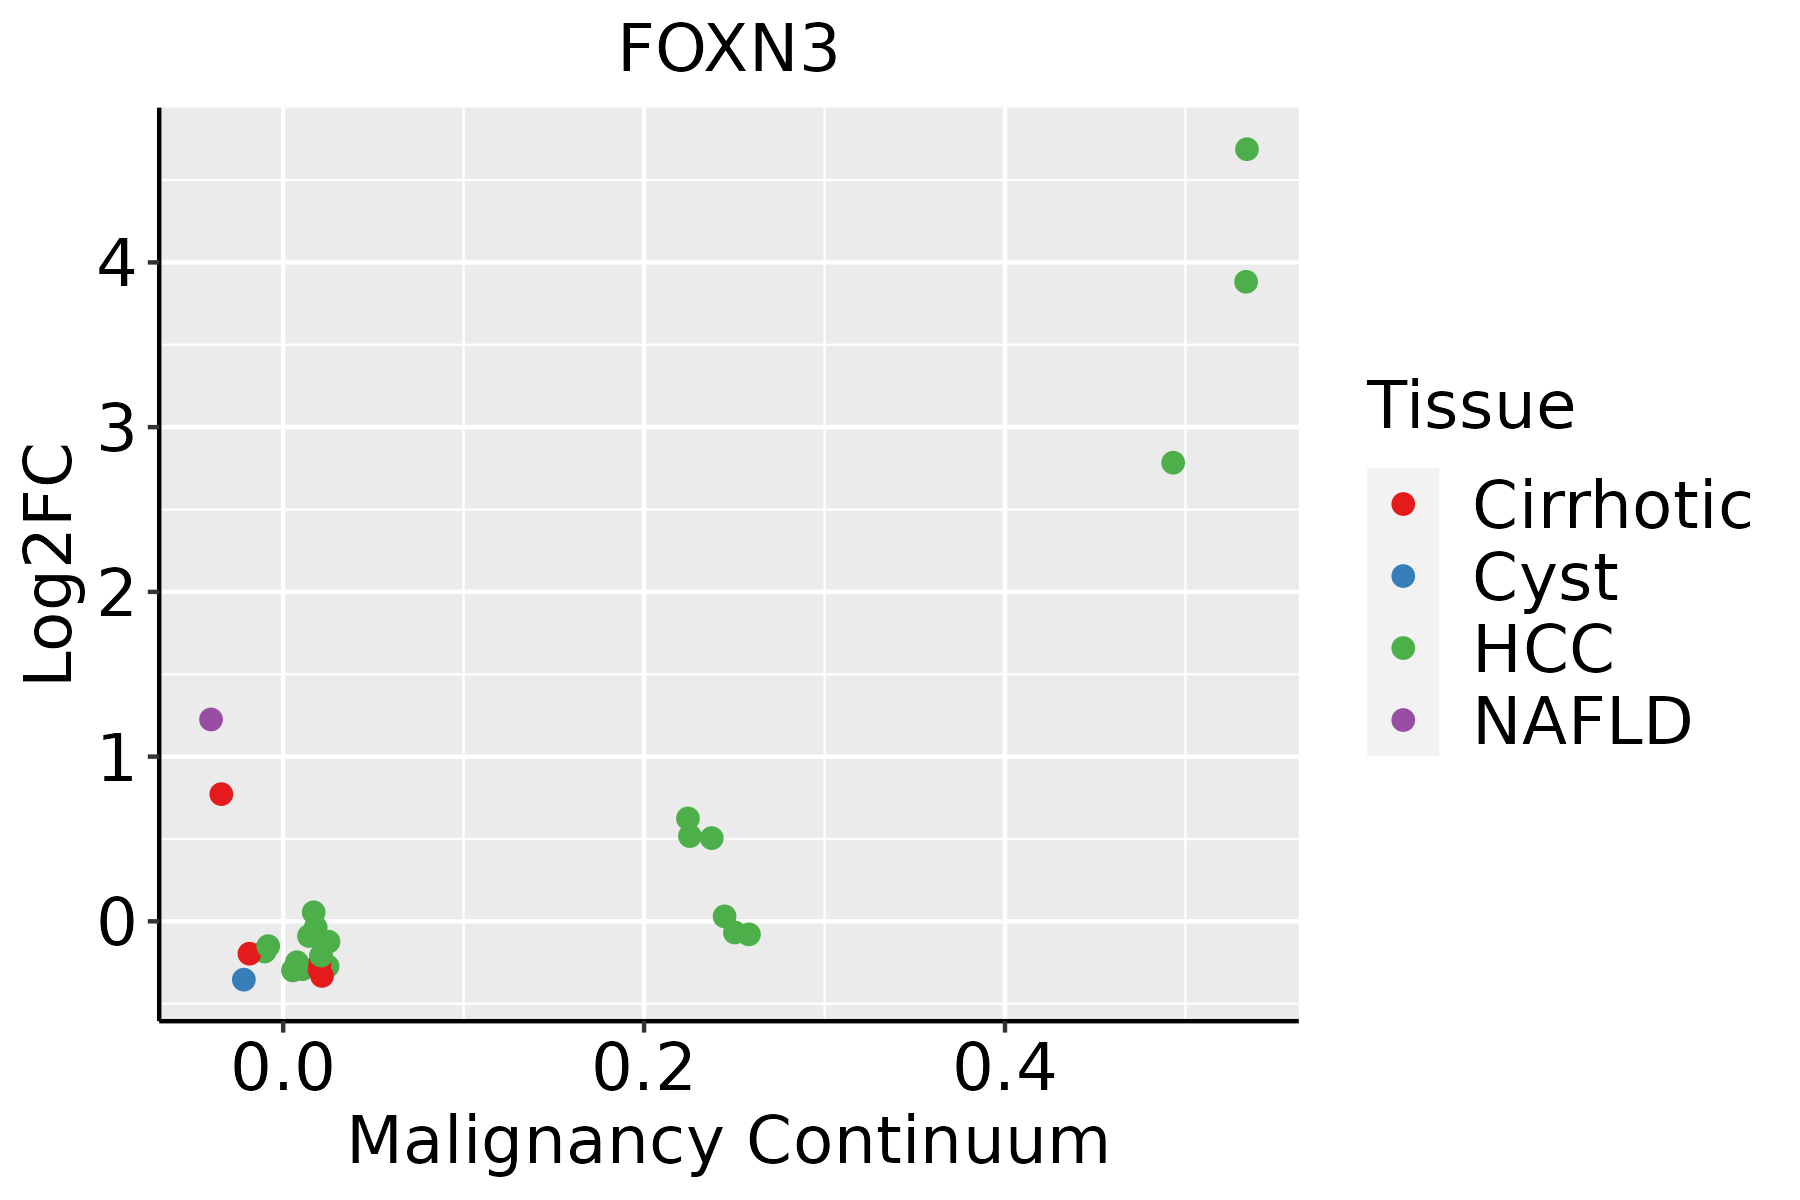 | HCC: Hepatocellular carcinoma |
| NAFLD: Non-alcoholic fatty liver disease | ||
| Lung |  | AAH: Atypical adenomatous hyperplasia |
| AIS: Adenocarcinoma in situ | ||
| IAC: Invasive lung adenocarcinoma | ||
| MIA: Minimally invasive adenocarcinoma | ||
| Oral Cavity | 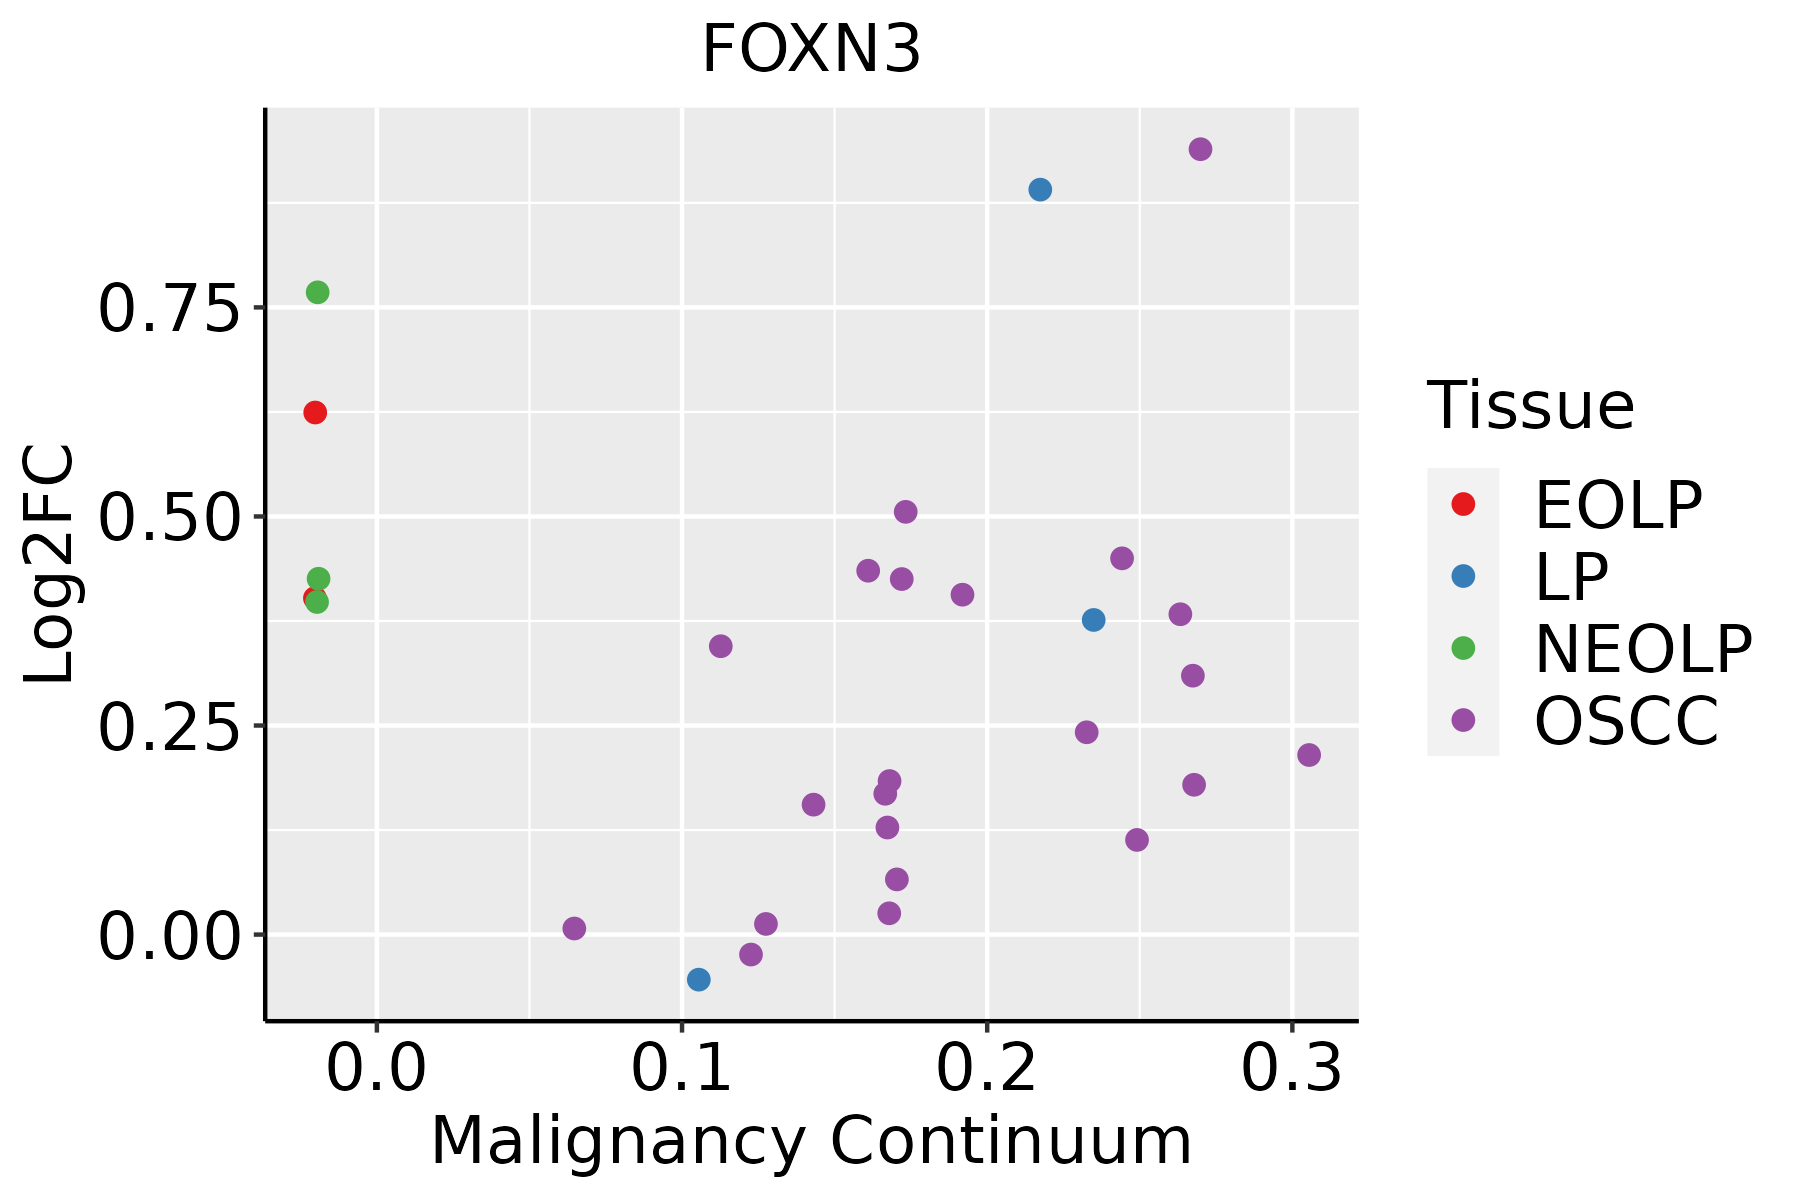 | EOLP: Erosive Oral lichen planus |
| LP: leukoplakia | ||
| NEOLP: Non-erosive oral lichen planus | ||
| OSCC: Oral squamous cell carcinoma | ||
| Prostate | 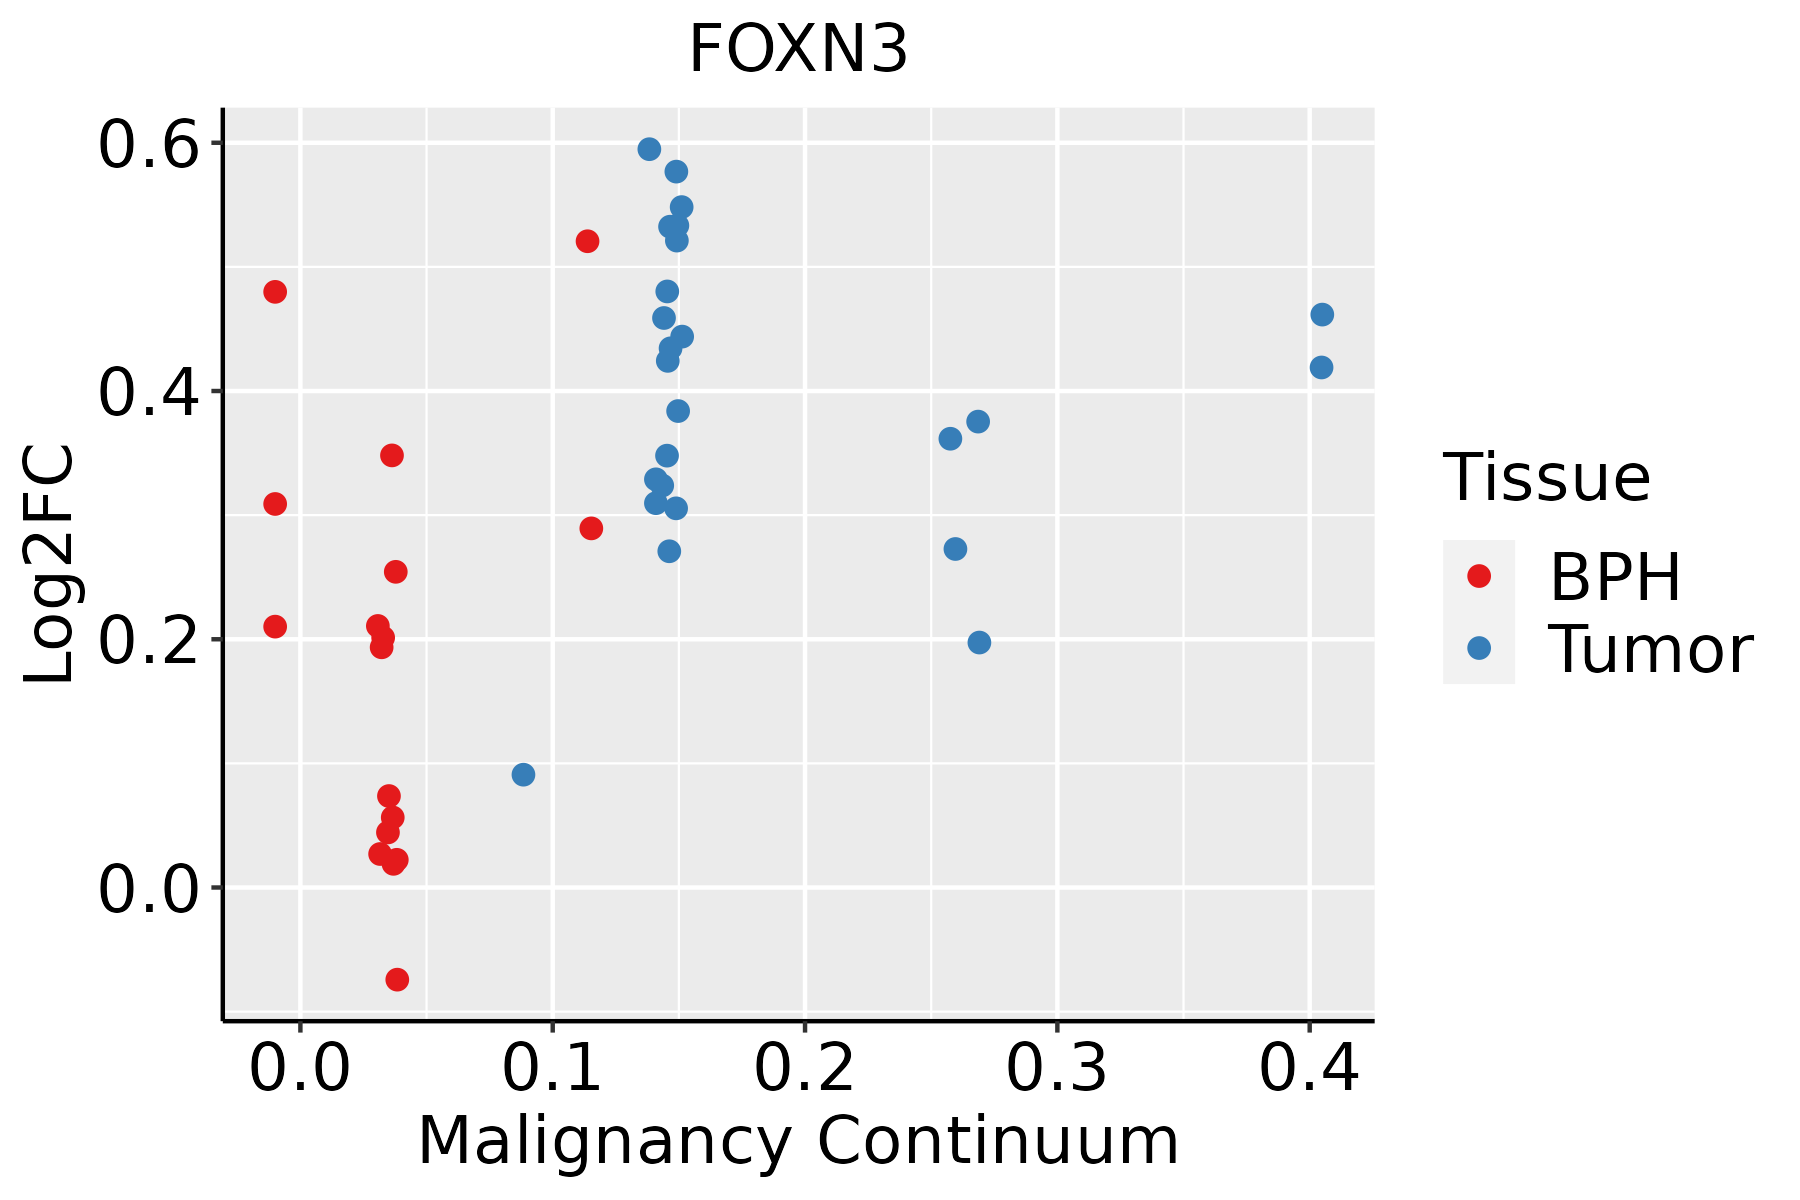 | BPH: Benign Prostatic Hyperplasia |
| Skin | 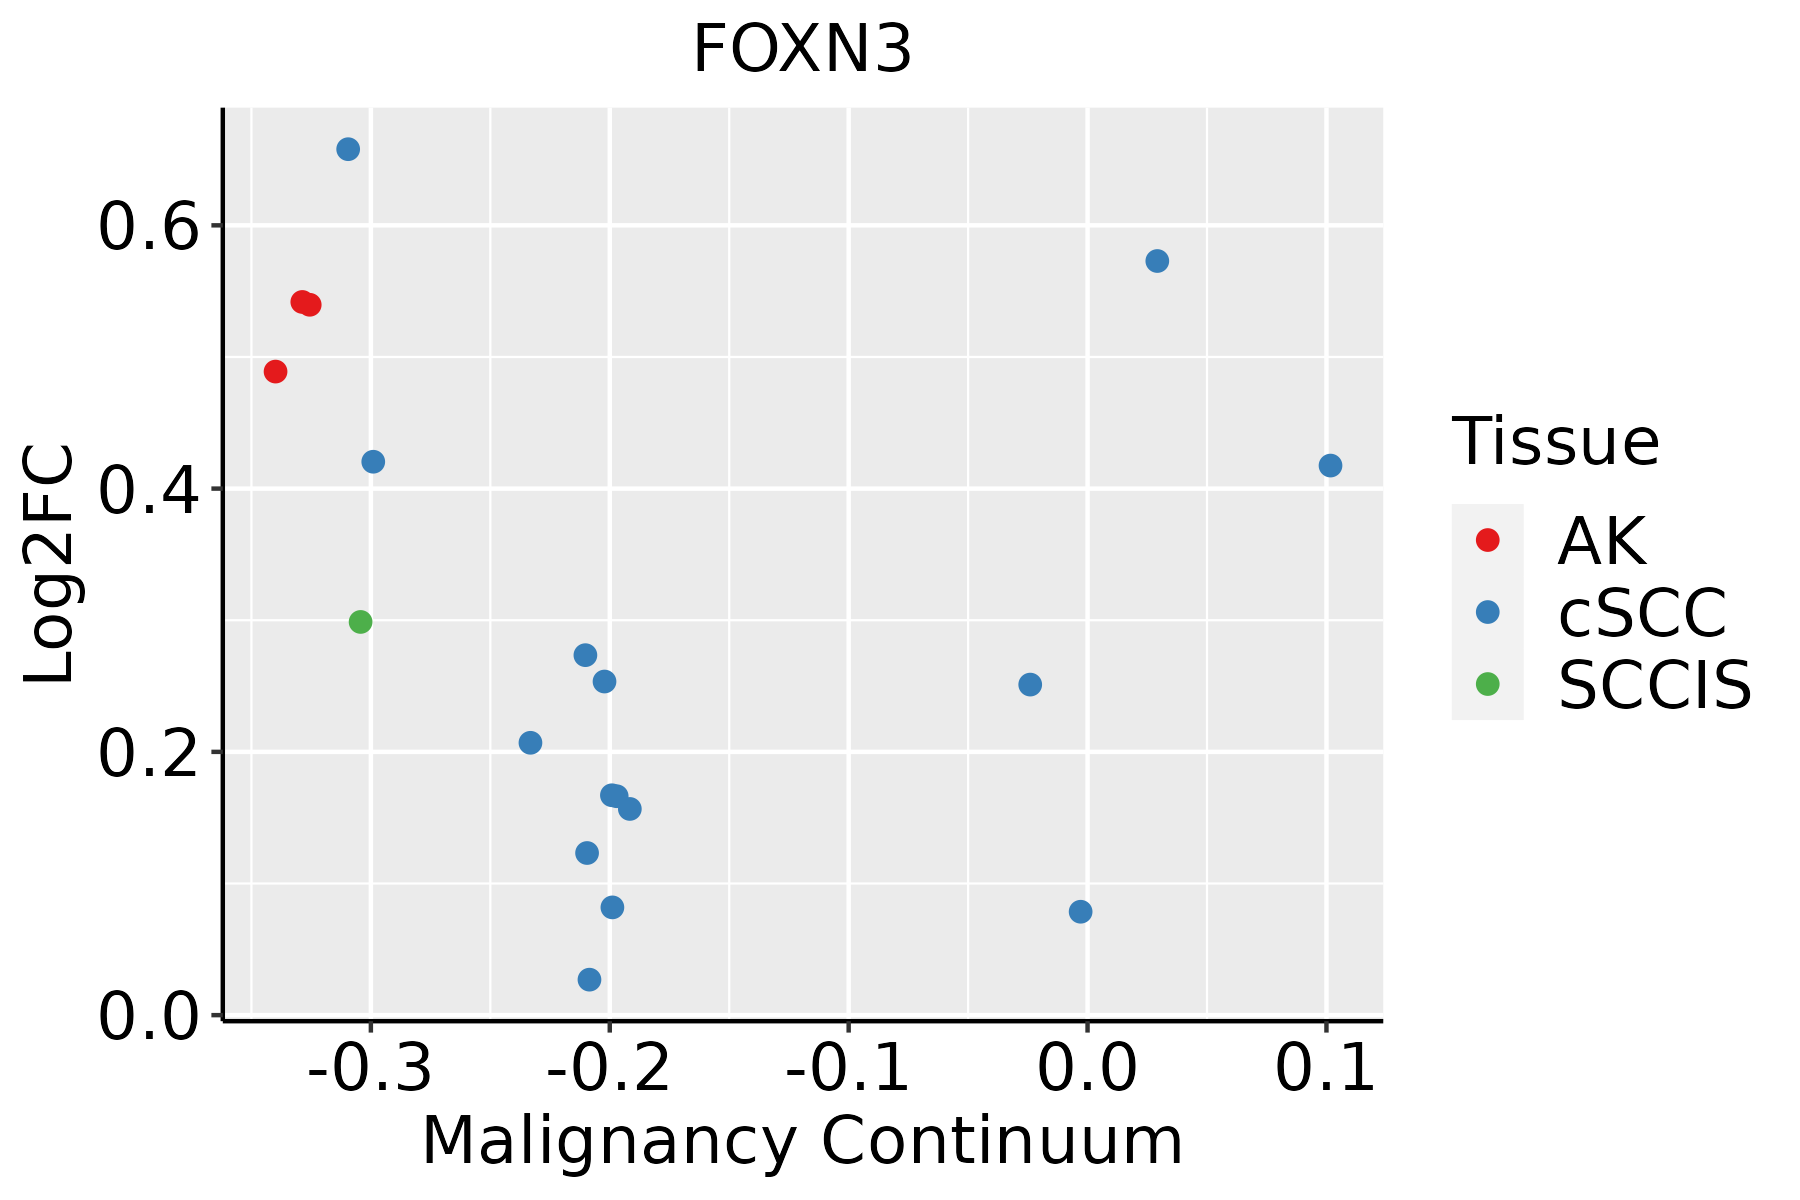 | AK: Actinic keratosis |
| cSCC: Cutaneous squamous cell carcinoma | ||
| SCCIS:squamous cell carcinoma in situ | ||
| Thyroid | 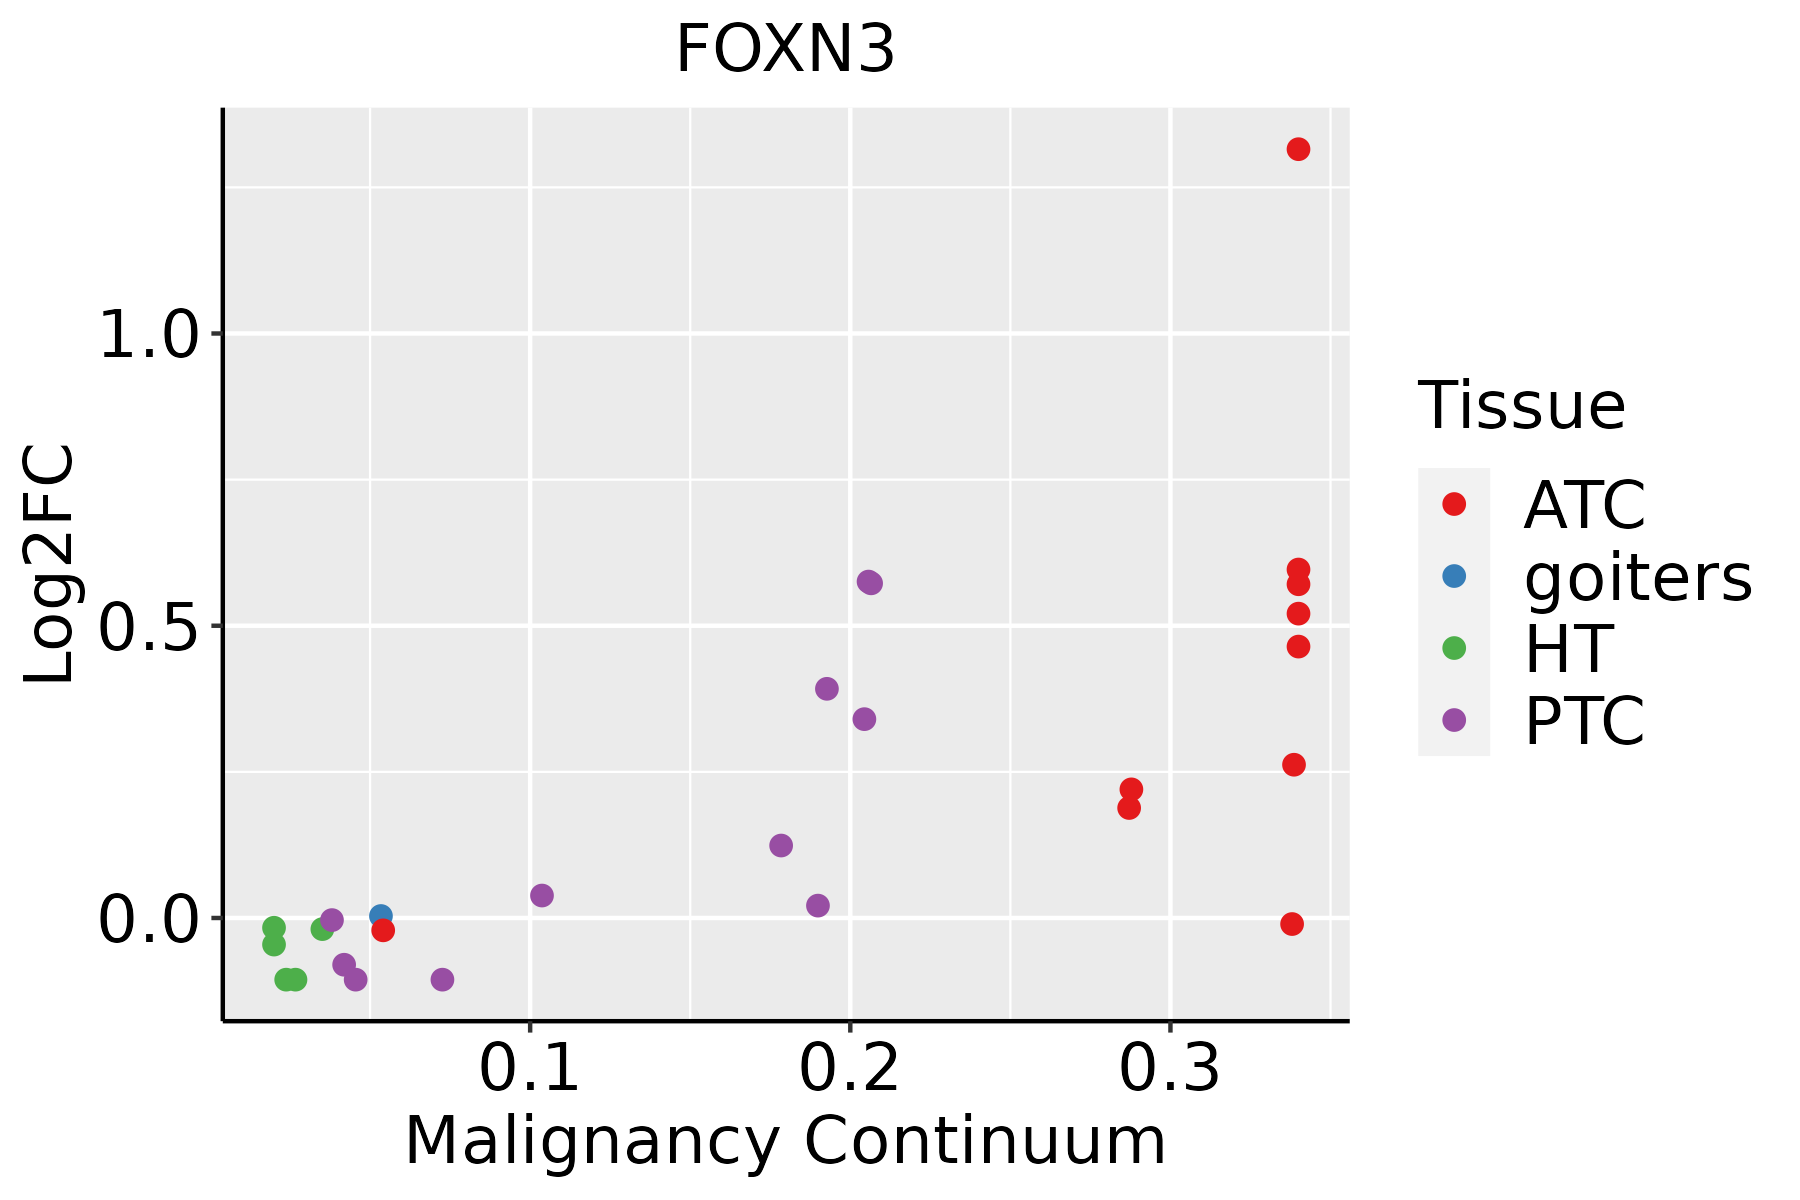 | ATC: Anaplastic thyroid cancer |
| HT: Hashimoto's thyroiditis | ||
| PTC: Papillary thyroid cancer |
| ∗log2FC in expression of this searched gene in stem-like cells from each diseased tissue sample relative to stem-like cells in normal samples in each tissue plotted against the malignancy continuum. Samples are colored based on if they are from different disease stage. |
Top |
Malignant transformation related pathway analysis |
| Find out the enriched GO biological processes and KEGG pathways involved in transition from healthy to precancer to cancer |
| Tissue | Disease Stage | Enriched GO biological Processes |
| Colorectum | AD |  |
| Colorectum | SER |  |
| Colorectum | MSS |  |
| Colorectum | MSI-H |  |
| Colorectum | FAP |  |
| ∗Top 15 enriched GO BP terms are showed in the bar plot of each disease state in each tissue. Each row represents a significant GO biological process which is colored according to the -log10(p.adjust). |
| Page: 1 2 3 4 5 6 7 8 9 |
| GO ID | Tissue | Disease Stage | Description | Gene Ratio | Bg Ratio | pvalue | p.adjust | Count |
| GO:00447725 | Cervix | CC | mitotic cell cycle phase transition | 89/2311 | 424/18723 | 2.70e-07 | 1.12e-05 | 89 |
| GO:00073466 | Cervix | CC | regulation of mitotic cell cycle | 88/2311 | 457/18723 | 1.26e-05 | 2.60e-04 | 88 |
| GO:19019903 | Cervix | CC | regulation of mitotic cell cycle phase transition | 63/2311 | 299/18723 | 1.27e-05 | 2.60e-04 | 63 |
| GO:19019873 | Cervix | CC | regulation of cell cycle phase transition | 74/2311 | 390/18723 | 9.80e-05 | 1.27e-03 | 74 |
| GO:00448392 | Cervix | CC | cell cycle G2/M phase transition | 31/2311 | 148/18723 | 2.07e-03 | 1.51e-02 | 31 |
| GO:00457862 | Cervix | CC | negative regulation of cell cycle | 67/2311 | 385/18723 | 2.21e-03 | 1.59e-02 | 67 |
| GO:00000862 | Cervix | CC | G2/M transition of mitotic cell cycle | 29/2311 | 137/18723 | 2.40e-03 | 1.70e-02 | 29 |
| GO:00459302 | Cervix | CC | negative regulation of mitotic cell cycle | 44/2311 | 235/18723 | 3.02e-03 | 1.99e-02 | 44 |
| GO:00427705 | Cervix | CC | signal transduction in response to DNA damage | 34/2311 | 172/18723 | 3.52e-03 | 2.27e-02 | 34 |
| GO:19019912 | Cervix | CC | negative regulation of mitotic cell cycle phase transition | 35/2311 | 179/18723 | 3.73e-03 | 2.38e-02 | 35 |
| GO:00109482 | Cervix | CC | negative regulation of cell cycle process | 51/2311 | 294/18723 | 7.35e-03 | 3.94e-02 | 51 |
| GO:0007346 | Colorectum | AD | regulation of mitotic cell cycle | 119/3918 | 457/18723 | 4.60e-03 | 3.14e-02 | 119 |
| GO:00073461 | Colorectum | MSS | regulation of mitotic cell cycle | 108/3467 | 457/18723 | 3.30e-03 | 2.50e-02 | 108 |
| GO:00073462 | Colorectum | FAP | regulation of mitotic cell cycle | 85/2622 | 457/18723 | 3.41e-03 | 2.48e-02 | 85 |
| GO:0060348 | Colorectum | CRC | bone development | 37/2078 | 205/18723 | 1.96e-03 | 1.96e-02 | 37 |
| GO:0048705 | Colorectum | CRC | skeletal system morphogenesis | 37/2078 | 220/18723 | 6.58e-03 | 4.71e-02 | 37 |
| GO:00447726 | Endometrium | AEH | mitotic cell cycle phase transition | 67/2100 | 424/18723 | 2.37e-03 | 1.78e-02 | 67 |
| GO:004477213 | Endometrium | EEC | mitotic cell cycle phase transition | 71/2168 | 424/18723 | 8.68e-04 | 7.97e-03 | 71 |
| GO:00073467 | Endometrium | EEC | regulation of mitotic cell cycle | 70/2168 | 457/18723 | 8.76e-03 | 4.74e-02 | 70 |
| GO:000734610 | Esophagus | HGIN | regulation of mitotic cell cycle | 98/2587 | 457/18723 | 4.39e-06 | 1.42e-04 | 98 |
| Page: 1 2 3 4 5 6 7 8 9 10 11 12 13 14 |
| Pathway ID | Tissue | Disease Stage | Description | Gene Ratio | Bg Ratio | pvalue | p.adjust | qvalue | Count |
| Page: 1 |
Top |
Cell-cell communication analysis |
| Identification of potential cell-cell interactions between two cell types and their ligand-receptor pairs for different disease states |
| Ligand | Receptor | LRpair | Pathway | Tissue | Disease Stage |
| Page: 1 |
Top |
Single-cell gene regulatory network inference analysis |
| Find out the significant the regulons (TFs) and the target genes of each regulon across cell types for different disease states |
| TF | Cell Type | Tissue | Disease Stage | Target Gene | RSS | Regulon Activity |
| FOXN3 | BMEM | Endometrium | EEC | PTPRJ,LPP,SKAP1, etc. | 1.35e-01 |  |
| FOXN3 | CD8TEXP | Endometrium | EEC | PTPRJ,LPP,SKAP1, etc. | 1.23e-01 | |
| FOXN3 | BMEM | Endometrium | Healthy | PTPRJ,LPP,SKAP1, etc. | 1.50e-01 |  |
| FOXN3 | CLUB | Lung | AAH | BMPR1B,AP003064.2,RIMS1, etc. | 2.73e-01 |  |
| FOXN3 | CLUB | Lung | ADJ | BMPR1B,AP003064.2,RIMS1, etc. | 3.41e-01 |  |
| FOXN3 | CD4TN | Lung | AIS | UTRN,JAZF1,PTPRJ, etc. | 2.13e-01 |  |
| ∗The dot plots of a searched regulon are shown for all cell subpopulations in each disease state of each tissue based on the regulon specific score inferred using pySCENIC and by calculating the average expression. |
| Page: 1 |
Top |
Somatic mutation of malignant transformation related genes |
| Annotation of somatic variants for genes involved in malignant transformation |
| Hugo Symbol | Variant Class | Variant Classification | dbSNP RS | HGVSc | HGVSp | HGVSp Short | SWISSPROT | BIOTYPE | SIFT | PolyPhen | Tumor Sample Barcode | Tissue | Histology | Sex | Age | Stage | Therapy Types | Drugs | Outcome |
| FOXN3 | SNV | Missense_Mutation | c.1082N>T | p.Ser361Leu | p.S361L | O00409 | protein_coding | tolerated(0.08) | benign(0.003) | TCGA-AR-A0TX-01 | Breast | breast invasive carcinoma | Female | <65 | I/II | Unknown | Unknown | SD | |
| FOXN3 | SNV | Missense_Mutation | rs759916715 | c.1154G>A | p.Arg385Gln | p.R385Q | O00409 | protein_coding | tolerated(0.76) | benign(0) | TCGA-AR-A0U2-01 | Breast | breast invasive carcinoma | Female | <65 | III/IV | Hormone Therapy | tamoxiphen | PD |
| FOXN3 | SNV | Missense_Mutation | c.296N>T | p.Ala99Val | p.A99V | O00409 | protein_coding | tolerated(0.1) | benign(0.071) | TCGA-C8-A1HI-01 | Breast | breast invasive carcinoma | Female | <65 | III/IV | Unknown | Unknown | SD | |
| FOXN3 | insertion | Frame_Shift_Ins | novel | c.328_329insGATTGACAACAACGCTCACCCTCAGCACTTC | p.Asn110ArgfsTer71 | p.N110Rfs*71 | O00409 | protein_coding | TCGA-AO-A03R-01 | Breast | breast invasive carcinoma | Female | <65 | I/II | Chemotherapy | doxorubicin | SD | ||
| FOXN3 | SNV | Missense_Mutation | c.1261N>T | p.Arg421Cys | p.R421C | O00409 | protein_coding | tolerated(0.08) | possibly_damaging(0.65) | TCGA-2W-A8YY-01 | Cervix | cervical & endocervical cancer | Female | <65 | I/II | Chemotherapy | cisplatin | CR | |
| FOXN3 | SNV | Missense_Mutation | rs142179906 | c.874N>T | p.Arg292Trp | p.R292W | O00409 | protein_coding | tolerated(0.06) | benign(0.011) | TCGA-EA-A5FO-01 | Cervix | cervical & endocervical cancer | Female | <65 | I/II | Unknown | Unknown | SD |
| FOXN3 | SNV | Missense_Mutation | novel | c.485N>C | p.Val162Ala | p.V162A | O00409 | protein_coding | deleterious(0) | probably_damaging(0.994) | TCGA-VS-A94Z-01 | Cervix | cervical & endocervical cancer | Female | <65 | I/II | Chemotherapy | cisplatin | CR |
| FOXN3 | SNV | Missense_Mutation | rs754903884 | c.1174G>A | p.Asp392Asn | p.D392N | O00409 | protein_coding | deleterious(0.03) | benign(0.239) | TCGA-A6-6653-01 | Colorectum | colon adenocarcinoma | Male | >=65 | I/II | Unknown | Unknown | SD |
| FOXN3 | SNV | Missense_Mutation | rs199923188 | c.1306C>T | p.Pro436Ser | p.P436S | O00409 | protein_coding | deleterious(0.04) | probably_damaging(0.936) | TCGA-AA-3663-01 | Colorectum | colon adenocarcinoma | Male | <65 | I/II | Unknown | Unknown | SD |
| FOXN3 | SNV | Missense_Mutation | c.1397N>C | p.Ile466Thr | p.I466T | O00409 | protein_coding | deleterious(0) | possibly_damaging(0.604) | TCGA-AA-3672-01 | Colorectum | colon adenocarcinoma | Female | >=65 | III/IV | Unknown | Unknown | SD |
| Page: 1 2 3 4 5 6 7 |
Top |
Related drugs of malignant transformation related genes |
| Identification of chemicals and drugs interact with genes involved in malignant transfromation |
| (DGIdb 4.0) |
| Entrez ID | Symbol | Category | Interaction Types | Drug Claim Name | Drug Name | PMIDs |
| Page: 1 |

Copyright 2023-Present -The University of Texas Health Science Center at Houston |