
|
|||||
|
 | |
| |
| |
| |
| |
| |
|
Gene: FOXK2 |
Gene summary for FOXK2 |
| Gene information | Species | Human | Gene symbol | FOXK2 | Gene ID | 3607 |
| Gene name | forkhead box K2 | |
| Gene Alias | ILF | |
| Cytomap | 17q25.3 | |
| Gene Type | protein-coding | GO ID | GO:0000122 | UniProtAcc | Q01167 |
Top |
Malignant transformation analysis |
| Identification of the aberrant gene expression in precancerous and cancerous lesions by comparing the gene expression of stem-like cells in diseased tissues with normal stem cells |
| Entrez ID | Symbol | Replicates | Species | Organ | Tissue | Adj P-value | Log2FC | Malignancy |
| 3607 | FOXK2 | CCI_1 | Human | Cervix | CC | 2.74e-07 | 7.44e-01 | 0.528 |
| 3607 | FOXK2 | CCI_2 | Human | Cervix | CC | 5.96e-14 | 1.13e+00 | 0.5249 |
| 3607 | FOXK2 | CCI_3 | Human | Cervix | CC | 6.95e-14 | 8.66e-01 | 0.516 |
| 3607 | FOXK2 | HTA11_3410_2000001011 | Human | Colorectum | AD | 1.56e-05 | -3.67e-01 | 0.0155 |
| 3607 | FOXK2 | F007 | Human | Colorectum | FAP | 5.81e-05 | -3.73e-01 | 0.1176 |
| 3607 | FOXK2 | A002-C-010 | Human | Colorectum | FAP | 4.50e-04 | -2.50e-01 | 0.242 |
| 3607 | FOXK2 | A001-C-207 | Human | Colorectum | FAP | 1.30e-05 | -3.17e-01 | 0.1278 |
| 3607 | FOXK2 | A015-C-203 | Human | Colorectum | FAP | 3.64e-30 | -3.89e-01 | -0.1294 |
| 3607 | FOXK2 | A015-C-204 | Human | Colorectum | FAP | 6.57e-09 | -3.86e-01 | -0.0228 |
| 3607 | FOXK2 | A014-C-040 | Human | Colorectum | FAP | 3.08e-06 | -5.23e-01 | -0.1184 |
| 3607 | FOXK2 | A002-C-201 | Human | Colorectum | FAP | 7.00e-18 | -2.77e-01 | 0.0324 |
| 3607 | FOXK2 | A002-C-203 | Human | Colorectum | FAP | 9.70e-09 | -2.88e-01 | 0.2786 |
| 3607 | FOXK2 | A001-C-119 | Human | Colorectum | FAP | 1.71e-04 | -2.16e-01 | -0.1557 |
| 3607 | FOXK2 | A001-C-108 | Human | Colorectum | FAP | 4.56e-18 | -2.23e-01 | -0.0272 |
| 3607 | FOXK2 | A002-C-205 | Human | Colorectum | FAP | 4.06e-24 | -4.04e-01 | -0.1236 |
| 3607 | FOXK2 | A001-C-104 | Human | Colorectum | FAP | 2.20e-07 | -1.78e-01 | 0.0184 |
| 3607 | FOXK2 | A015-C-005 | Human | Colorectum | FAP | 1.94e-06 | -3.05e-01 | -0.0336 |
| 3607 | FOXK2 | A015-C-006 | Human | Colorectum | FAP | 3.08e-17 | -3.49e-01 | -0.0994 |
| 3607 | FOXK2 | A015-C-106 | Human | Colorectum | FAP | 2.59e-12 | -2.40e-01 | -0.0511 |
| 3607 | FOXK2 | A002-C-114 | Human | Colorectum | FAP | 2.67e-20 | -3.59e-01 | -0.1561 |
| Page: 1 2 3 4 5 6 7 |
| Tissue | Expression Dynamics | Abbreviation |
| Cervix | 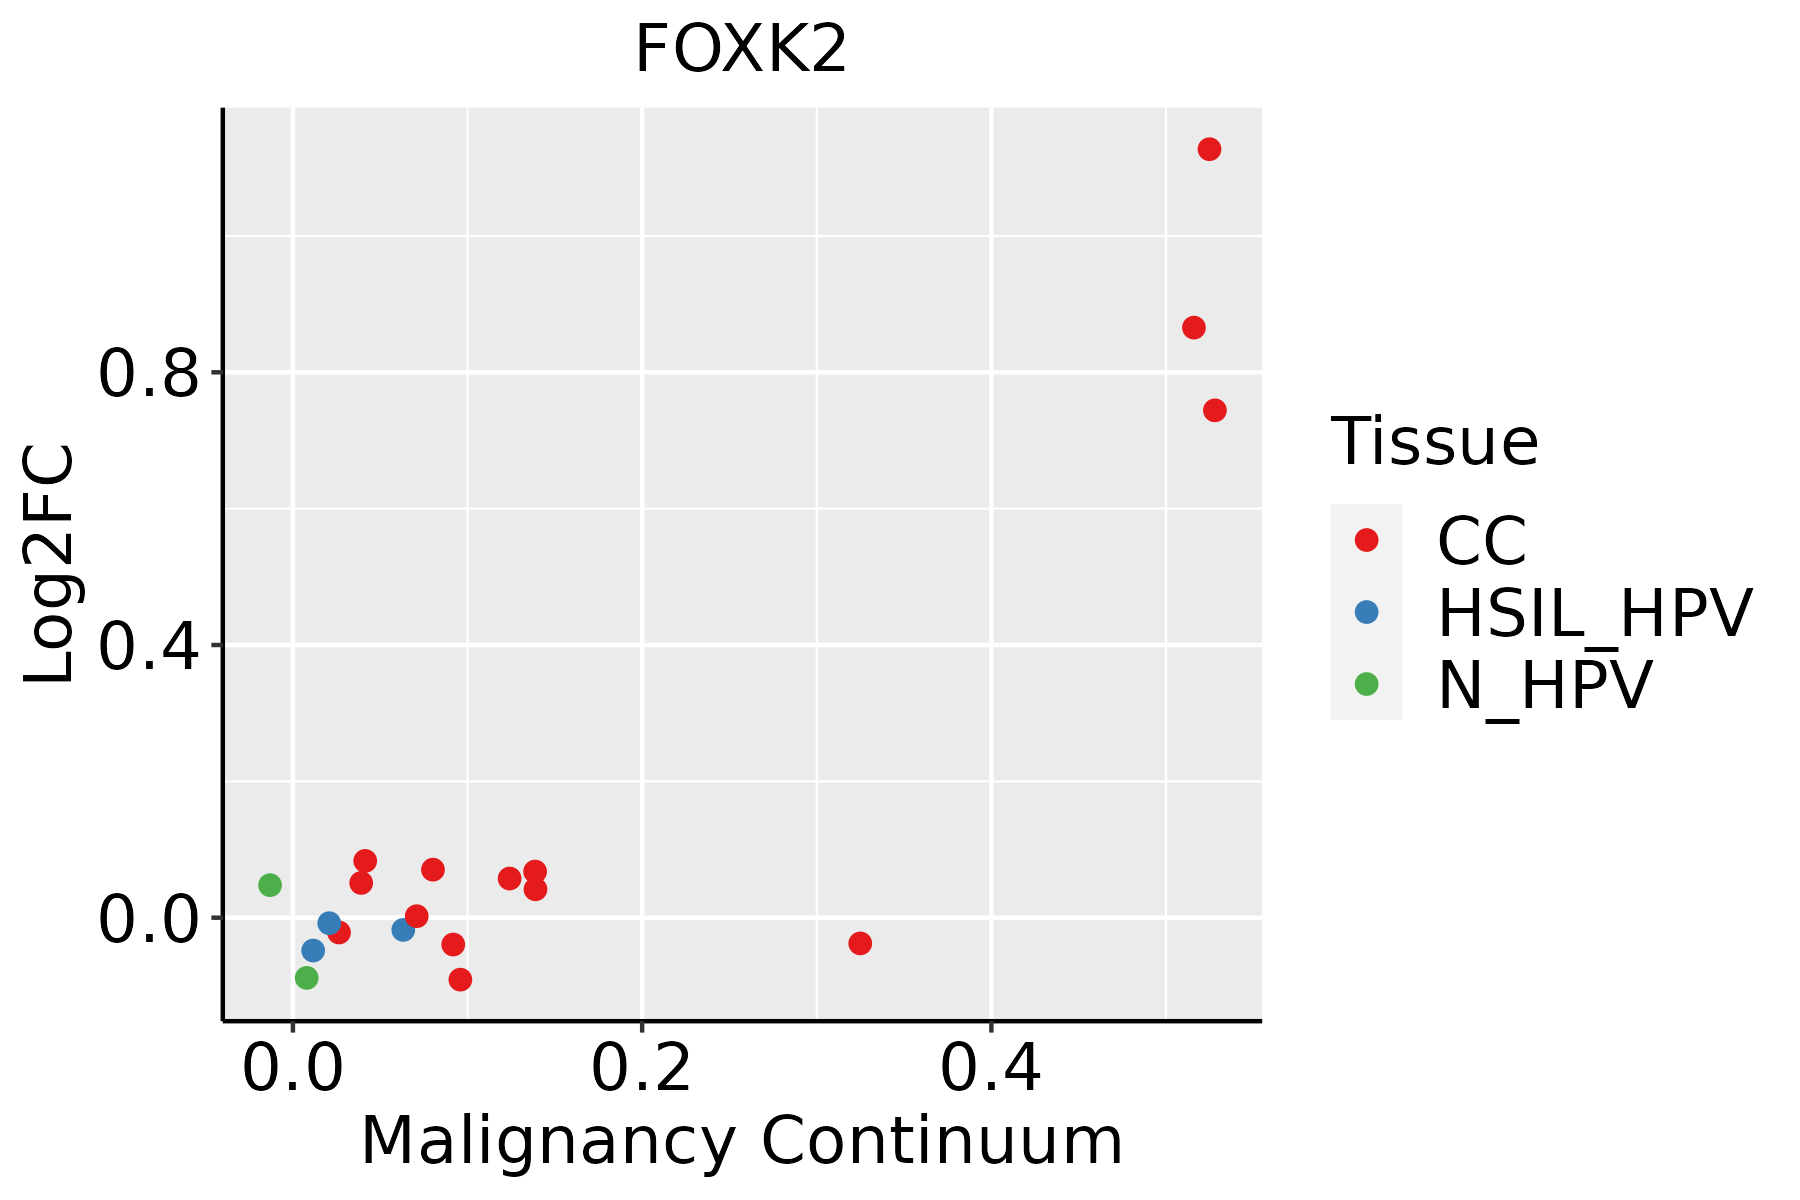 | CC: Cervix cancer |
| HSIL_HPV: HPV-infected high-grade squamous intraepithelial lesions | ||
| N_HPV: HPV-infected normal cervix | ||
| Colorectum (GSE201348) |  | FAP: Familial adenomatous polyposis |
| CRC: Colorectal cancer | ||
| Colorectum (HTA11) | 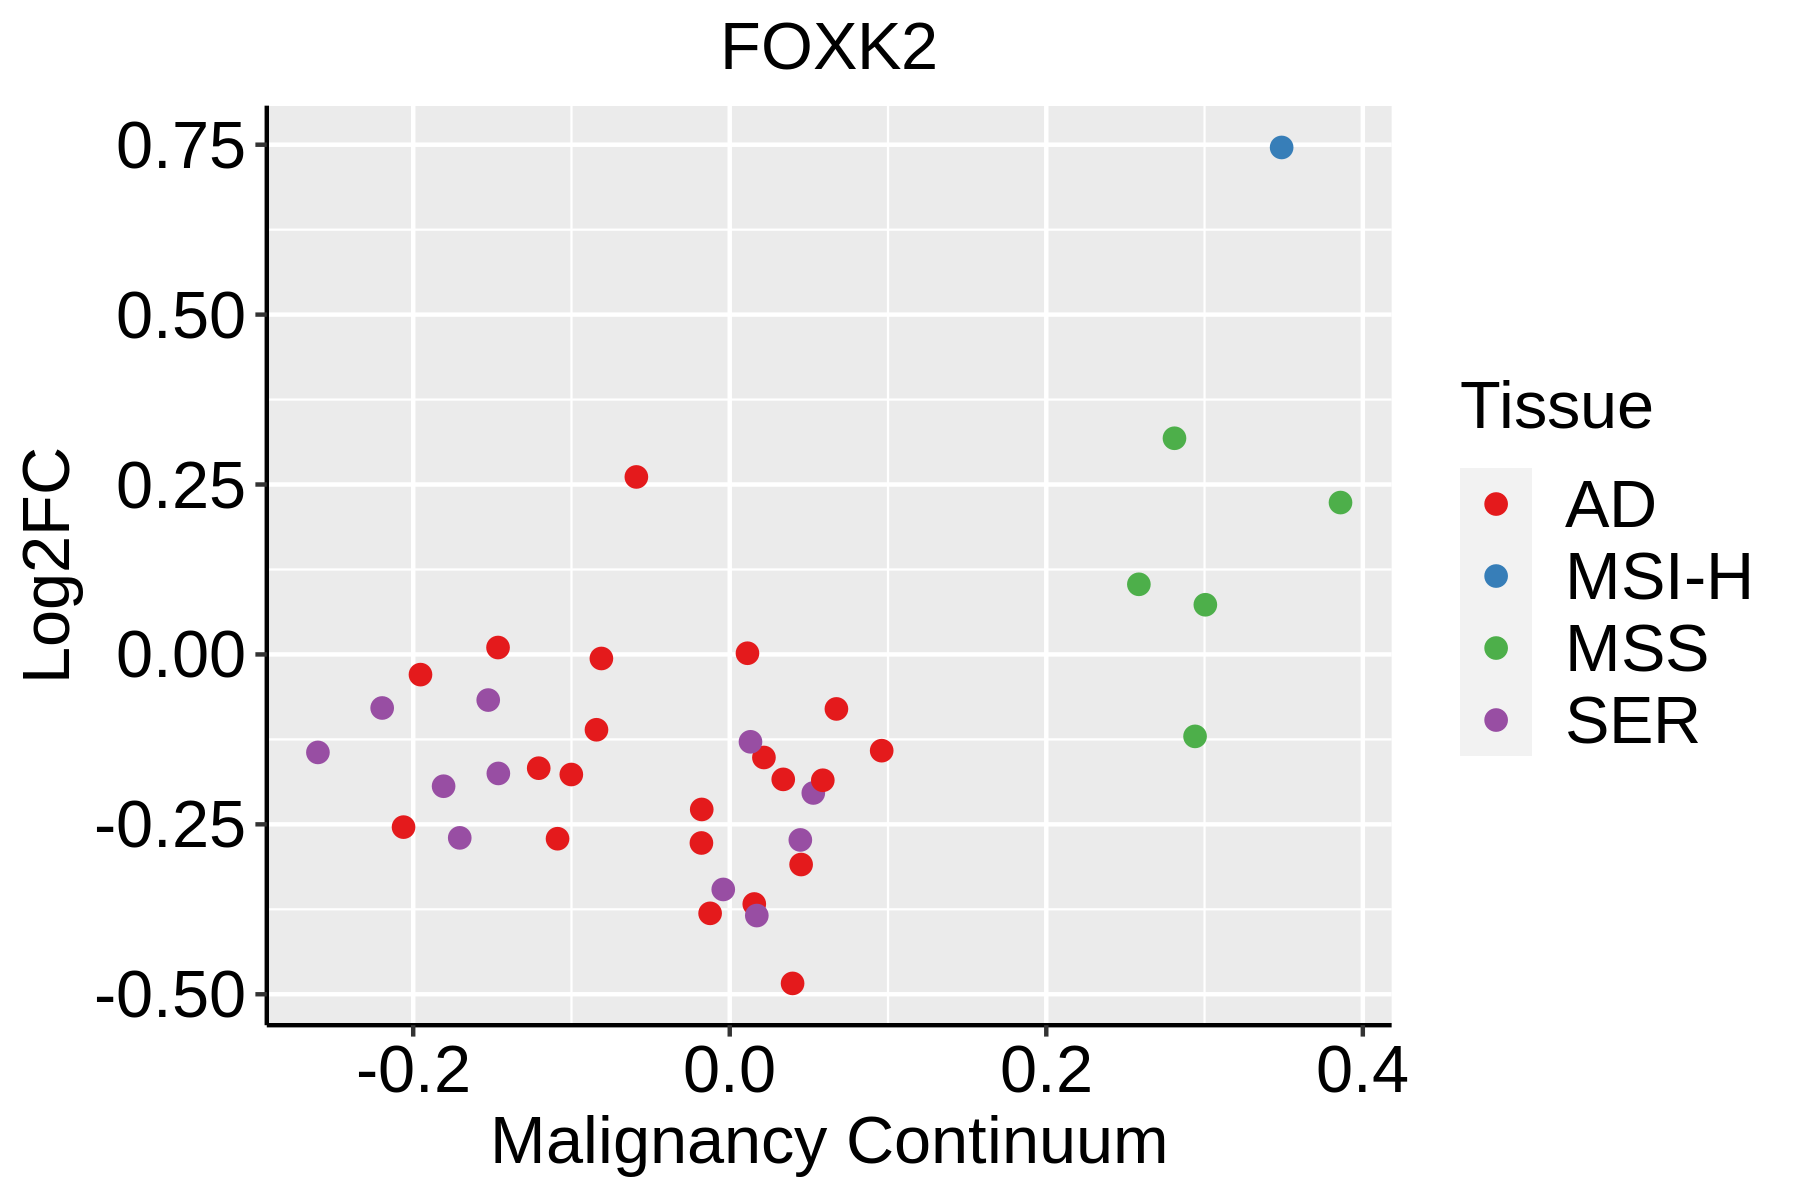 | AD: Adenomas |
| SER: Sessile serrated lesions | ||
| MSI-H: Microsatellite-high colorectal cancer | ||
| MSS: Microsatellite stable colorectal cancer | ||
| Endometrium | 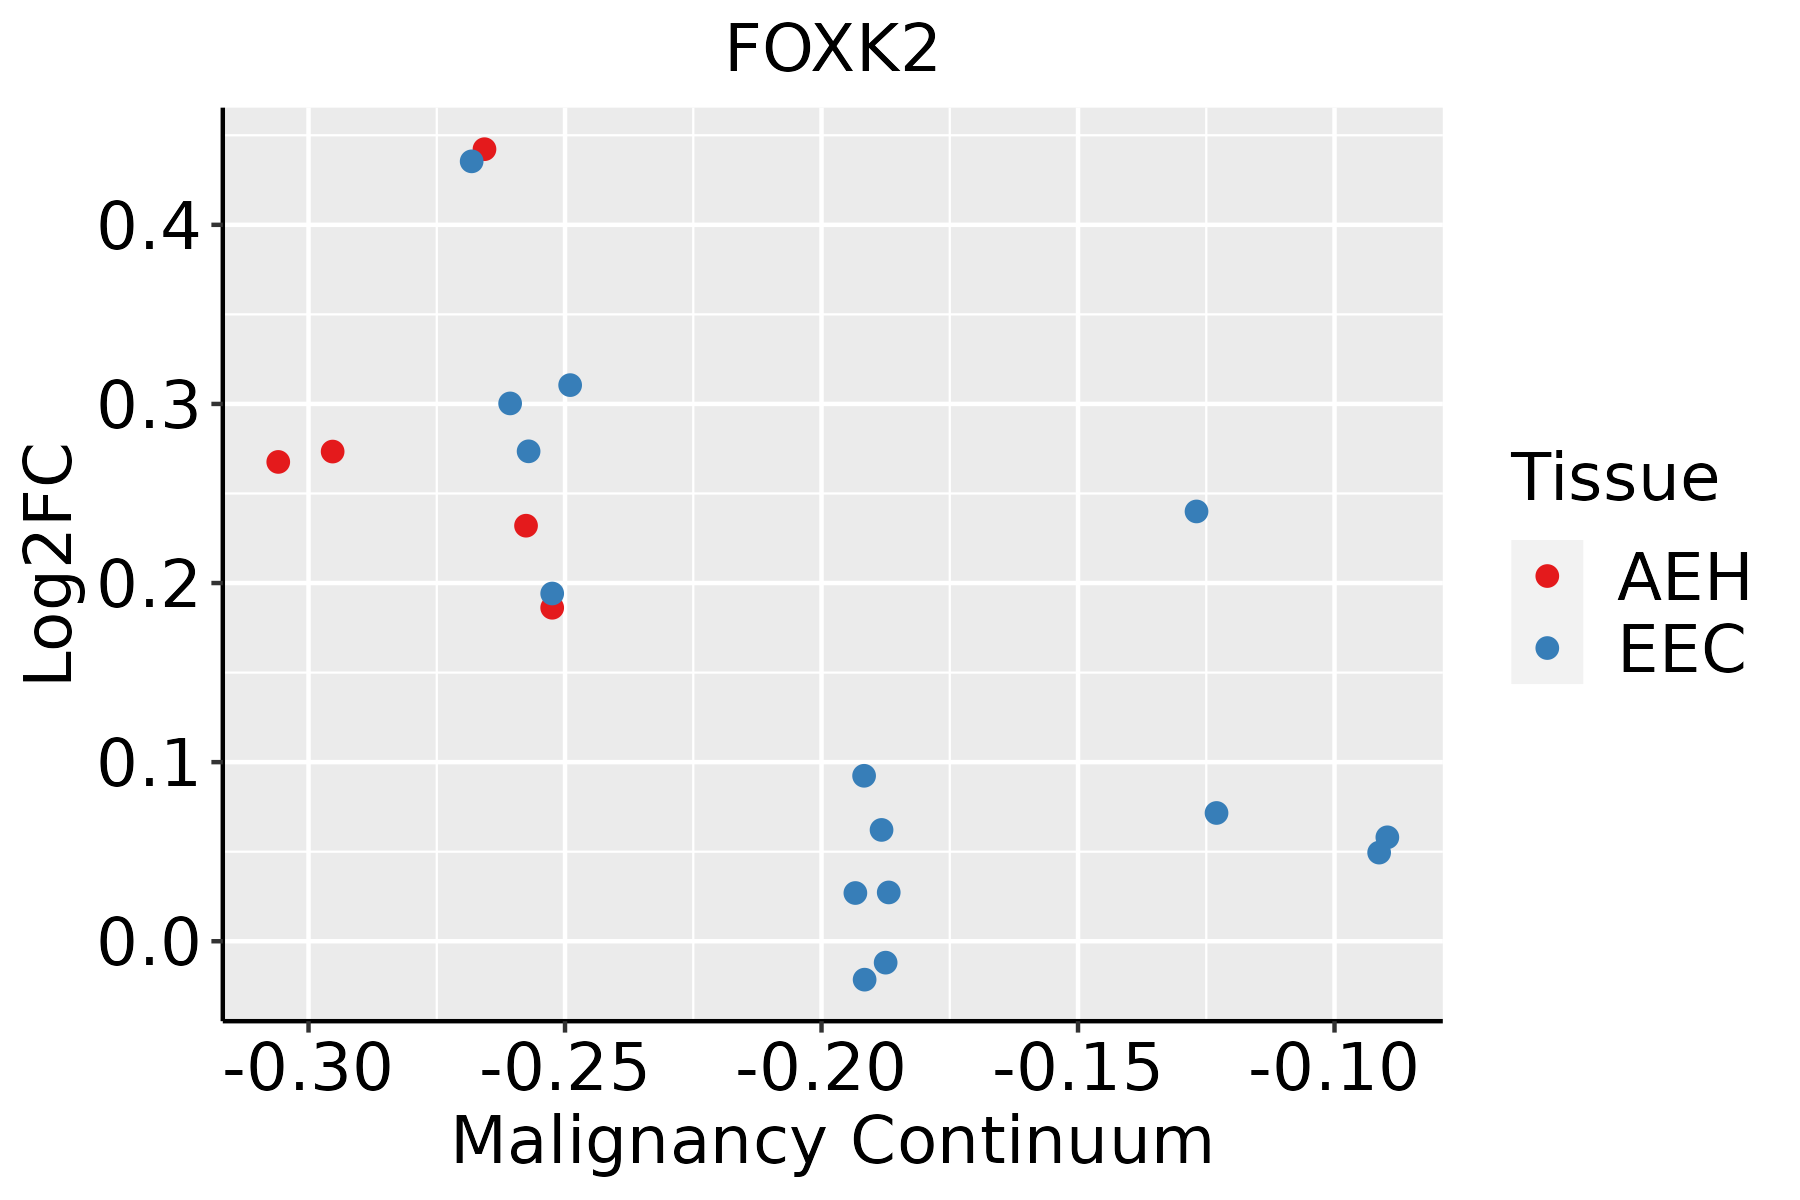 | AEH: Atypical endometrial hyperplasia |
| EEC: Endometrioid Cancer | ||
| Esophagus | 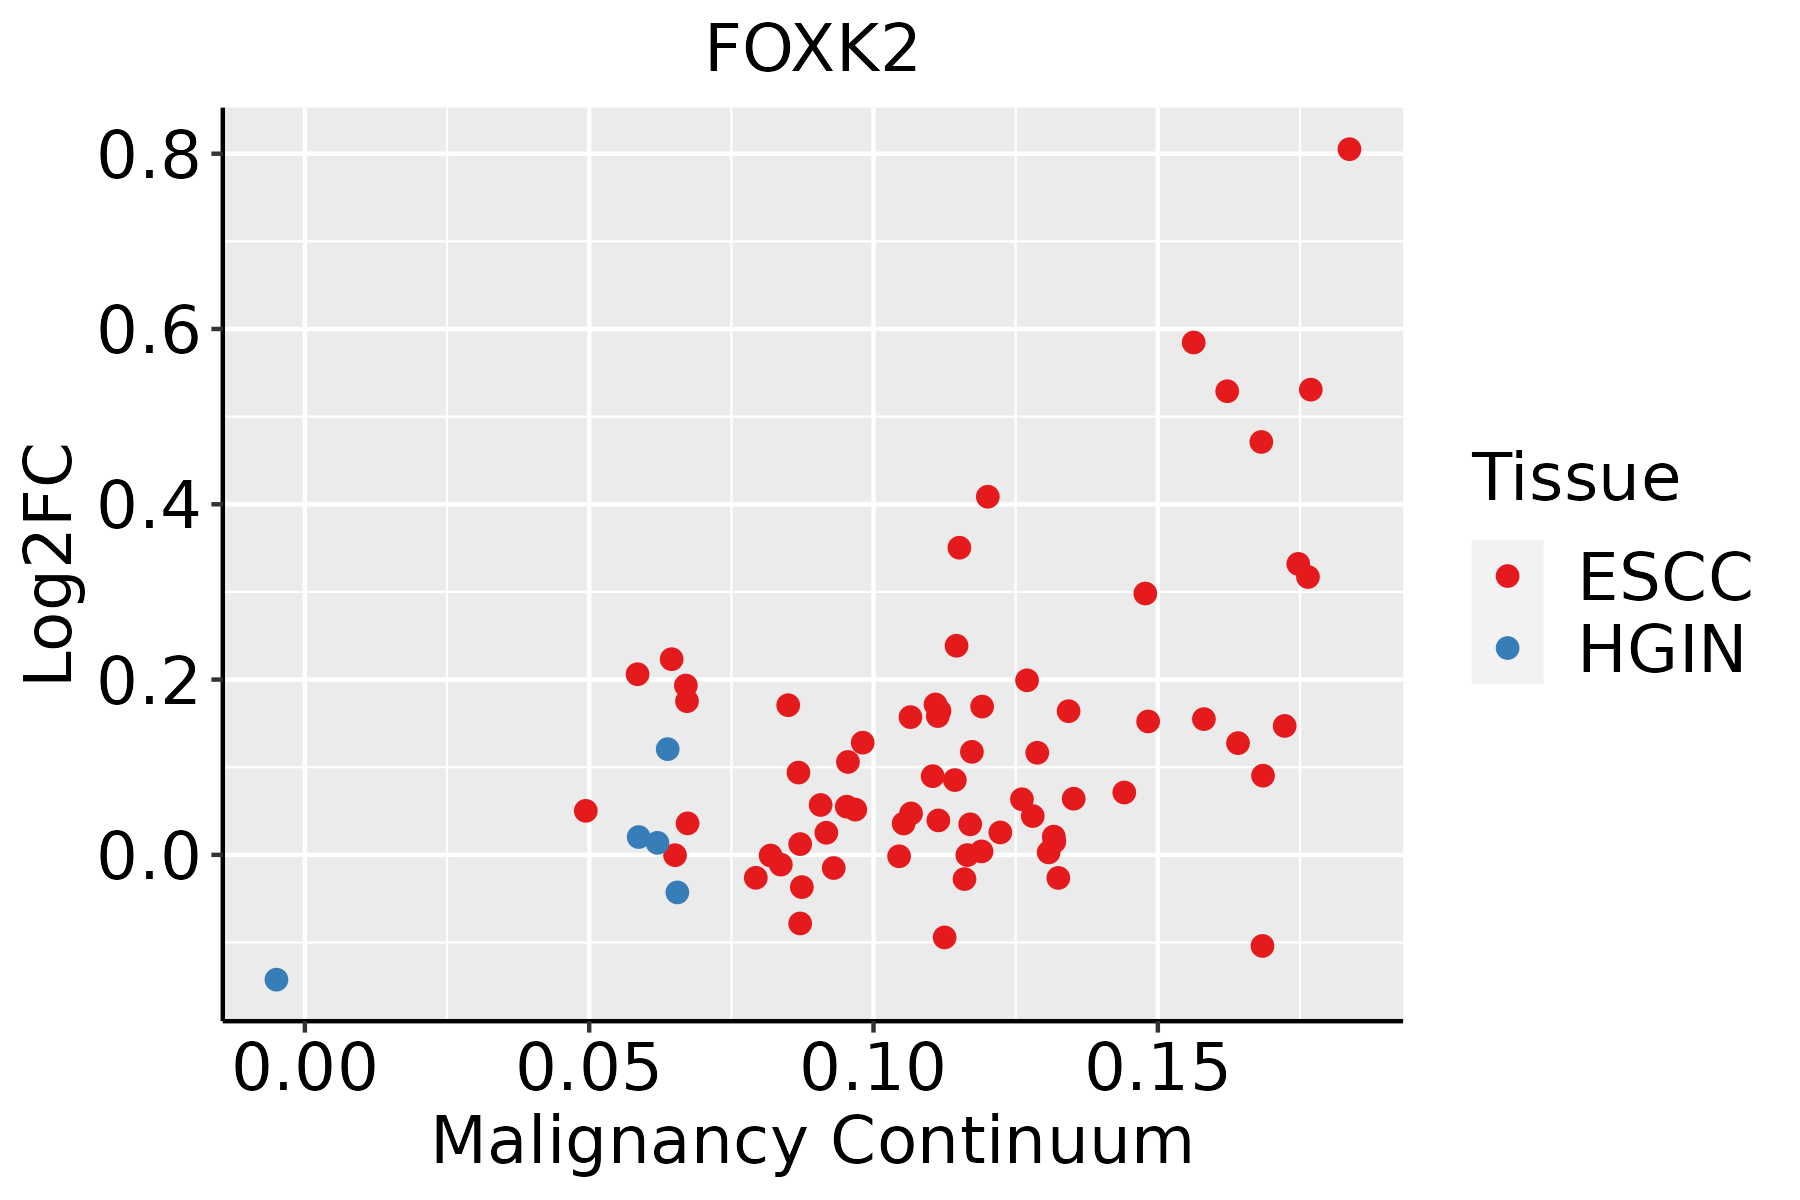 | ESCC: Esophageal squamous cell carcinoma |
| HGIN: High-grade intraepithelial neoplasias | ||
| LGIN: Low-grade intraepithelial neoplasias | ||
| Liver | 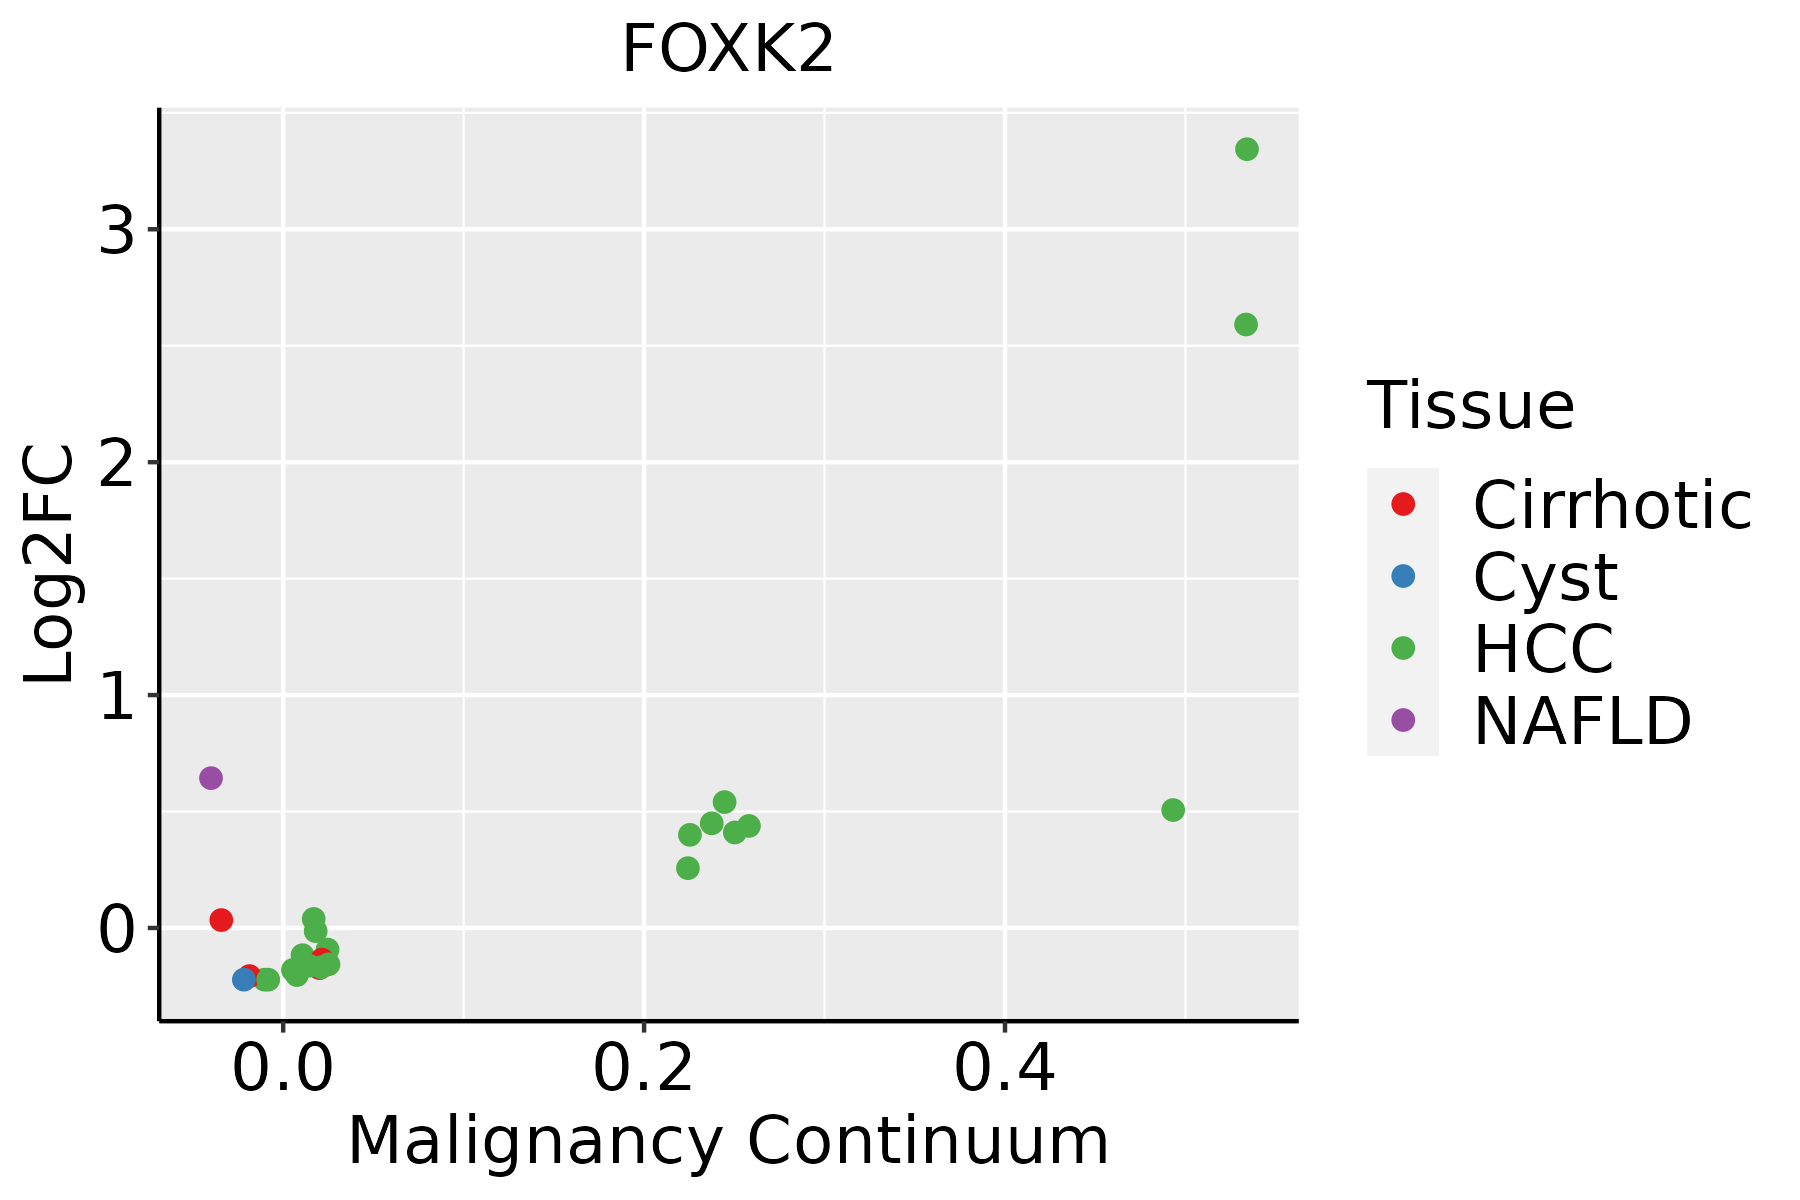 | HCC: Hepatocellular carcinoma |
| NAFLD: Non-alcoholic fatty liver disease | ||
| Prostate |  | BPH: Benign Prostatic Hyperplasia |
| Thyroid | 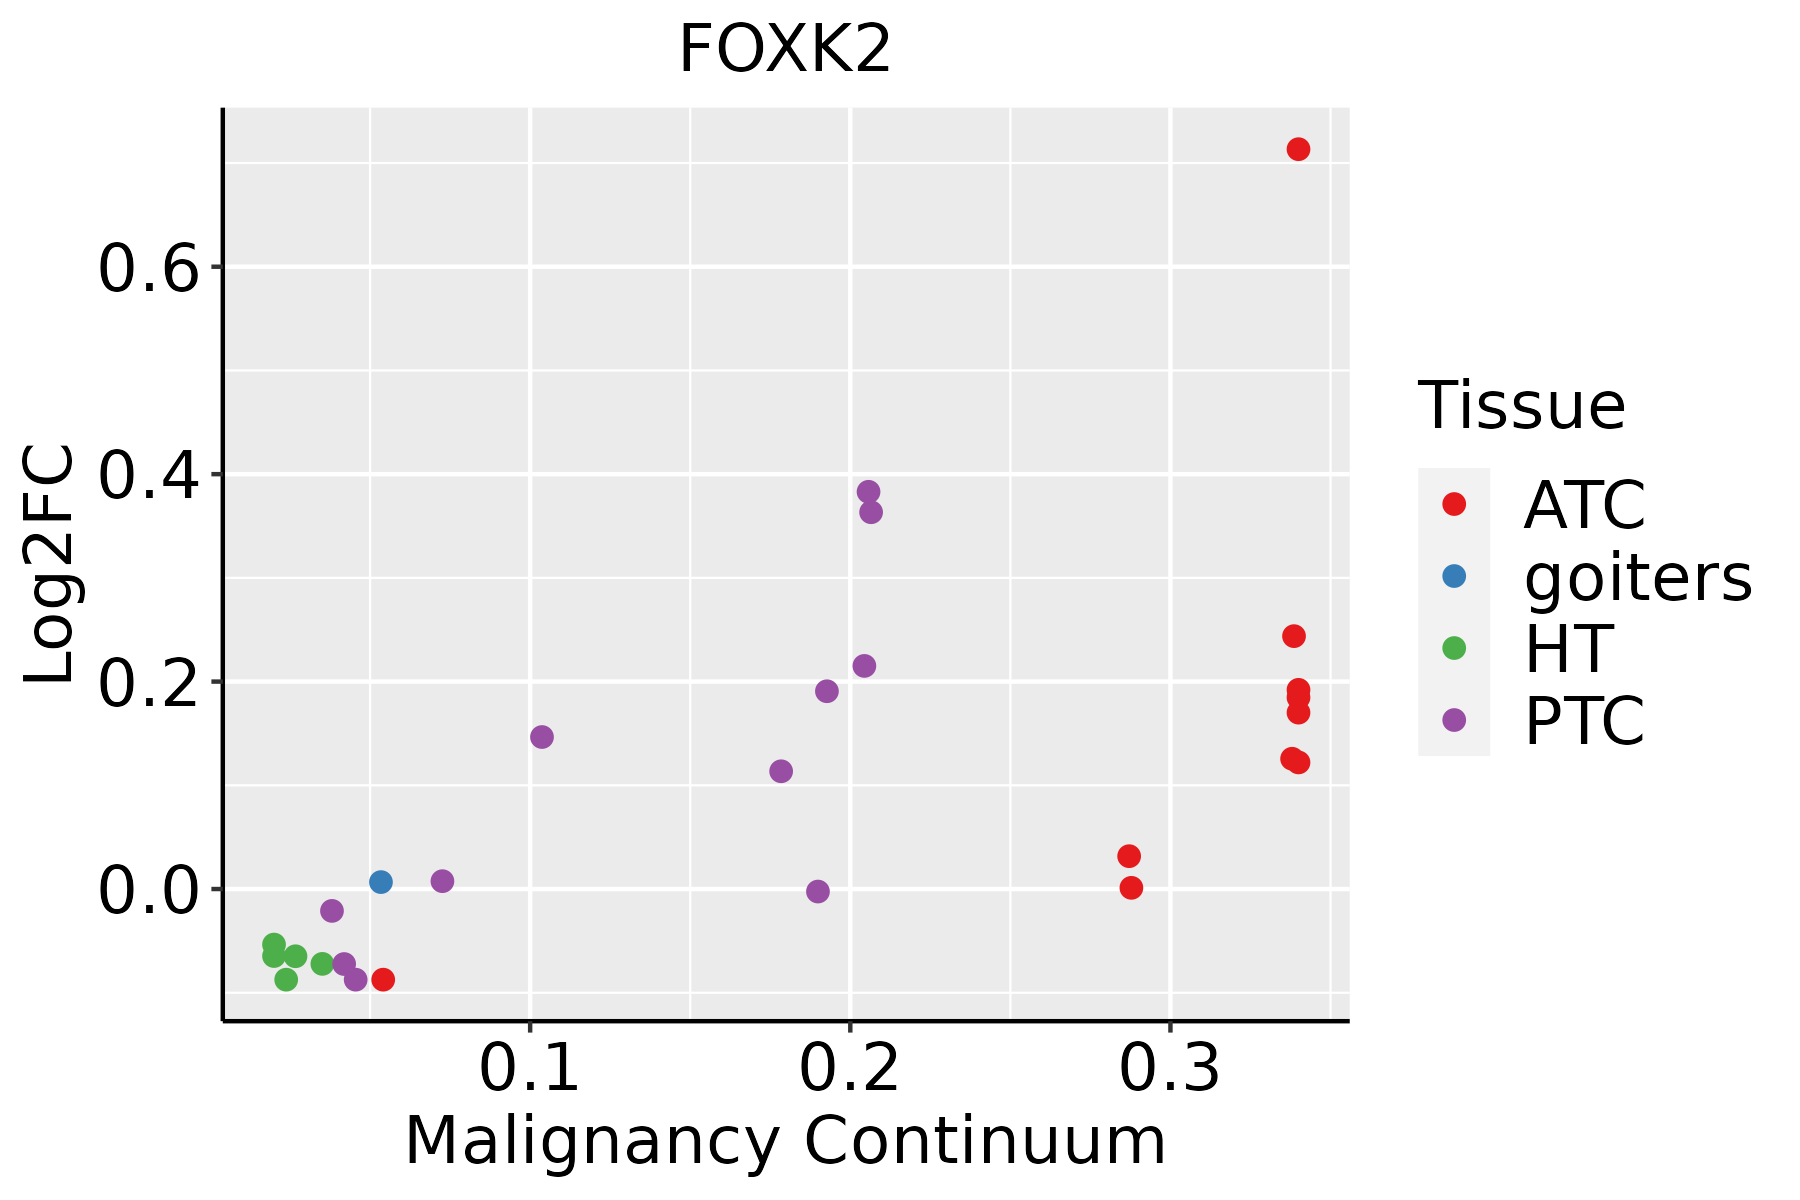 | ATC: Anaplastic thyroid cancer |
| HT: Hashimoto's thyroiditis | ||
| PTC: Papillary thyroid cancer |
| ∗log2FC in expression of this searched gene in stem-like cells from each diseased tissue sample relative to stem-like cells in normal samples in each tissue plotted against the malignancy continuum. Samples are colored based on if they are from different disease stage. |
Top |
Malignant transformation related pathway analysis |
| Find out the enriched GO biological processes and KEGG pathways involved in transition from healthy to precancer to cancer |
| Tissue | Disease Stage | Enriched GO biological Processes |
| Colorectum | AD |  |
| Colorectum | SER |  |
| Colorectum | MSS |  |
| Colorectum | MSI-H |  |
| Colorectum | FAP |  |
| ∗Top 15 enriched GO BP terms are showed in the bar plot of each disease state in each tissue. Each row represents a significant GO biological process which is colored according to the -log10(p.adjust). |
| Page: 1 2 3 4 5 6 7 8 9 |
| GO ID | Tissue | Disease Stage | Description | Gene Ratio | Bg Ratio | pvalue | p.adjust | Count |
| GO:004603410 | Cervix | CC | ATP metabolic process | 90/2311 | 277/18723 | 7.90e-19 | 2.36e-15 | 90 |
| GO:00060919 | Cervix | CC | generation of precursor metabolites and energy | 105/2311 | 490/18723 | 7.40e-09 | 6.61e-07 | 105 |
| GO:003133010 | Cervix | CC | negative regulation of cellular catabolic process | 63/2311 | 262/18723 | 1.10e-07 | 5.68e-06 | 63 |
| GO:000989510 | Cervix | CC | negative regulation of catabolic process | 69/2311 | 320/18723 | 2.15e-06 | 6.55e-05 | 69 |
| GO:003166710 | Cervix | CC | response to nutrient levels | 92/2311 | 474/18723 | 5.80e-06 | 1.42e-04 | 92 |
| GO:00425948 | Cervix | CC | response to starvation | 46/2311 | 197/18723 | 1.24e-05 | 2.59e-04 | 46 |
| GO:00105067 | Cervix | CC | regulation of autophagy | 61/2311 | 317/18723 | 2.61e-04 | 2.87e-03 | 61 |
| GO:00196939 | Cervix | CC | ribose phosphate metabolic process | 72/2311 | 396/18723 | 4.49e-04 | 4.48e-03 | 72 |
| GO:00092599 | Cervix | CC | ribonucleotide metabolic process | 70/2311 | 385/18723 | 5.35e-04 | 5.18e-03 | 70 |
| GO:00425939 | Cervix | CC | glucose homeostasis | 50/2311 | 258/18723 | 7.57e-04 | 6.76e-03 | 50 |
| GO:00335009 | Cervix | CC | carbohydrate homeostasis | 50/2311 | 259/18723 | 8.28e-04 | 7.22e-03 | 50 |
| GO:00016788 | Cervix | CC | cellular glucose homeostasis | 36/2311 | 172/18723 | 9.65e-04 | 8.09e-03 | 36 |
| GO:000915010 | Cervix | CC | purine ribonucleotide metabolic process | 66/2311 | 368/18723 | 1.09e-03 | 9.07e-03 | 66 |
| GO:000616310 | Cervix | CC | purine nucleotide metabolic process | 67/2311 | 396/18723 | 4.41e-03 | 2.69e-02 | 67 |
| GO:007252110 | Cervix | CC | purine-containing compound metabolic process | 69/2311 | 416/18723 | 6.27e-03 | 3.54e-02 | 69 |
| GO:00067346 | Cervix | CC | NADH metabolic process | 9/2311 | 29/18723 | 6.49e-03 | 3.61e-02 | 9 |
| GO:000913510 | Cervix | CC | purine nucleoside diphosphate metabolic process | 22/2311 | 103/18723 | 6.75e-03 | 3.71e-02 | 22 |
| GO:000917910 | Cervix | CC | purine ribonucleoside diphosphate metabolic process | 22/2311 | 103/18723 | 6.75e-03 | 3.71e-02 | 22 |
| GO:000911710 | Cervix | CC | nucleotide metabolic process | 79/2311 | 489/18723 | 7.16e-03 | 3.85e-02 | 79 |
| GO:00060969 | Cervix | CC | glycolytic process | 18/2311 | 81/18723 | 8.92e-03 | 4.54e-02 | 18 |
| Page: 1 2 3 4 5 6 7 8 9 10 11 12 13 14 15 16 17 18 19 20 21 22 23 24 25 |
| Pathway ID | Tissue | Disease Stage | Description | Gene Ratio | Bg Ratio | pvalue | p.adjust | qvalue | Count |
| Page: 1 |
Top |
Cell-cell communication analysis |
| Identification of potential cell-cell interactions between two cell types and their ligand-receptor pairs for different disease states |
| Ligand | Receptor | LRpair | Pathway | Tissue | Disease Stage |
| Page: 1 |
Top |
Single-cell gene regulatory network inference analysis |
| Find out the significant the regulons (TFs) and the target genes of each regulon across cell types for different disease states |
| TF | Cell Type | Tissue | Disease Stage | Target Gene | RSS | Regulon Activity |
| FOXK2 | LYMEND | Breast | DCIS | TCEAL5,MAT2A,CHSY1, etc. | 4.17e-02 |  |
| FOXK2 | SMC | Breast | Healthy | TCEAL5,MAT2A,CHSY1, etc. | 1.37e-01 |  |
| FOXK2 | SMC | Breast | Precancer | TCEAL5,MAT2A,CHSY1, etc. | 1.16e-01 |  |
| FOXK2 | MSC.ADIPO | Cervix | CC | WDR45B,NEAT1,TAF9, etc. | 2.47e-01 |  |
| FOXK2 | MON | Colorectum | Healthy | FBXO34,EXT1,BNIP3L, etc. | 1.13e-01 |  |
| FOXK2 | NK | Endometrium | ADJ | TSHZ3,KSR1,AC022146.2, etc. | 4.35e-01 |  |
| FOXK2 | NK | Endometrium | AEH | TSHZ3,KSR1,AC022146.2, etc. | 1.06e-01 |  |
| FOXK2 | TFH | Endometrium | EEC | TSHZ3,KSR1,AC022146.2, etc. | 6.50e-02 |  |
| FOXK2 | NK | Endometrium | EEC | TSHZ3,KSR1,AC022146.2, etc. | 6.81e-02 | |
| FOXK2 | BMEM | Endometrium | Healthy | TSHZ3,KSR1,AC022146.2, etc. | 1.49e-01 |  |
| ∗The dot plots of a searched regulon are shown for all cell subpopulations in each disease state of each tissue based on the regulon specific score inferred using pySCENIC and by calculating the average expression. |
| Page: 1 2 |
Top |
Somatic mutation of malignant transformation related genes |
| Annotation of somatic variants for genes involved in malignant transformation |
| Hugo Symbol | Variant Class | Variant Classification | dbSNP RS | HGVSc | HGVSp | HGVSp Short | SWISSPROT | BIOTYPE | SIFT | PolyPhen | Tumor Sample Barcode | Tissue | Histology | Sex | Age | Stage | Therapy Types | Drugs | Outcome |
| FOXK2 | SNV | Missense_Mutation | c.617N>T | p.Ala206Val | p.A206V | Q01167 | protein_coding | tolerated(0.43) | benign(0.021) | TCGA-AR-A24N-01 | Breast | breast invasive carcinoma | Female | <65 | I/II | Unknown | Unknown | SD | |
| FOXK2 | deletion | Frame_Shift_Del | novel | c.1194delG | p.Pro399ArgfsTer38 | p.P399Rfs*38 | Q01167 | protein_coding | TCGA-EW-A2FV-01 | Breast | breast invasive carcinoma | Female | <65 | III/IV | Chemotherapy | docetaxel | SD | ||
| FOXK2 | SNV | Missense_Mutation | rs773115793 | c.1321N>T | p.Arg441Trp | p.R441W | Q01167 | protein_coding | tolerated(0.05) | probably_damaging(0.952) | TCGA-JW-A852-01 | Cervix | cervical & endocervical cancer | Female | <65 | I/II | Unknown | Unknown | PD |
| FOXK2 | SNV | Missense_Mutation | c.1037N>A | p.Ala346Asp | p.A346D | Q01167 | protein_coding | deleterious(0) | probably_damaging(0.999) | TCGA-A6-6141-01 | Colorectum | colon adenocarcinoma | Male | <65 | I/II | Chemotherapy | 5-fu | SD | |
| FOXK2 | SNV | Missense_Mutation | c.940C>T | p.Arg314Cys | p.R314C | Q01167 | protein_coding | deleterious(0.04) | possibly_damaging(0.702) | TCGA-AA-3860-01 | Colorectum | colon adenocarcinoma | Female | <65 | III/IV | Chemotherapy | folinic | CR | |
| FOXK2 | SNV | Missense_Mutation | novel | c.584G>A | p.Ser195Asn | p.S195N | Q01167 | protein_coding | deleterious(0.01) | benign(0.298) | TCGA-AA-3949-01 | Colorectum | colon adenocarcinoma | Female | >=65 | III/IV | Unknown | Unknown | SD |
| FOXK2 | SNV | Missense_Mutation | c.1091C>T | p.Pro364Leu | p.P364L | Q01167 | protein_coding | tolerated(0.06) | possibly_damaging(0.846) | TCGA-CK-5916-01 | Colorectum | colon adenocarcinoma | Female | >=65 | I/II | Unknown | Unknown | PD | |
| FOXK2 | SNV | Missense_Mutation | novel | c.1225N>A | p.Ala409Thr | p.A409T | Q01167 | protein_coding | tolerated(0.28) | benign(0.028) | TCGA-A5-A1OF-01 | Endometrium | uterine corpus endometrioid carcinoma | Female | <65 | I/II | Unknown | Unknown | SD |
| FOXK2 | SNV | Missense_Mutation | rs766532897 | c.1790N>T | p.Ala597Val | p.A597V | Q01167 | protein_coding | tolerated(1) | benign(0.009) | TCGA-A5-A1OF-01 | Endometrium | uterine corpus endometrioid carcinoma | Female | <65 | I/II | Unknown | Unknown | SD |
| FOXK2 | SNV | Missense_Mutation | rs139388643 | c.961C>T | p.Arg321Cys | p.R321C | Q01167 | protein_coding | deleterious(0.04) | possibly_damaging(0.839) | TCGA-AJ-A3OK-01 | Endometrium | uterine corpus endometrioid carcinoma | Female | >=65 | I/II | Chemotherapy | carboplatin | CR |
| Page: 1 2 3 4 5 |
Top |
Related drugs of malignant transformation related genes |
| Identification of chemicals and drugs interact with genes involved in malignant transfromation |
| (DGIdb 4.0) |
| Entrez ID | Symbol | Category | Interaction Types | Drug Claim Name | Drug Name | PMIDs |
| Page: 1 |

Copyright 2023-Present -The University of Texas Health Science Center at Houston |