| Tissue | Expression Dynamics | Abbreviation |
| Cervix | 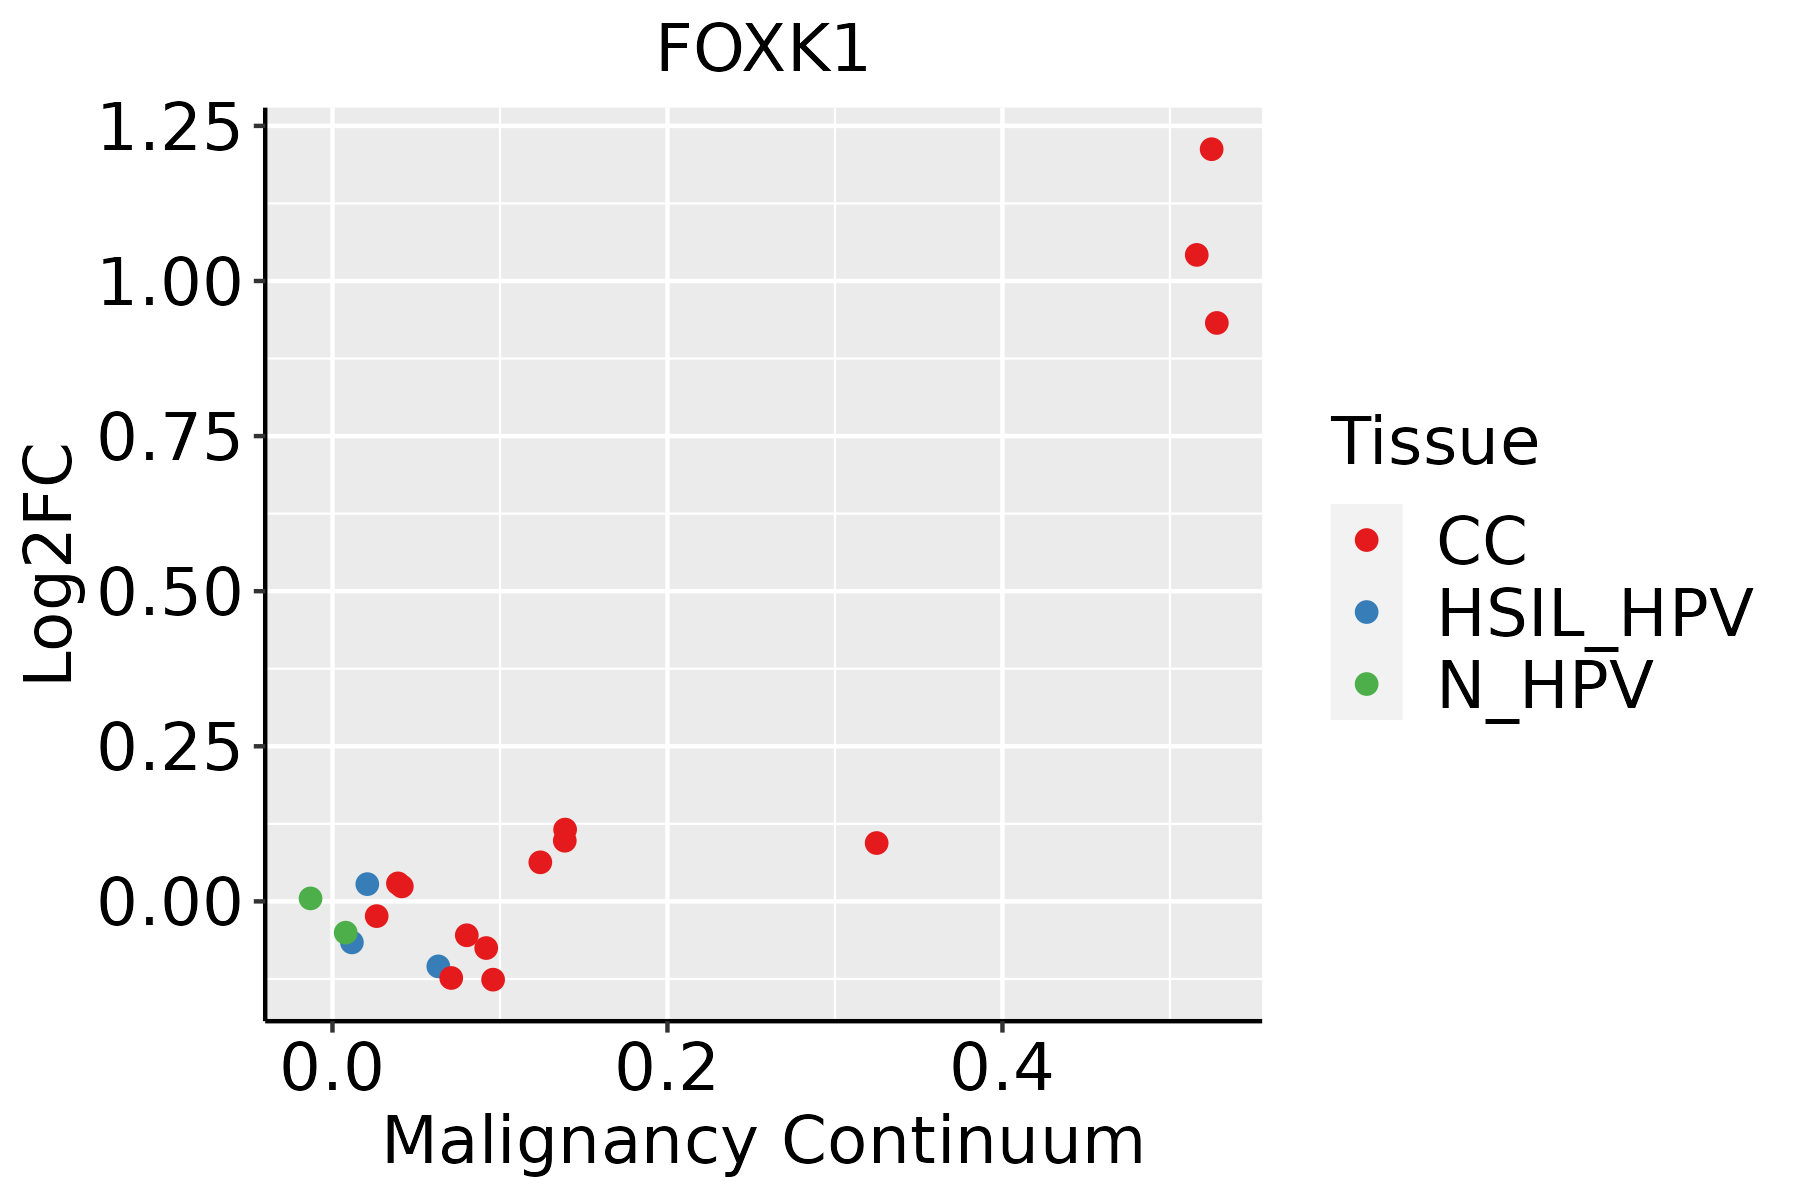 | CC: Cervix cancer |
| HSIL_HPV: HPV-infected high-grade squamous intraepithelial lesions |
| N_HPV: HPV-infected normal cervix |
| Esophagus | 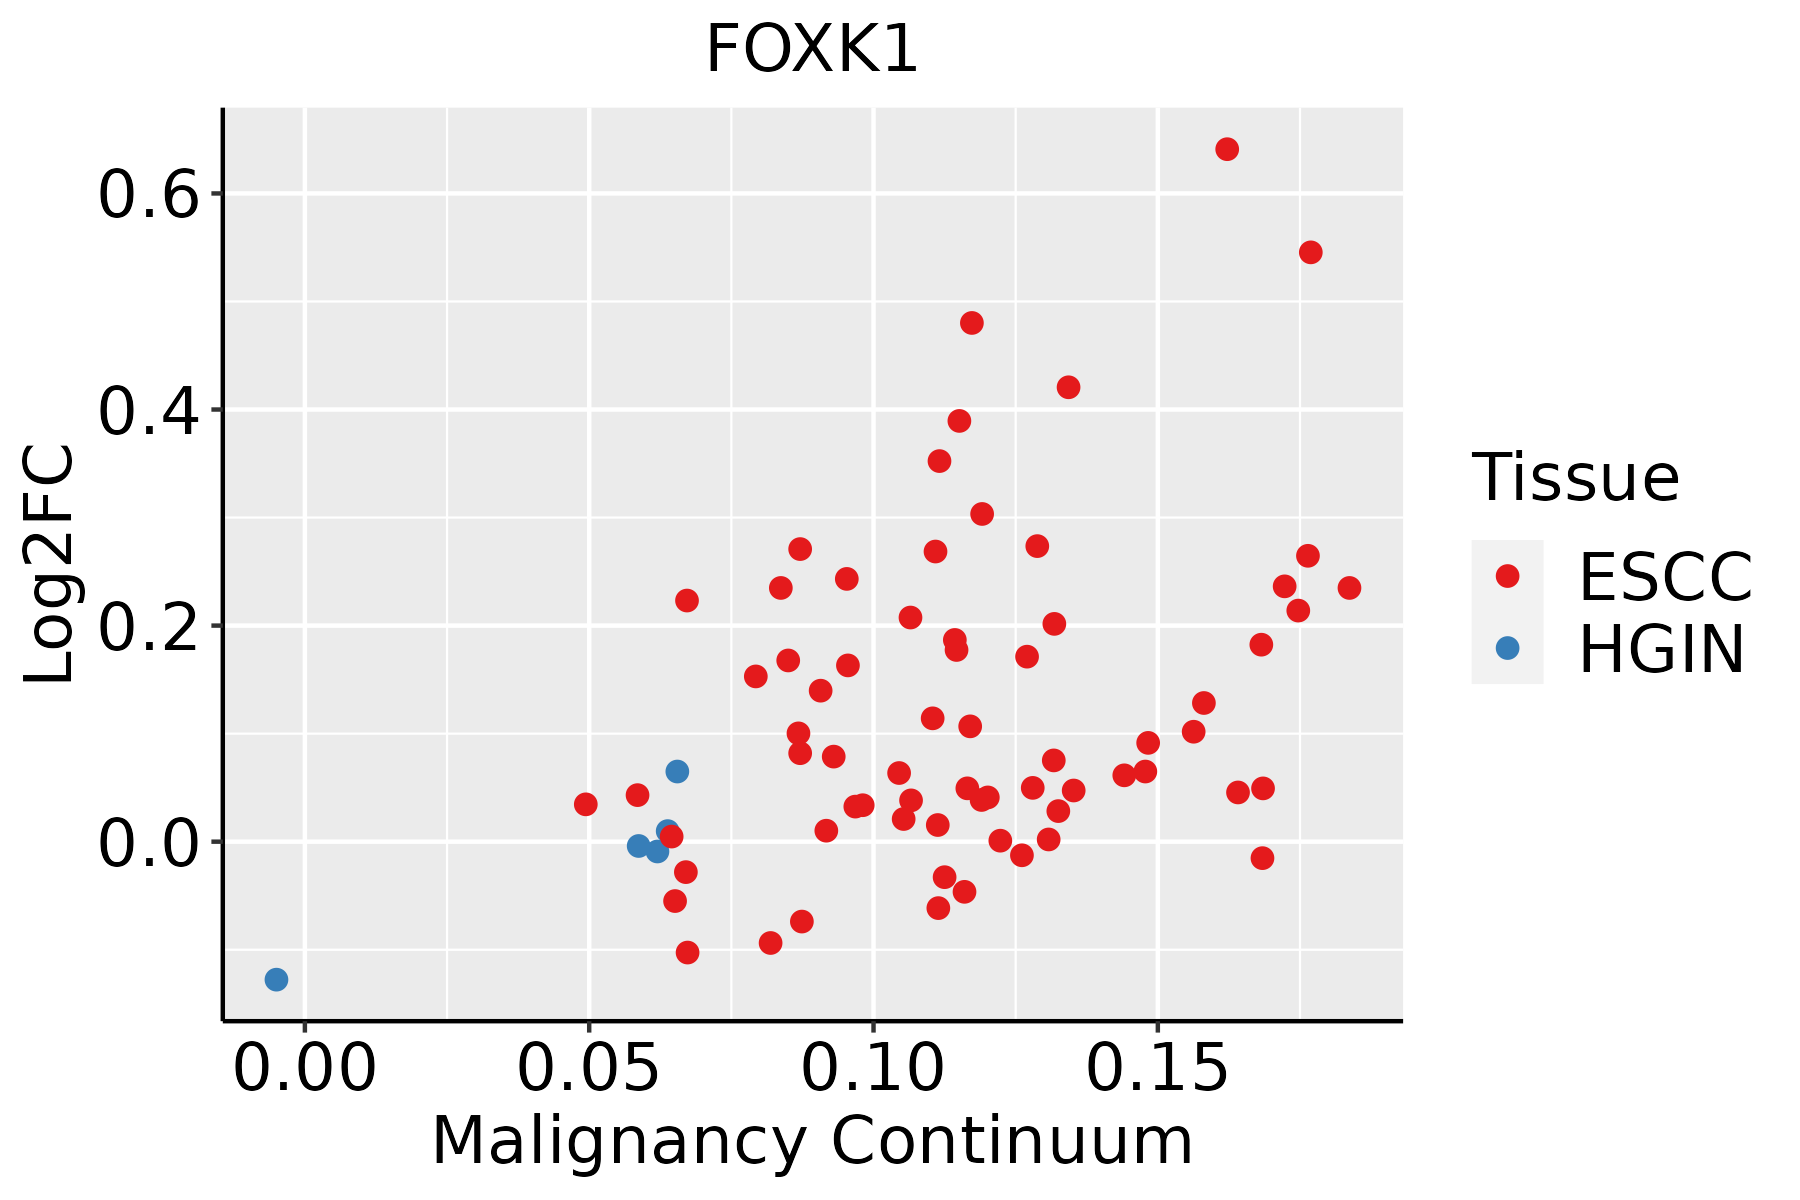 | ESCC: Esophageal squamous cell carcinoma |
| HGIN: High-grade intraepithelial neoplasias |
| LGIN: Low-grade intraepithelial neoplasias |
| Liver |  | HCC: Hepatocellular carcinoma |
| NAFLD: Non-alcoholic fatty liver disease |
| Lung |  | AAH: Atypical adenomatous hyperplasia |
| AIS: Adenocarcinoma in situ |
| IAC: Invasive lung adenocarcinoma |
| MIA: Minimally invasive adenocarcinoma |
| Oral Cavity |  | EOLP: Erosive Oral lichen planus |
| LP: leukoplakia |
| NEOLP: Non-erosive oral lichen planus |
| OSCC: Oral squamous cell carcinoma |
| Skin | 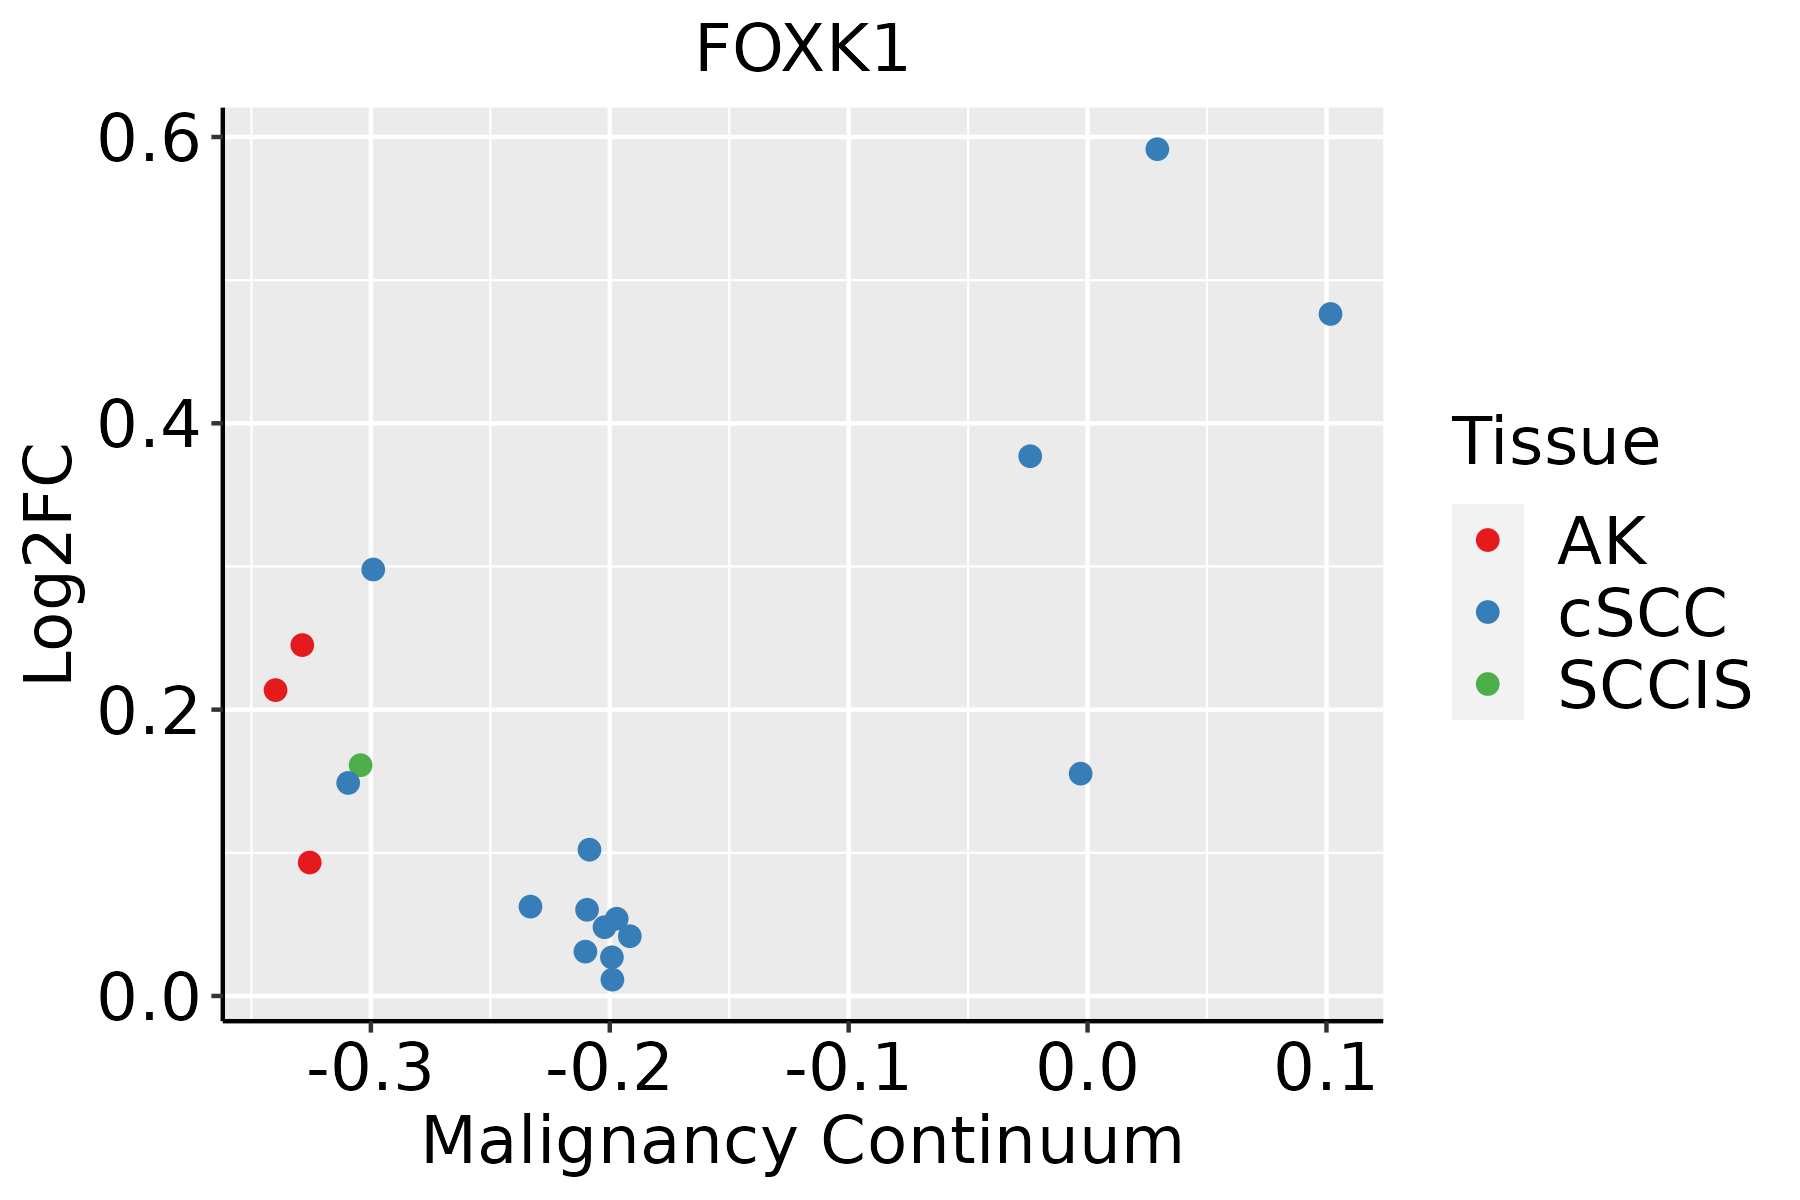 | AK: Actinic keratosis |
| cSCC: Cutaneous squamous cell carcinoma |
| SCCIS:squamous cell carcinoma in situ |
| Thyroid |  | ATC: Anaplastic thyroid cancer |
| HT: Hashimoto's thyroiditis |
| PTC: Papillary thyroid cancer |
| GO ID | Tissue | Disease Stage | Description | Gene Ratio | Bg Ratio | pvalue | p.adjust | Count |
| GO:004603410 | Cervix | CC | ATP metabolic process | 90/2311 | 277/18723 | 7.90e-19 | 2.36e-15 | 90 |
| GO:00060919 | Cervix | CC | generation of precursor metabolites and energy | 105/2311 | 490/18723 | 7.40e-09 | 6.61e-07 | 105 |
| GO:003133010 | Cervix | CC | negative regulation of cellular catabolic process | 63/2311 | 262/18723 | 1.10e-07 | 5.68e-06 | 63 |
| GO:000989510 | Cervix | CC | negative regulation of catabolic process | 69/2311 | 320/18723 | 2.15e-06 | 6.55e-05 | 69 |
| GO:003166710 | Cervix | CC | response to nutrient levels | 92/2311 | 474/18723 | 5.80e-06 | 1.42e-04 | 92 |
| GO:00425948 | Cervix | CC | response to starvation | 46/2311 | 197/18723 | 1.24e-05 | 2.59e-04 | 46 |
| GO:00105067 | Cervix | CC | regulation of autophagy | 61/2311 | 317/18723 | 2.61e-04 | 2.87e-03 | 61 |
| GO:00196939 | Cervix | CC | ribose phosphate metabolic process | 72/2311 | 396/18723 | 4.49e-04 | 4.48e-03 | 72 |
| GO:00092599 | Cervix | CC | ribonucleotide metabolic process | 70/2311 | 385/18723 | 5.35e-04 | 5.18e-03 | 70 |
| GO:00425939 | Cervix | CC | glucose homeostasis | 50/2311 | 258/18723 | 7.57e-04 | 6.76e-03 | 50 |
| GO:00335009 | Cervix | CC | carbohydrate homeostasis | 50/2311 | 259/18723 | 8.28e-04 | 7.22e-03 | 50 |
| GO:00016788 | Cervix | CC | cellular glucose homeostasis | 36/2311 | 172/18723 | 9.65e-04 | 8.09e-03 | 36 |
| GO:000915010 | Cervix | CC | purine ribonucleotide metabolic process | 66/2311 | 368/18723 | 1.09e-03 | 9.07e-03 | 66 |
| GO:00075173 | Cervix | CC | muscle organ development | 58/2311 | 327/18723 | 2.73e-03 | 1.85e-02 | 58 |
| GO:000616310 | Cervix | CC | purine nucleotide metabolic process | 67/2311 | 396/18723 | 4.41e-03 | 2.69e-02 | 67 |
| GO:007252110 | Cervix | CC | purine-containing compound metabolic process | 69/2311 | 416/18723 | 6.27e-03 | 3.54e-02 | 69 |
| GO:00067346 | Cervix | CC | NADH metabolic process | 9/2311 | 29/18723 | 6.49e-03 | 3.61e-02 | 9 |
| GO:000913510 | Cervix | CC | purine nucleoside diphosphate metabolic process | 22/2311 | 103/18723 | 6.75e-03 | 3.71e-02 | 22 |
| GO:000917910 | Cervix | CC | purine ribonucleoside diphosphate metabolic process | 22/2311 | 103/18723 | 6.75e-03 | 3.71e-02 | 22 |
| GO:000911710 | Cervix | CC | nucleotide metabolic process | 79/2311 | 489/18723 | 7.16e-03 | 3.85e-02 | 79 |
| TF | Cell Type | Tissue | Disease Stage | Target Gene | RSS | Regulon Activity |
| FOXK1 | CD8TEFF | Breast | DCIS | MFSD8,NDC80,HIST1H2AL, etc. | 1.21e-01 |  |
| FOXK1 | GC | Colorectum | AD | SGPP2,SLC12A2,PHPT1, etc. | 3.52e-02 |  |
| FOXK1 | TFH | Colorectum | AD | SGPP2,SLC12A2,PHPT1, etc. | 2.22e-16 | |
| FOXK1 | BN | Colorectum | AD | SGPP2,SLC12A2,PHPT1, etc. | 2.22e-16 | |
| FOXK1 | CD8TEREX | Colorectum | CRC | SGPP2,SLC12A2,PHPT1, etc. | 5.25e-02 |  |
| FOXK1 | ILC | Colorectum | CRC | SGPP2,SLC12A2,PHPT1, etc. | 2.92e-02 | |
| FOXK1 | CD8TEXINT | Colorectum | FAP | SGPP2,SLC12A2,PHPT1, etc. | 2.34e-02 |  |
| FOXK1 | BN | Colorectum | Healthy | SGPP2,SLC12A2,PHPT1, etc. | 2.31e-02 |  |
| FOXK1 | CD8TCM | Colorectum | Healthy | SGPP2,SLC12A2,PHPT1, etc. | 3.39e-02 | |
| FOXK1 | CD8TEREX | Colorectum | MSI-H | SGPP2,SLC12A2,PHPT1, etc. | 1.71e-01 |  |
| Hugo Symbol | Variant Class | Variant Classification | dbSNP RS | HGVSc | HGVSp | HGVSp Short | SWISSPROT | BIOTYPE | SIFT | PolyPhen | Tumor Sample Barcode | Tissue | Histology | Sex | Age | Stage | Therapy Types | Drugs | Outcome |
| FOXK1 | SNV | Missense_Mutation | rs750121455 | c.2047N>C | p.Thr683Pro | p.T683P | P85037 | protein_coding | tolerated_low_confidence(0.13) | benign(0.137) | TCGA-A7-A3IY-01 | Breast | breast invasive carcinoma | Female | >=65 | I/II | Hormone Therapy | anastrozole | SD |
| FOXK1 | SNV | Missense_Mutation | rs750121455 | c.2047N>C | p.Thr683Pro | p.T683P | P85037 | protein_coding | tolerated_low_confidence(0.13) | benign(0.137) | TCGA-AR-A1AM-01 | Breast | breast invasive carcinoma | Female | <65 | III/IV | Chemotherapy | adriamycin | SD |
| FOXK1 | SNV | Missense_Mutation | | c.689N>T | p.Pro230Leu | p.P230L | P85037 | protein_coding | deleterious(0) | probably_damaging(0.998) | TCGA-AR-A1AT-01 | Breast | breast invasive carcinoma | Female | <65 | I/II | Hormone Therapy | anastrozole | SD |
| FOXK1 | SNV | Missense_Mutation | | c.1189C>T | p.Arg397Trp | p.R397W | P85037 | protein_coding | deleterious(0) | probably_damaging(1) | TCGA-OL-A5DA-01 | Breast | breast invasive carcinoma | Female | <65 | I/II | Unknown | Unknown | SD |
| FOXK1 | insertion | Nonsense_Mutation | novel | c.992_993insTTCTGGAAGAGGTGAGAAATTTCAGAATTAAATTATAATAAAAC | p.Tyr332SerfsTer10 | p.Y332Sfs*10 | P85037 | protein_coding | | | TCGA-A2-A0EY-01 | Breast | breast invasive carcinoma | Female | <65 | I/II | Chemotherapy | adriamycin | SD |
| FOXK1 | SNV | Missense_Mutation | novel | c.1546G>A | p.Val516Met | p.V516M | P85037 | protein_coding | deleterious(0) | possibly_damaging(0.849) | TCGA-2W-A8YY-01 | Cervix | cervical & endocervical cancer | Female | <65 | I/II | Chemotherapy | cisplatin | CR |
| FOXK1 | SNV | Missense_Mutation | novel | c.622G>A | p.Glu208Lys | p.E208K | P85037 | protein_coding | tolerated(0.19) | benign(0.027) | TCGA-DR-A0ZM-01 | Cervix | cervical & endocervical cancer | Female | <65 | III/IV | Unspecific | Cisplatin | SD |
| FOXK1 | SNV | Missense_Mutation | novel | c.518N>T | p.Ala173Val | p.A173V | P85037 | protein_coding | tolerated(1) | benign(0.003) | TCGA-EA-A410-01 | Cervix | cervical & endocervical cancer | Female | <65 | I/II | Unknown | Unknown | SD |
| FOXK1 | SNV | Missense_Mutation | | c.2011N>A | p.Glu671Lys | p.E671K | P85037 | protein_coding | deleterious_low_confidence(0.02) | benign(0.012) | TCGA-EK-A2RK-01 | Cervix | cervical & endocervical cancer | Female | >=65 | I/II | Unknown | Unknown | SD |
| FOXK1 | SNV | Missense_Mutation | novel | c.1081N>T | p.Arg361Cys | p.R361C | P85037 | protein_coding | deleterious(0.03) | probably_damaging(0.999) | TCGA-VS-A8QC-01 | Cervix | cervical & endocervical cancer | Female | <65 | I/II | Chemotherapy | paclitaxel | PD |


