
|
|||||
|
 | |
| |
| |
| |
| |
| |
|
Gene: FOXJ3 |
Gene summary for FOXJ3 |
| Gene information | Species | Human | Gene symbol | FOXJ3 | Gene ID | 22887 |
| Gene name | forkhead box J3 | |
| Gene Alias | FOXJ3 | |
| Cytomap | 1p34.2 | |
| Gene Type | protein-coding | GO ID | GO:0000003 | UniProtAcc | Q9UPW0 |
Top |
Malignant transformation analysis |
| Identification of the aberrant gene expression in precancerous and cancerous lesions by comparing the gene expression of stem-like cells in diseased tissues with normal stem cells |
| Entrez ID | Symbol | Replicates | Species | Organ | Tissue | Adj P-value | Log2FC | Malignancy |
| 22887 | FOXJ3 | CCI_1 | Human | Cervix | CC | 2.55e-13 | 1.14e+00 | 0.528 |
| 22887 | FOXJ3 | CCI_2 | Human | Cervix | CC | 2.33e-11 | 1.16e+00 | 0.5249 |
| 22887 | FOXJ3 | CCI_3 | Human | Cervix | CC | 1.17e-14 | 1.02e+00 | 0.516 |
| 22887 | FOXJ3 | HTA11_3410_2000001011 | Human | Colorectum | AD | 9.43e-12 | -4.70e-01 | 0.0155 |
| 22887 | FOXJ3 | HTA11_866_3004761011 | Human | Colorectum | AD | 1.06e-05 | -4.13e-01 | 0.096 |
| 22887 | FOXJ3 | HTA11_7696_3000711011 | Human | Colorectum | AD | 1.89e-04 | -3.76e-01 | 0.0674 |
| 22887 | FOXJ3 | HTA11_99999973899_84307 | Human | Colorectum | MSS | 2.41e-02 | -4.74e-01 | 0.2585 |
| 22887 | FOXJ3 | HTA11_99999974143_84620 | Human | Colorectum | MSS | 2.14e-09 | -4.55e-01 | 0.3005 |
| 22887 | FOXJ3 | A015-C-203 | Human | Colorectum | FAP | 7.72e-29 | -3.63e-01 | -0.1294 |
| 22887 | FOXJ3 | A015-C-204 | Human | Colorectum | FAP | 9.32e-06 | -3.47e-01 | -0.0228 |
| 22887 | FOXJ3 | A014-C-040 | Human | Colorectum | FAP | 6.53e-04 | -3.43e-01 | -0.1184 |
| 22887 | FOXJ3 | A002-C-201 | Human | Colorectum | FAP | 1.44e-13 | -3.32e-01 | 0.0324 |
| 22887 | FOXJ3 | A002-C-203 | Human | Colorectum | FAP | 1.44e-07 | -2.06e-01 | 0.2786 |
| 22887 | FOXJ3 | A001-C-119 | Human | Colorectum | FAP | 4.71e-06 | -2.41e-01 | -0.1557 |
| 22887 | FOXJ3 | A001-C-108 | Human | Colorectum | FAP | 1.11e-16 | -1.19e-01 | -0.0272 |
| 22887 | FOXJ3 | A002-C-205 | Human | Colorectum | FAP | 3.13e-25 | -4.23e-01 | -0.1236 |
| 22887 | FOXJ3 | A001-C-104 | Human | Colorectum | FAP | 1.33e-04 | -4.97e-02 | 0.0184 |
| 22887 | FOXJ3 | A015-C-005 | Human | Colorectum | FAP | 3.66e-03 | -1.10e-01 | -0.0336 |
| 22887 | FOXJ3 | A015-C-006 | Human | Colorectum | FAP | 1.54e-15 | -4.33e-01 | -0.0994 |
| 22887 | FOXJ3 | A015-C-106 | Human | Colorectum | FAP | 3.91e-11 | -1.25e-01 | -0.0511 |
| Page: 1 2 3 4 5 6 7 8 |
| Tissue | Expression Dynamics | Abbreviation |
| Cervix |  | CC: Cervix cancer |
| HSIL_HPV: HPV-infected high-grade squamous intraepithelial lesions | ||
| N_HPV: HPV-infected normal cervix | ||
| Colorectum (GSE201348) |  | FAP: Familial adenomatous polyposis |
| CRC: Colorectal cancer | ||
| Colorectum (HTA11) |  | AD: Adenomas |
| SER: Sessile serrated lesions | ||
| MSI-H: Microsatellite-high colorectal cancer | ||
| MSS: Microsatellite stable colorectal cancer | ||
| Endometrium |  | AEH: Atypical endometrial hyperplasia |
| EEC: Endometrioid Cancer | ||
| Esophagus | 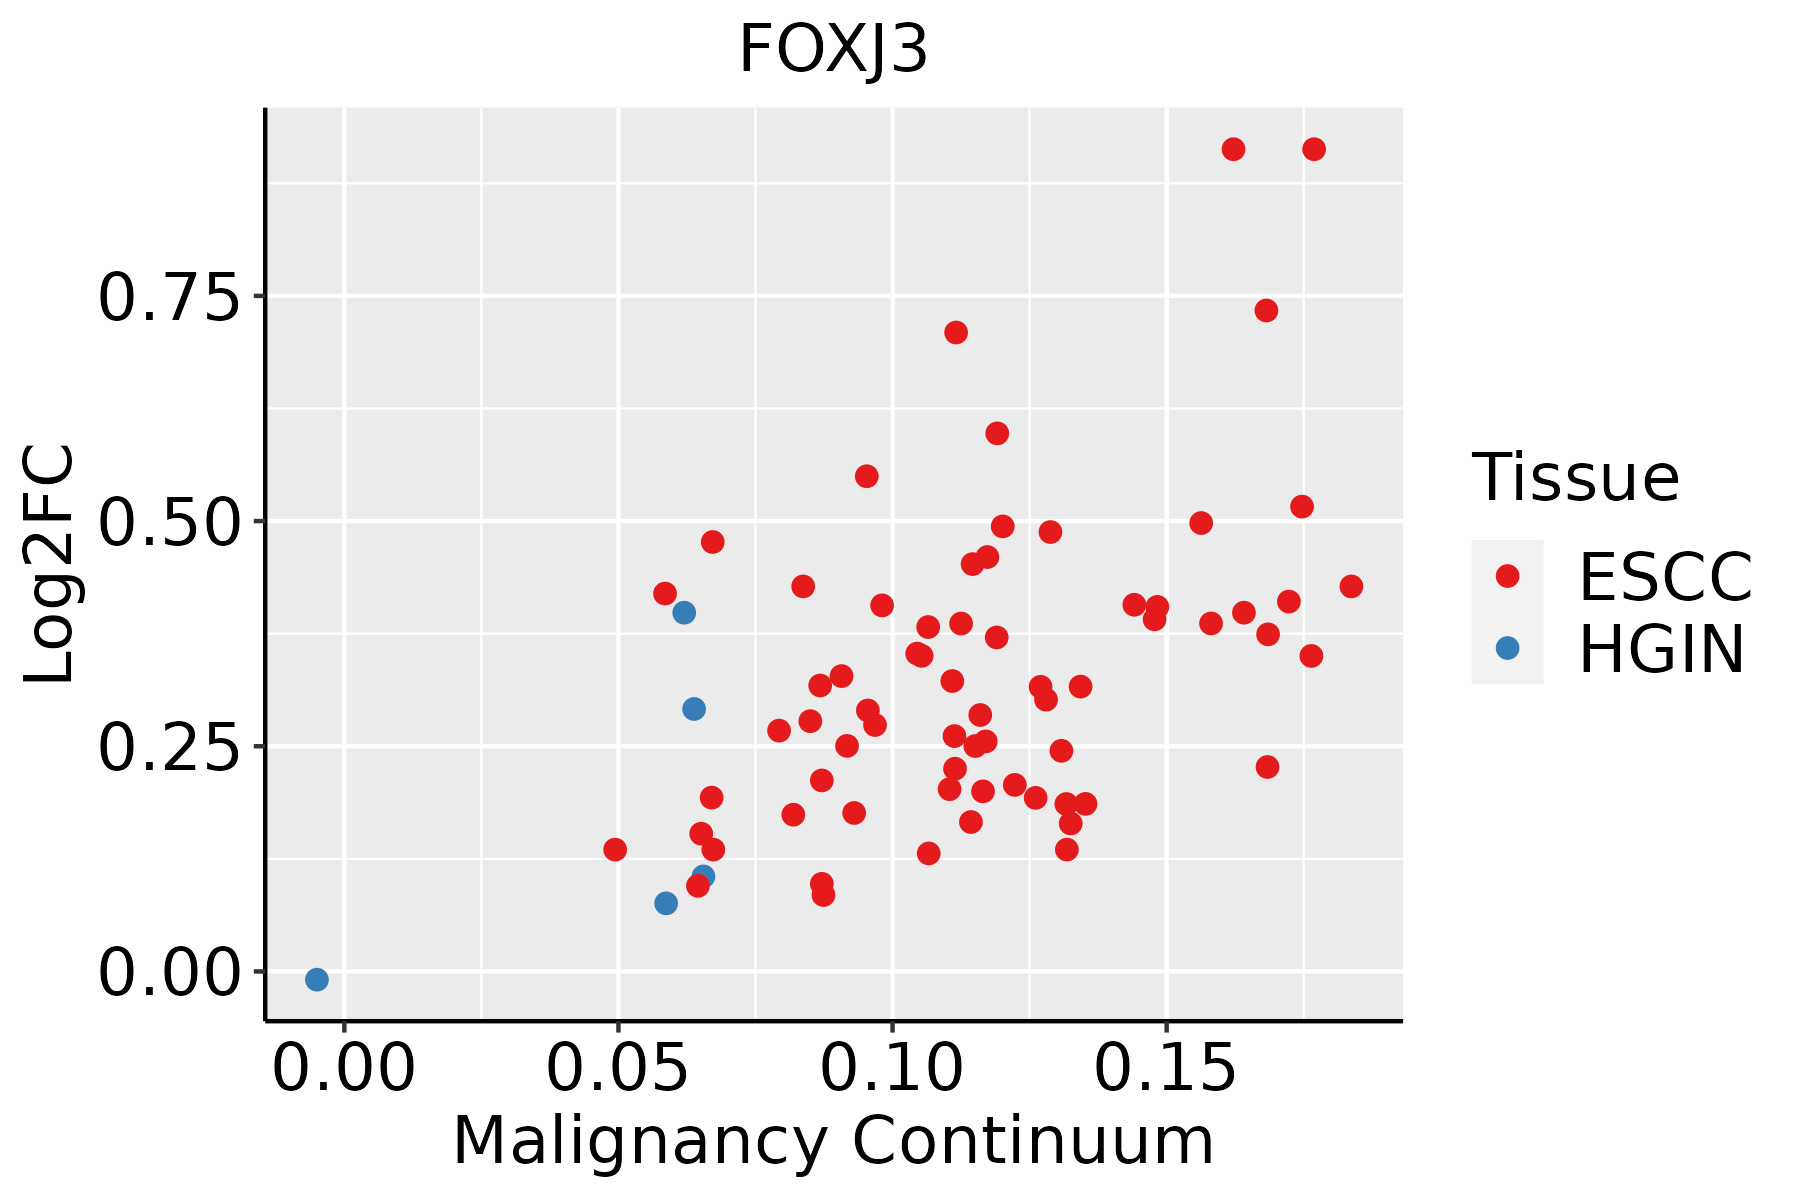 | ESCC: Esophageal squamous cell carcinoma |
| HGIN: High-grade intraepithelial neoplasias | ||
| LGIN: Low-grade intraepithelial neoplasias | ||
| Liver |  | HCC: Hepatocellular carcinoma |
| NAFLD: Non-alcoholic fatty liver disease | ||
| Lung |  | AAH: Atypical adenomatous hyperplasia |
| AIS: Adenocarcinoma in situ | ||
| IAC: Invasive lung adenocarcinoma | ||
| MIA: Minimally invasive adenocarcinoma | ||
| Prostate | 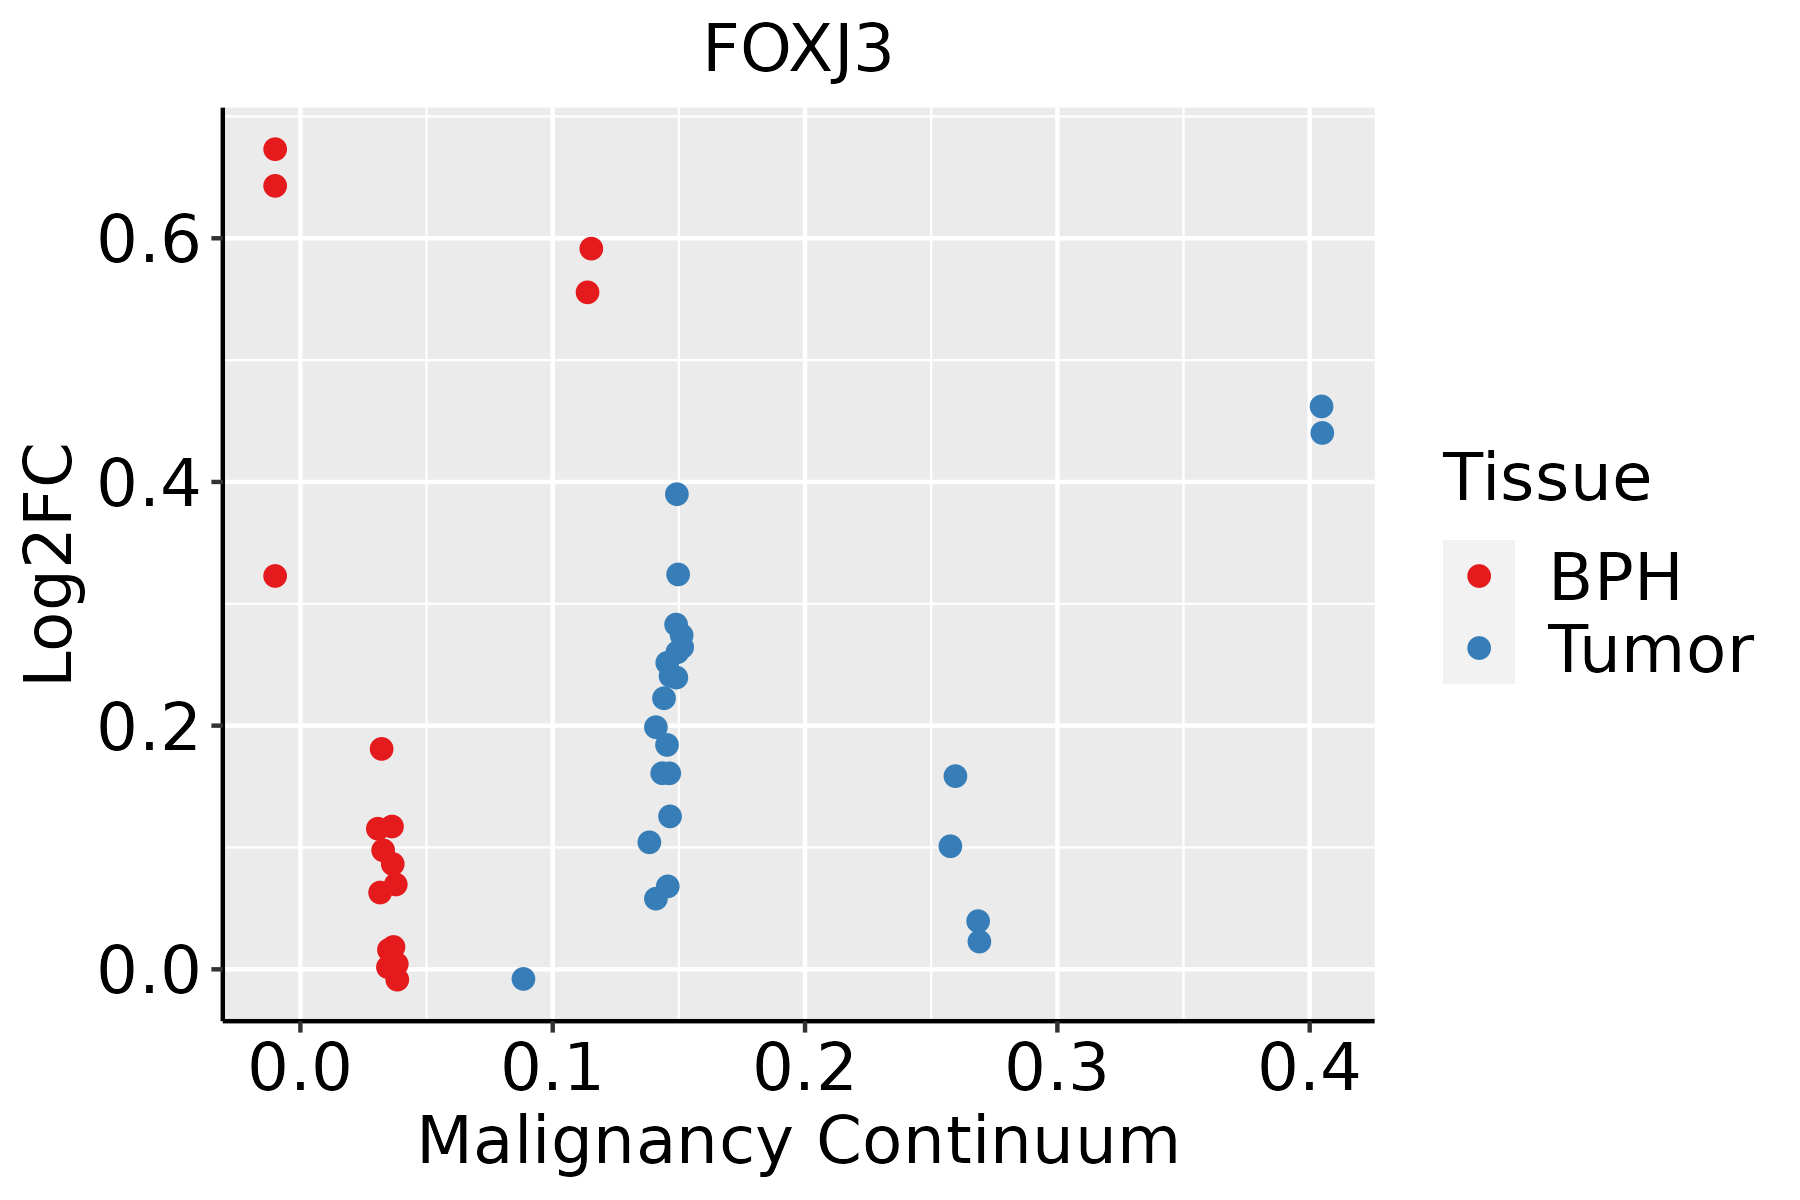 | BPH: Benign Prostatic Hyperplasia |
| Thyroid |  | ATC: Anaplastic thyroid cancer |
| HT: Hashimoto's thyroiditis | ||
| PTC: Papillary thyroid cancer |
| ∗log2FC in expression of this searched gene in stem-like cells from each diseased tissue sample relative to stem-like cells in normal samples in each tissue plotted against the malignancy continuum. Samples are colored based on if they are from different disease stage. |
Top |
Malignant transformation related pathway analysis |
| Find out the enriched GO biological processes and KEGG pathways involved in transition from healthy to precancer to cancer |
| Tissue | Disease Stage | Enriched GO biological Processes |
| Colorectum | AD |  |
| Colorectum | SER |  |
| Colorectum | MSS |  |
| Colorectum | MSI-H |  |
| Colorectum | FAP |  |
| ∗Top 15 enriched GO BP terms are showed in the bar plot of each disease state in each tissue. Each row represents a significant GO biological process which is colored according to the -log10(p.adjust). |
| Page: 1 2 3 4 5 6 7 8 9 |
| GO ID | Tissue | Disease Stage | Description | Gene Ratio | Bg Ratio | pvalue | p.adjust | Count |
| GO:00482851 | Cervix | CC | organelle fission | 78/2311 | 488/18723 | 9.70e-03 | 4.79e-02 | 78 |
| GO:00482853 | Esophagus | ESCC | organelle fission | 301/8552 | 488/18723 | 4.64e-13 | 2.12e-11 | 301 |
| GO:00002802 | Esophagus | ESCC | nuclear division | 270/8552 | 439/18723 | 1.17e-11 | 4.24e-10 | 270 |
| GO:0048285 | Liver | HCC | organelle fission | 254/7958 | 488/18723 | 1.07e-05 | 1.23e-04 | 254 |
| GO:0000280 | Liver | HCC | nuclear division | 220/7958 | 439/18723 | 6.90e-04 | 4.25e-03 | 220 |
| GO:00482855 | Thyroid | PTC | organelle fission | 188/5968 | 488/18723 | 9.64e-04 | 5.77e-03 | 188 |
| GO:00002804 | Thyroid | PTC | nuclear division | 167/5968 | 439/18723 | 3.27e-03 | 1.60e-02 | 167 |
| GO:004828512 | Thyroid | ATC | organelle fission | 229/6293 | 488/18723 | 4.79e-10 | 1.29e-08 | 229 |
| GO:000028011 | Thyroid | ATC | nuclear division | 207/6293 | 439/18723 | 1.98e-09 | 4.80e-08 | 207 |
| Page: 1 |
| Pathway ID | Tissue | Disease Stage | Description | Gene Ratio | Bg Ratio | pvalue | p.adjust | qvalue | Count |
| Page: 1 |
Top |
Cell-cell communication analysis |
| Identification of potential cell-cell interactions between two cell types and their ligand-receptor pairs for different disease states |
| Ligand | Receptor | LRpair | Pathway | Tissue | Disease Stage |
| Page: 1 |
Top |
Single-cell gene regulatory network inference analysis |
| Find out the significant the regulons (TFs) and the target genes of each regulon across cell types for different disease states |
| TF | Cell Type | Tissue | Disease Stage | Target Gene | RSS | Regulon Activity |
| FOXJ3 | MYOEPI | Breast | DCIS | GRB7,FAXDC2,SARM1, etc. | 1.43e-01 |  |
| FOXJ3 | NK | Cervix | N_HPV | PINX1,CILK1,KDM5B, etc. | 6.95e-02 |  |
| FOXJ3 | BMEM | Endometrium | ADJ | TRIM2,ERBB4,ZNF317, etc. | 1.30e-01 |  |
| FOXJ3 | MALTB | Endometrium | Healthy | TRIM2,ERBB4,ZNF317, etc. | 3.37e-02 |  |
| FOXJ3 | CD8TEXP | Endometrium | Healthy | TRIM2,ERBB4,ZNF317, etc. | 1.57e-01 | |
| FOXJ3 | SMC | Esophagus | ADJ | RIN1,GCNT1,CLDN14, etc. | 3.12e-02 |  |
| FOXJ3 | MSC | Esophagus | ADJ | RIN1,GCNT1,CLDN14, etc. | 1.01e-02 | |
| FOXJ3 | TFH | Liver | Cirrhotic | OCIAD2,PUM2,N4BP2, etc. | 3.28e-01 |  |
| FOXJ3 | LUM | Prostate | BPH | TUT7,BICD1,IBTK, etc. | 4.77e-01 |  |
| ∗The dot plots of a searched regulon are shown for all cell subpopulations in each disease state of each tissue based on the regulon specific score inferred using pySCENIC and by calculating the average expression. |
| Page: 1 |
Top |
Somatic mutation of malignant transformation related genes |
| Annotation of somatic variants for genes involved in malignant transformation |
| Hugo Symbol | Variant Class | Variant Classification | dbSNP RS | HGVSc | HGVSp | HGVSp Short | SWISSPROT | BIOTYPE | SIFT | PolyPhen | Tumor Sample Barcode | Tissue | Histology | Sex | Age | Stage | Therapy Types | Drugs | Outcome |
| FOXJ3 | SNV | Missense_Mutation | novel | c.1806G>C | p.Gln602His | p.Q602H | Q9UPW0 | protein_coding | deleterious(0.05) | benign(0.001) | TCGA-AC-A3W6-01 | Breast | breast invasive carcinoma | Female | >=65 | III/IV | Unknown | Unknown | SD |
| FOXJ3 | SNV | Missense_Mutation | c.1545C>A | p.Phe515Leu | p.F515L | Q9UPW0 | protein_coding | deleterious(0.04) | possibly_damaging(0.899) | TCGA-AN-A046-01 | Breast | breast invasive carcinoma | Female | >=65 | I/II | Unknown | Unknown | SD | |
| FOXJ3 | SNV | Missense_Mutation | c.1470G>C | p.Met490Ile | p.M490I | Q9UPW0 | protein_coding | deleterious(0.01) | benign(0.031) | TCGA-AR-A0TX-01 | Breast | breast invasive carcinoma | Female | <65 | I/II | Unknown | Unknown | SD | |
| FOXJ3 | SNV | Missense_Mutation | c.1325N>G | p.Pro442Arg | p.P442R | Q9UPW0 | protein_coding | tolerated_low_confidence(0.55) | benign(0.07) | TCGA-E9-A1RC-01 | Breast | breast invasive carcinoma | Female | <65 | III/IV | Hormone Therapy | tamoxiphen | SD | |
| FOXJ3 | insertion | Nonsense_Mutation | novel | c.1360_1361insGATCTCAAGAACTGGTCTTTAGACCAGGTTCAGTTTG | p.Asn454ArgfsTer13 | p.N454Rfs*13 | Q9UPW0 | protein_coding | TCGA-AN-A0FN-01 | Breast | breast invasive carcinoma | Female | <65 | I/II | Unknown | Unknown | SD | ||
| FOXJ3 | SNV | Missense_Mutation | novel | c.463G>A | p.Asp155Asn | p.D155N | Q9UPW0 | protein_coding | deleterious(0) | probably_damaging(0.992) | TCGA-2W-A8YY-01 | Cervix | cervical & endocervical cancer | Female | <65 | I/II | Chemotherapy | cisplatin | CR |
| FOXJ3 | SNV | Missense_Mutation | c.526C>T | p.Arg176Trp | p.R176W | Q9UPW0 | protein_coding | deleterious(0) | probably_damaging(0.967) | TCGA-A6-5661-01 | Colorectum | colon adenocarcinoma | Female | >=65 | I/II | Unknown | Unknown | SD | |
| FOXJ3 | SNV | Missense_Mutation | novel | c.463G>T | p.Asp155Tyr | p.D155Y | Q9UPW0 | protein_coding | deleterious(0) | probably_damaging(0.999) | TCGA-AZ-4315-01 | Colorectum | colon adenocarcinoma | Male | <65 | I/II | Unknown | Unknown | SD |
| FOXJ3 | SNV | Missense_Mutation | rs779227723 | c.1186C>T | p.Arg396Cys | p.R396C | Q9UPW0 | protein_coding | tolerated(0.11) | possibly_damaging(0.446) | TCGA-CK-4951-01 | Colorectum | colon adenocarcinoma | Female | >=65 | I/II | Unknown | Unknown | PD |
| FOXJ3 | SNV | Missense_Mutation | c.1228C>T | p.Leu410Phe | p.L410F | Q9UPW0 | protein_coding | tolerated(0.71) | benign(0.202) | TCGA-AG-3901-01 | Colorectum | rectum adenocarcinoma | Female | >=65 | III/IV | Unknown | Unknown | SD |
| Page: 1 2 3 4 5 6 7 8 |
Top |
Related drugs of malignant transformation related genes |
| Identification of chemicals and drugs interact with genes involved in malignant transfromation |
| (DGIdb 4.0) |
| Entrez ID | Symbol | Category | Interaction Types | Drug Claim Name | Drug Name | PMIDs |
| Page: 1 |

Copyright 2023-Present -The University of Texas Health Science Center at Houston |