
|
|||||
|
 | |
| |
| |
| |
| |
| |
|
Gene: FOXJ2 |
Gene summary for FOXJ2 |
| Gene information | Species | Human | Gene symbol | FOXJ2 | Gene ID | 55810 |
| Gene name | forkhead box J2 | |
| Gene Alias | FHX | |
| Cytomap | 12p13.31 | |
| Gene Type | protein-coding | GO ID | GO:0000003 | UniProtAcc | Q9P0K8 |
Top |
Malignant transformation analysis |
| Identification of the aberrant gene expression in precancerous and cancerous lesions by comparing the gene expression of stem-like cells in diseased tissues with normal stem cells |
| Entrez ID | Symbol | Replicates | Species | Organ | Tissue | Adj P-value | Log2FC | Malignancy |
| 55810 | FOXJ2 | LZE8T | Human | Esophagus | ESCC | 9.27e-03 | 1.41e-01 | 0.067 |
| 55810 | FOXJ2 | P1T-E | Human | Esophagus | ESCC | 4.42e-03 | 1.13e-01 | 0.0875 |
| 55810 | FOXJ2 | P2T-E | Human | Esophagus | ESCC | 4.01e-11 | 1.35e-01 | 0.1177 |
| 55810 | FOXJ2 | P4T-E | Human | Esophagus | ESCC | 2.01e-04 | 2.36e-02 | 0.1323 |
| 55810 | FOXJ2 | P5T-E | Human | Esophagus | ESCC | 1.12e-05 | 1.59e-02 | 0.1327 |
| 55810 | FOXJ2 | P8T-E | Human | Esophagus | ESCC | 4.17e-15 | 1.10e-01 | 0.0889 |
| 55810 | FOXJ2 | P9T-E | Human | Esophagus | ESCC | 4.98e-03 | 3.71e-02 | 0.1131 |
| 55810 | FOXJ2 | P10T-E | Human | Esophagus | ESCC | 1.32e-06 | 9.48e-02 | 0.116 |
| 55810 | FOXJ2 | P12T-E | Human | Esophagus | ESCC | 5.76e-14 | 2.57e-01 | 0.1122 |
| 55810 | FOXJ2 | P15T-E | Human | Esophagus | ESCC | 1.81e-07 | 9.26e-02 | 0.1149 |
| 55810 | FOXJ2 | P16T-E | Human | Esophagus | ESCC | 8.07e-29 | 5.12e-01 | 0.1153 |
| 55810 | FOXJ2 | P20T-E | Human | Esophagus | ESCC | 4.66e-04 | 4.35e-02 | 0.1124 |
| 55810 | FOXJ2 | P21T-E | Human | Esophagus | ESCC | 1.66e-03 | 2.22e-02 | 0.1617 |
| 55810 | FOXJ2 | P22T-E | Human | Esophagus | ESCC | 7.15e-14 | 1.94e-01 | 0.1236 |
| 55810 | FOXJ2 | P23T-E | Human | Esophagus | ESCC | 8.84e-03 | 4.01e-02 | 0.108 |
| 55810 | FOXJ2 | P24T-E | Human | Esophagus | ESCC | 5.96e-08 | 1.05e-01 | 0.1287 |
| 55810 | FOXJ2 | P26T-E | Human | Esophagus | ESCC | 2.25e-10 | 1.21e-01 | 0.1276 |
| 55810 | FOXJ2 | P27T-E | Human | Esophagus | ESCC | 1.29e-06 | 1.41e-01 | 0.1055 |
| 55810 | FOXJ2 | P28T-E | Human | Esophagus | ESCC | 4.78e-06 | 7.28e-02 | 0.1149 |
| 55810 | FOXJ2 | P30T-E | Human | Esophagus | ESCC | 5.03e-06 | 1.58e-01 | 0.137 |
| Page: 1 2 3 |
| Tissue | Expression Dynamics | Abbreviation |
| Esophagus | 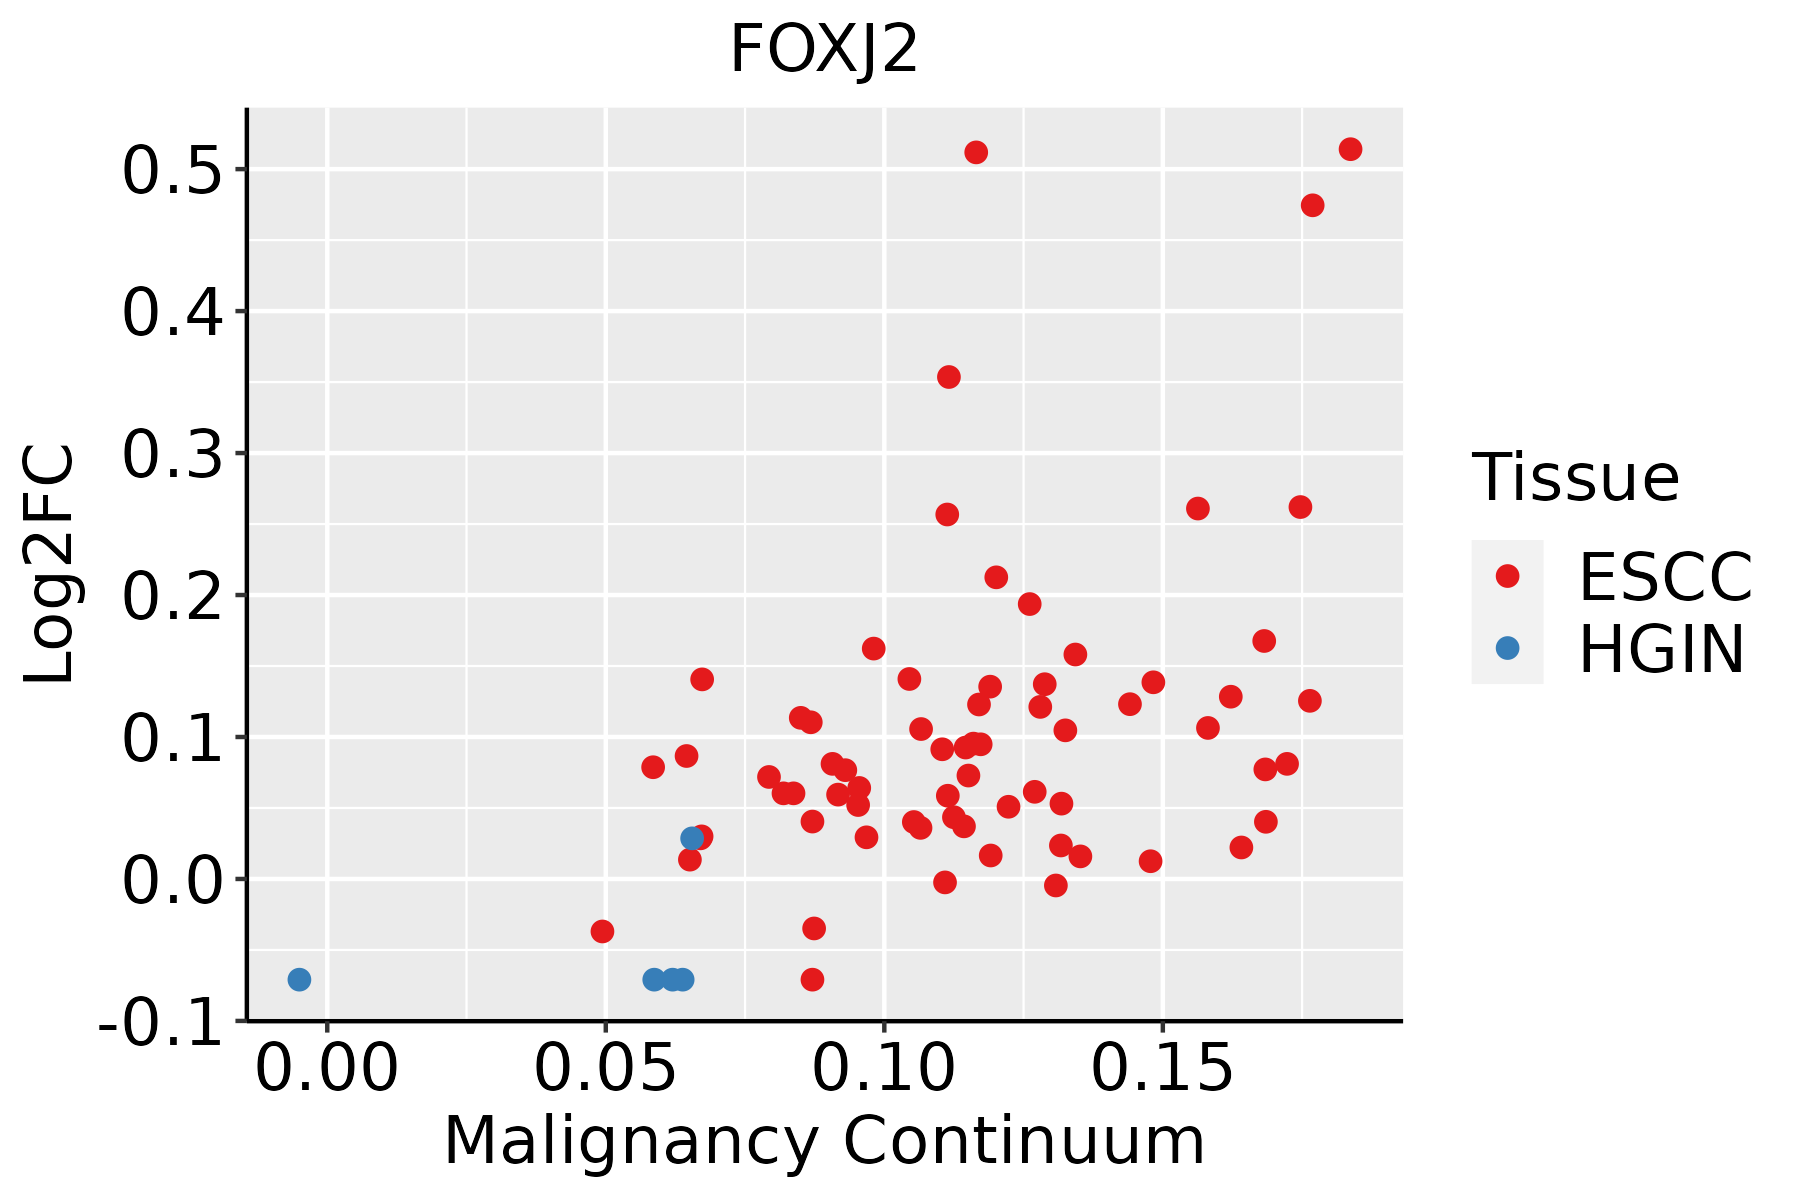 | ESCC: Esophageal squamous cell carcinoma |
| HGIN: High-grade intraepithelial neoplasias | ||
| LGIN: Low-grade intraepithelial neoplasias |
| ∗log2FC in expression of this searched gene in stem-like cells from each diseased tissue sample relative to stem-like cells in normal samples in each tissue plotted against the malignancy continuum. Samples are colored based on if they are from different disease stage. |
Top |
Malignant transformation related pathway analysis |
| Find out the enriched GO biological processes and KEGG pathways involved in transition from healthy to precancer to cancer |
| Tissue | Disease Stage | Enriched GO biological Processes |
| Colorectum | AD |  |
| Colorectum | SER |  |
| Colorectum | MSS |  |
| Colorectum | MSI-H |  |
| Colorectum | FAP |  |
| ∗Top 15 enriched GO BP terms are showed in the bar plot of each disease state in each tissue. Each row represents a significant GO biological process which is colored according to the -log10(p.adjust). |
| Page: 1 2 3 4 5 6 7 8 9 |
| GO ID | Tissue | Disease Stage | Description | Gene Ratio | Bg Ratio | pvalue | p.adjust | Count |
| GO:00482853 | Esophagus | ESCC | organelle fission | 301/8552 | 488/18723 | 4.64e-13 | 2.12e-11 | 301 |
| GO:00002802 | Esophagus | ESCC | nuclear division | 270/8552 | 439/18723 | 1.17e-11 | 4.24e-10 | 270 |
| GO:00486597 | Esophagus | ESCC | smooth muscle cell proliferation | 103/8552 | 184/18723 | 3.08e-03 | 1.28e-02 | 103 |
| GO:00486607 | Esophagus | ESCC | regulation of smooth muscle cell proliferation | 100/8552 | 180/18723 | 4.76e-03 | 1.85e-02 | 100 |
| GO:00330025 | Esophagus | ESCC | muscle cell proliferation | 134/8552 | 248/18723 | 4.80e-03 | 1.86e-02 | 134 |
| GO:00486615 | Esophagus | ESCC | positive regulation of smooth muscle cell proliferation | 61/8552 | 104/18723 | 5.22e-03 | 1.97e-02 | 61 |
| GO:004544610 | Esophagus | ESCC | endothelial cell differentiation | 67/8552 | 118/18723 | 9.86e-03 | 3.40e-02 | 67 |
| GO:000315818 | Esophagus | ESCC | endothelium development | 76/8552 | 136/18723 | 1.05e-02 | 3.59e-02 | 76 |
| Page: 1 |
| Pathway ID | Tissue | Disease Stage | Description | Gene Ratio | Bg Ratio | pvalue | p.adjust | qvalue | Count |
| Page: 1 |
Top |
Cell-cell communication analysis |
| Identification of potential cell-cell interactions between two cell types and their ligand-receptor pairs for different disease states |
| Ligand | Receptor | LRpair | Pathway | Tissue | Disease Stage |
| Page: 1 |
Top |
Single-cell gene regulatory network inference analysis |
| Find out the significant the regulons (TFs) and the target genes of each regulon across cell types for different disease states |
| TF | Cell Type | Tissue | Disease Stage | Target Gene | RSS | Regulon Activity |
| FOXJ2 | CD8TRM | Cervix | CC | ACKR1,ZNF512,USP51, etc. | 1.56e-01 |  |
| FOXJ2 | ICAF | Cervix | HSIL_HPV | FOXC1,CSF2RB,DNAJB11, etc. | 1.44e-02 |  |
| FOXJ2 | CAF | Liver | Healthy | LTB,FAM65B,CD3D, etc. | 4.08e-01 |  |
| FOXJ2 | CAF | Liver | NAFLD | LTB,FAM65B,CD3D, etc. | 6.32e-01 |  |
| FOXJ2 | SMC | Pancreas | PDAC | WDR74,KCTD12,AC105942.1, etc. | 3.45e-02 |  |
| FOXJ2 | MAIT | Stomach | CSG | TNFSF9,PLAG1,MSC-AS1, etc. | 1.94e-02 |  |
| ∗The dot plots of a searched regulon are shown for all cell subpopulations in each disease state of each tissue based on the regulon specific score inferred using pySCENIC and by calculating the average expression. |
| Page: 1 |
Top |
Somatic mutation of malignant transformation related genes |
| Annotation of somatic variants for genes involved in malignant transformation |
| Hugo Symbol | Variant Class | Variant Classification | dbSNP RS | HGVSc | HGVSp | HGVSp Short | SWISSPROT | BIOTYPE | SIFT | PolyPhen | Tumor Sample Barcode | Tissue | Histology | Sex | Age | Stage | Therapy Types | Drugs | Outcome |
| FOXJ2 | SNV | Missense_Mutation | c.723N>A | p.Phe241Leu | p.F241L | Q9P0K8 | protein_coding | tolerated(0.91) | probably_damaging(0.931) | TCGA-AN-A046-01 | Breast | breast invasive carcinoma | Female | >=65 | I/II | Unknown | Unknown | SD | |
| FOXJ2 | SNV | Missense_Mutation | c.838N>A | p.Asp280Asn | p.D280N | Q9P0K8 | protein_coding | tolerated(0.22) | probably_damaging(0.971) | TCGA-AN-A046-01 | Breast | breast invasive carcinoma | Female | >=65 | I/II | Unknown | Unknown | SD | |
| FOXJ2 | SNV | Missense_Mutation | c.1613A>G | p.Asp538Gly | p.D538G | Q9P0K8 | protein_coding | tolerated(0.08) | benign(0.078) | TCGA-E2-A15J-01 | Breast | breast invasive carcinoma | Female | <65 | I/II | Chemotherapy | docetaxel | SD | |
| FOXJ2 | insertion | Nonsense_Mutation | novel | c.297_298insAAGTGGGGTTTTTCTTTTTTCAAACCCATTCCTACATAGT | p.Phe100LysfsTer13 | p.F100Kfs*13 | Q9P0K8 | protein_coding | TCGA-AN-A046-01 | Breast | breast invasive carcinoma | Female | >=65 | I/II | Unknown | Unknown | SD | ||
| FOXJ2 | SNV | Missense_Mutation | c.344G>A | p.Arg115Gln | p.R115Q | Q9P0K8 | protein_coding | deleterious(0) | probably_damaging(0.994) | TCGA-C5-A1M6-01 | Cervix | cervical & endocervical cancer | Female | <65 | I/II | Chemotherapy | cisplatin | PD | |
| FOXJ2 | SNV | Missense_Mutation | c.273G>T | p.Glu91Asp | p.E91D | Q9P0K8 | protein_coding | deleterious(0) | benign(0.429) | TCGA-FU-A3HZ-01 | Cervix | cervical & endocervical cancer | Female | <65 | I/II | Chemotherapy | cisplatin | CR | |
| FOXJ2 | SNV | Missense_Mutation | c.73N>A | p.Glu25Lys | p.E25K | Q9P0K8 | protein_coding | deleterious(0.04) | benign(0.01) | TCGA-IR-A3LF-01 | Cervix | cervical & endocervical cancer | Female | <65 | I/II | Unknown | Unknown | SD | |
| FOXJ2 | SNV | Missense_Mutation | c.611N>G | p.Tyr204Cys | p.Y204C | Q9P0K8 | protein_coding | deleterious(0.02) | possibly_damaging(0.52) | TCGA-AA-3510-01 | Colorectum | colon adenocarcinoma | Male | >=65 | I/II | Unknown | Unknown | SD | |
| FOXJ2 | SNV | Missense_Mutation | c.75N>T | p.Glu25Asp | p.E25D | Q9P0K8 | protein_coding | deleterious(0.02) | benign(0.054) | TCGA-AA-A010-01 | Colorectum | colon adenocarcinoma | Female | <65 | I/II | Chemotherapy | folinic | CR | |
| FOXJ2 | SNV | Missense_Mutation | c.1630C>T | p.Arg544Cys | p.R544C | Q9P0K8 | protein_coding | deleterious(0.01) | probably_damaging(0.982) | TCGA-CM-6674-01 | Colorectum | colon adenocarcinoma | Male | <65 | I/II | Unknown | Unknown | SD |
| Page: 1 2 3 4 5 6 |
Top |
Related drugs of malignant transformation related genes |
| Identification of chemicals and drugs interact with genes involved in malignant transfromation |
| (DGIdb 4.0) |
| Entrez ID | Symbol | Category | Interaction Types | Drug Claim Name | Drug Name | PMIDs |
| Page: 1 |

Copyright 2023-Present -The University of Texas Health Science Center at Houston |