
|
|||||
|
 | |
| |
| |
| |
| |
| |
|
Gene: FOXE1 |
Gene summary for FOXE1 |
| Gene information | Species | Human | Gene symbol | FOXE1 | Gene ID | 2304 |
| Gene name | forkhead box E1 | |
| Gene Alias | FKHL15 | |
| Cytomap | 9q22.33 | |
| Gene Type | protein-coding | GO ID | GO:0000122 | UniProtAcc | O00358 |
Top |
Malignant transformation analysis |
| Identification of the aberrant gene expression in precancerous and cancerous lesions by comparing the gene expression of stem-like cells in diseased tissues with normal stem cells |
| Entrez ID | Symbol | Replicates | Species | Organ | Tissue | Adj P-value | Log2FC | Malignancy |
| 2304 | FOXE1 | LZE2T | Human | Esophagus | ESCC | 1.20e-03 | 3.40e-01 | 0.082 |
| 2304 | FOXE1 | LZE4T | Human | Esophagus | ESCC | 4.87e-08 | 2.39e-01 | 0.0811 |
| 2304 | FOXE1 | LZE7T | Human | Esophagus | ESCC | 5.54e-05 | 3.61e-01 | 0.0667 |
| 2304 | FOXE1 | LZE21D1 | Human | Esophagus | HGIN | 7.26e-04 | 4.63e-01 | 0.0632 |
| 2304 | FOXE1 | LZE22T | Human | Esophagus | ESCC | 4.95e-02 | 1.70e-01 | 0.068 |
| 2304 | FOXE1 | LZE24T | Human | Esophagus | ESCC | 2.35e-07 | 1.48e-01 | 0.0596 |
| 2304 | FOXE1 | LZE21T | Human | Esophagus | ESCC | 3.67e-07 | 7.37e-01 | 0.0655 |
| 2304 | FOXE1 | P1T-E | Human | Esophagus | ESCC | 6.63e-03 | 2.37e-01 | 0.0875 |
| 2304 | FOXE1 | P2T-E | Human | Esophagus | ESCC | 2.32e-04 | 1.28e-01 | 0.1177 |
| 2304 | FOXE1 | P4T-E | Human | Esophagus | ESCC | 9.52e-14 | 3.81e-01 | 0.1323 |
| 2304 | FOXE1 | P8T-E | Human | Esophagus | ESCC | 1.13e-04 | 1.08e-01 | 0.0889 |
| 2304 | FOXE1 | P9T-E | Human | Esophagus | ESCC | 7.88e-40 | 1.08e+00 | 0.1131 |
| 2304 | FOXE1 | P10T-E | Human | Esophagus | ESCC | 5.16e-66 | 1.17e+00 | 0.116 |
| 2304 | FOXE1 | P11T-E | Human | Esophagus | ESCC | 5.52e-08 | 3.80e-01 | 0.1426 |
| 2304 | FOXE1 | P12T-E | Human | Esophagus | ESCC | 7.00e-23 | 5.89e-01 | 0.1122 |
| 2304 | FOXE1 | P15T-E | Human | Esophagus | ESCC | 1.05e-40 | 8.81e-01 | 0.1149 |
| 2304 | FOXE1 | P20T-E | Human | Esophagus | ESCC | 1.02e-09 | 1.05e-01 | 0.1124 |
| 2304 | FOXE1 | P21T-E | Human | Esophagus | ESCC | 1.94e-03 | 1.01e-01 | 0.1617 |
| 2304 | FOXE1 | P22T-E | Human | Esophagus | ESCC | 9.97e-14 | 3.53e-01 | 0.1236 |
| 2304 | FOXE1 | P23T-E | Human | Esophagus | ESCC | 1.67e-14 | 4.09e-01 | 0.108 |
| Page: 1 2 3 4 |
| Tissue | Expression Dynamics | Abbreviation |
| Esophagus | 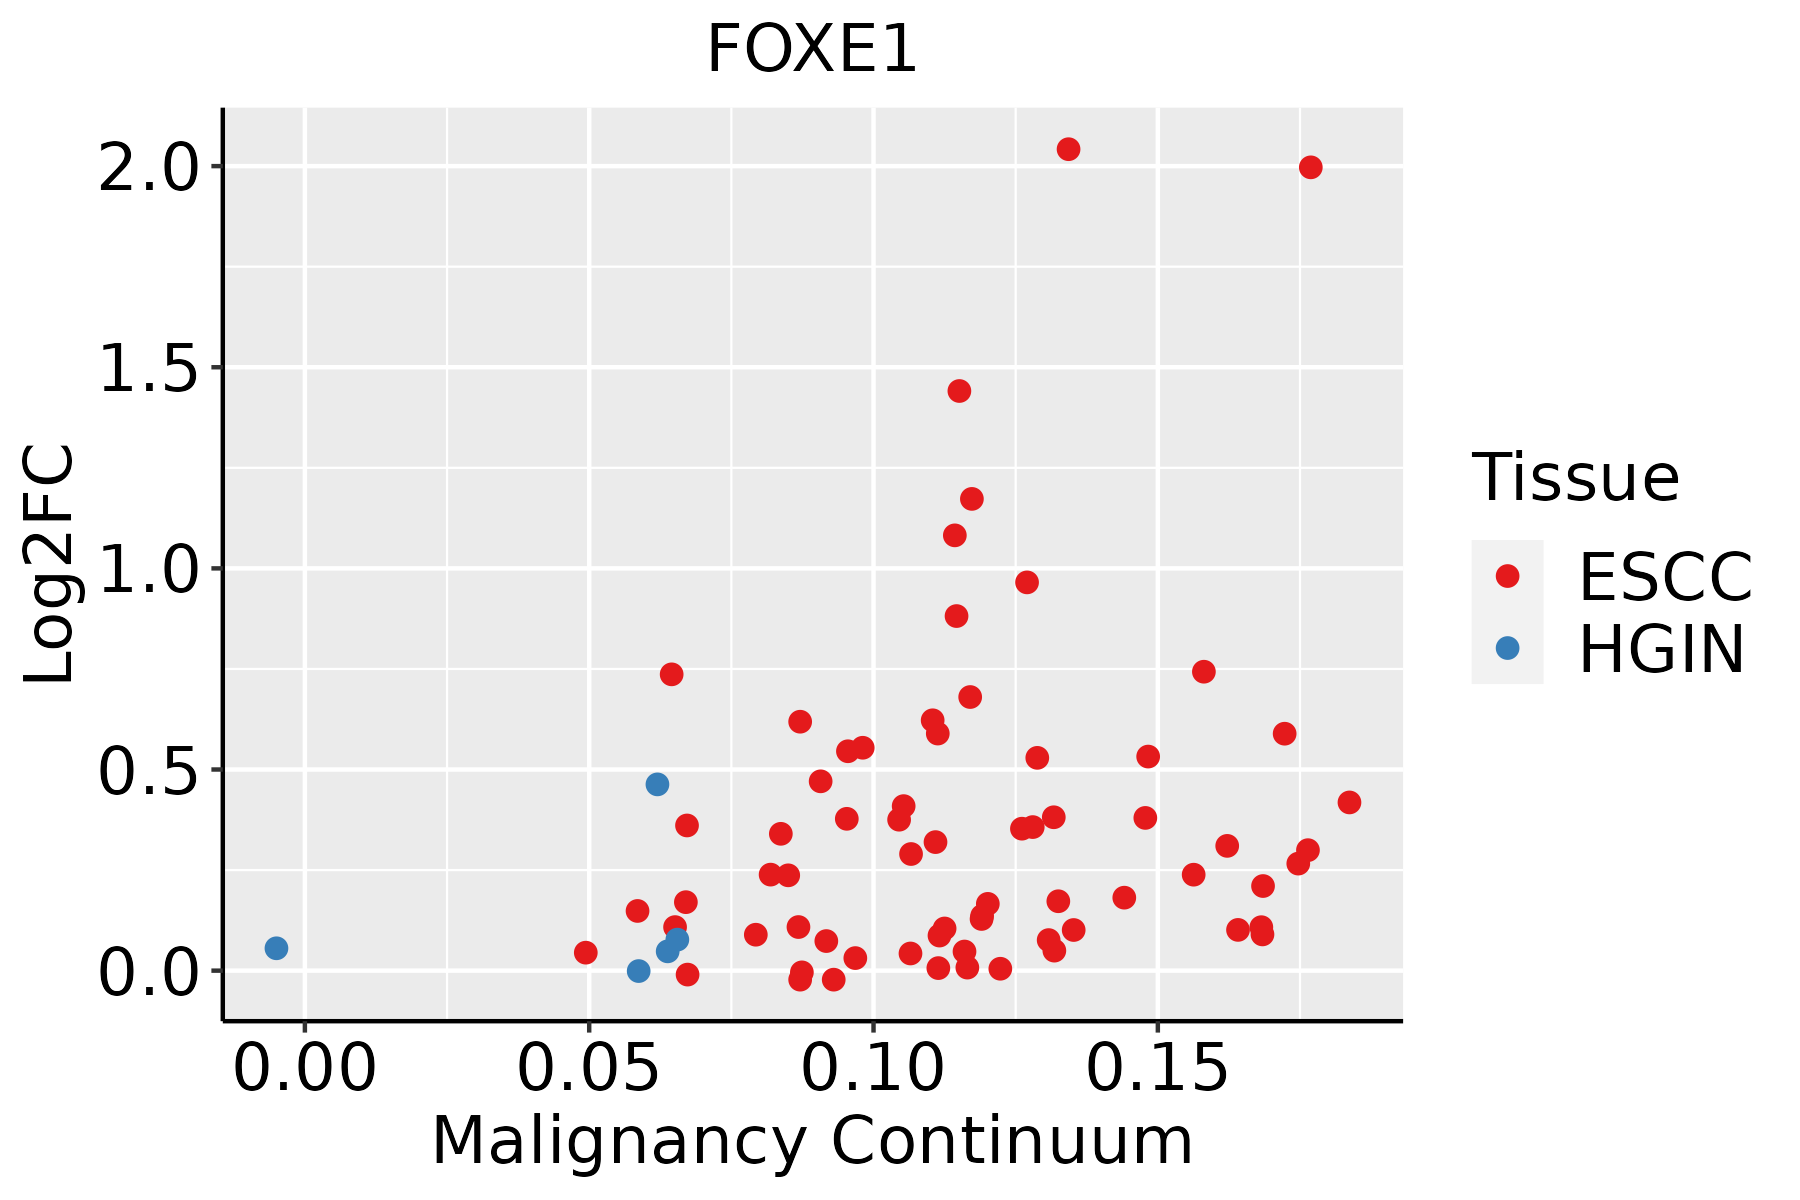 | ESCC: Esophageal squamous cell carcinoma |
| HGIN: High-grade intraepithelial neoplasias | ||
| LGIN: Low-grade intraepithelial neoplasias | ||
| Oral Cavity | 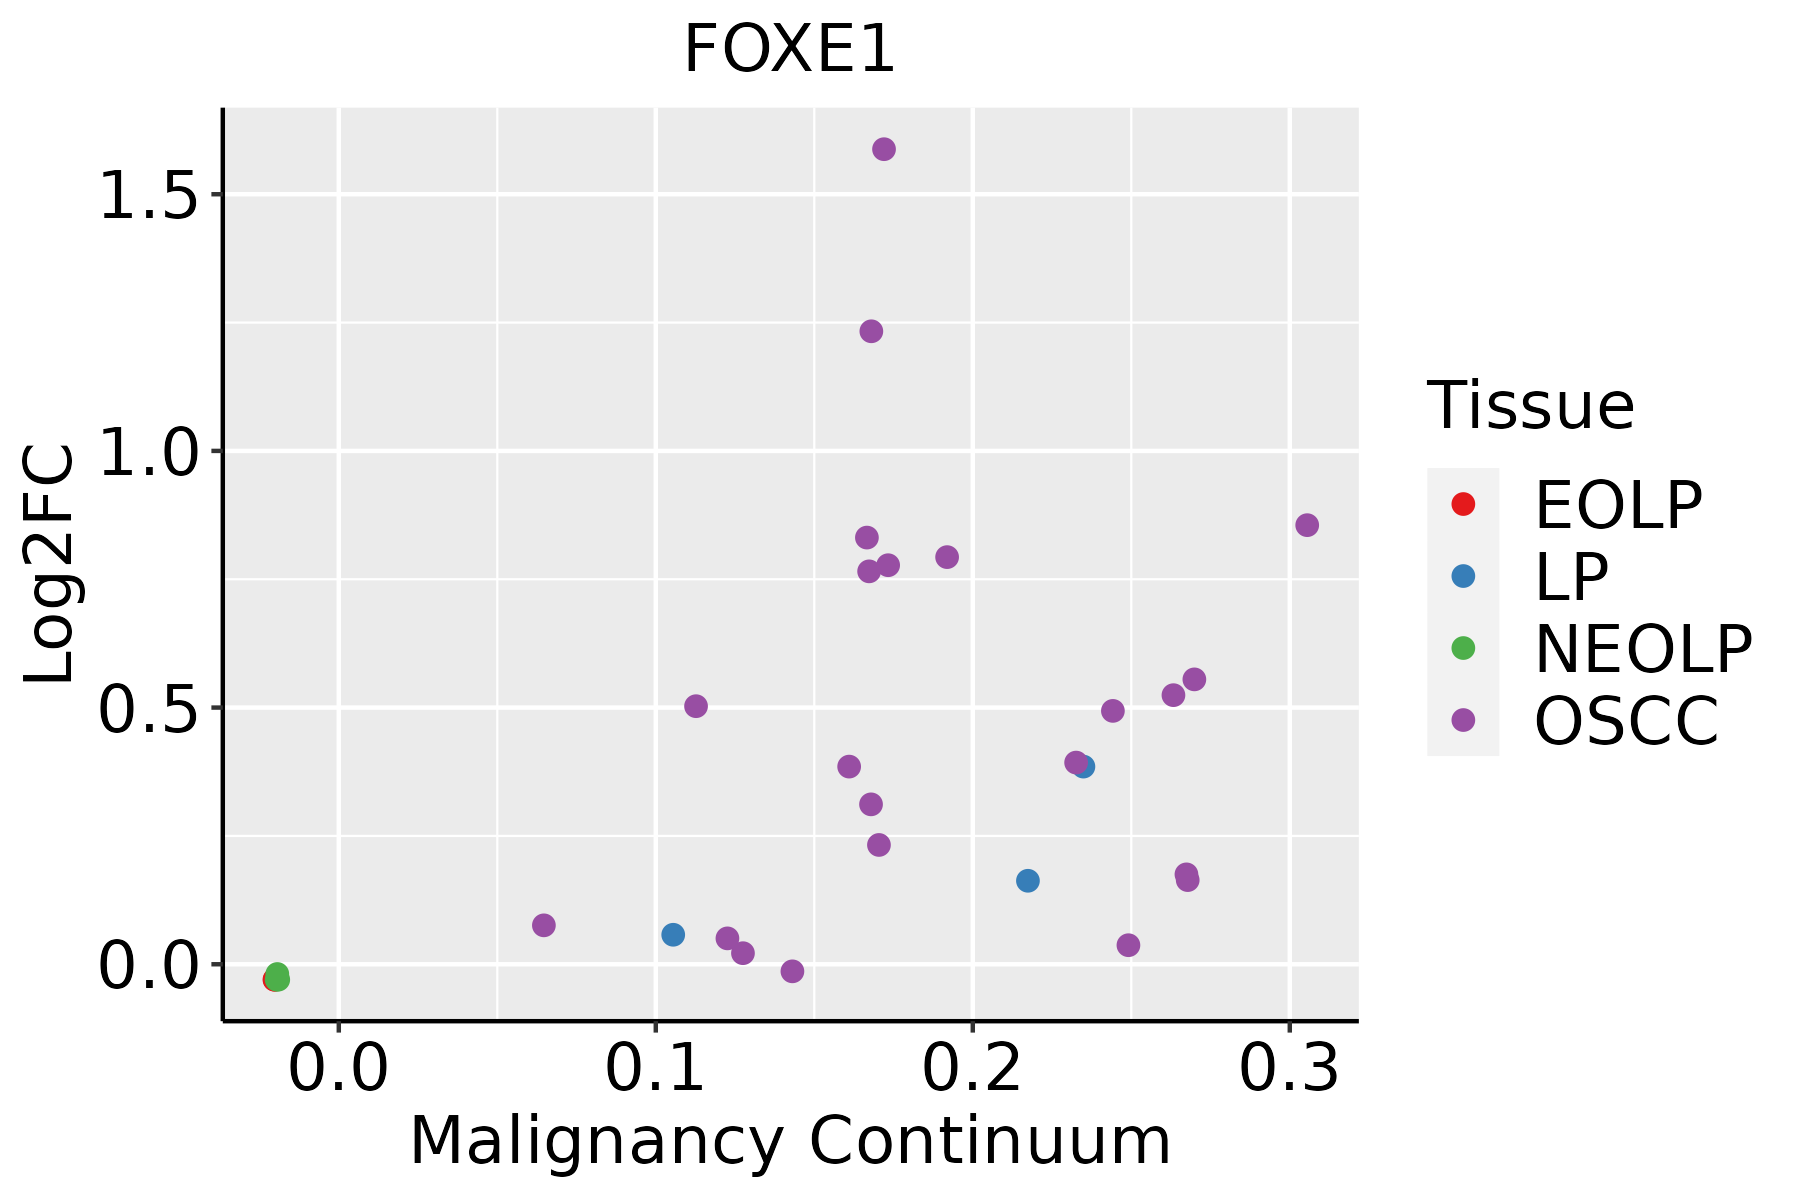 | EOLP: Erosive Oral lichen planus |
| LP: leukoplakia | ||
| NEOLP: Non-erosive oral lichen planus | ||
| OSCC: Oral squamous cell carcinoma | ||
| Thyroid | 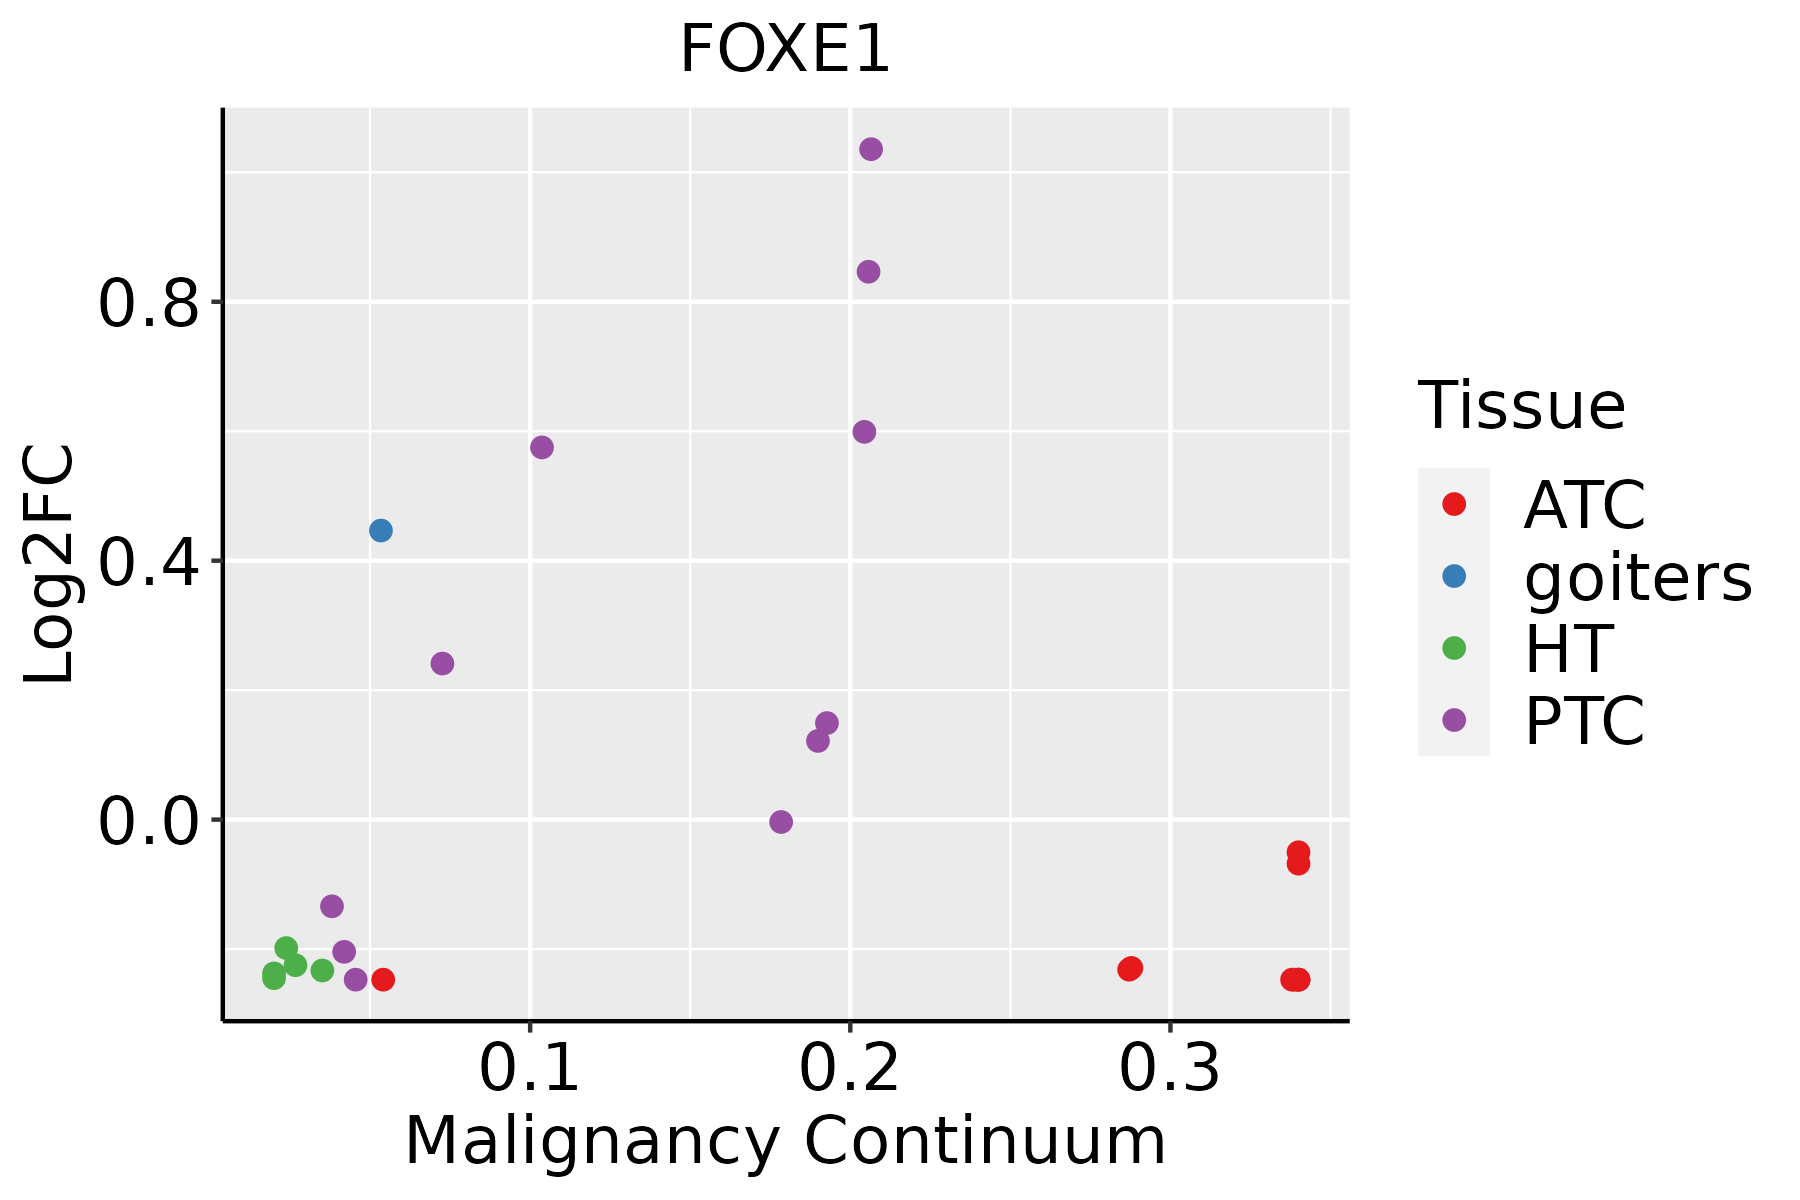 | ATC: Anaplastic thyroid cancer |
| HT: Hashimoto's thyroiditis | ||
| PTC: Papillary thyroid cancer |
| ∗log2FC in expression of this searched gene in stem-like cells from each diseased tissue sample relative to stem-like cells in normal samples in each tissue plotted against the malignancy continuum. Samples are colored based on if they are from different disease stage. |
Top |
Malignant transformation related pathway analysis |
| Find out the enriched GO biological processes and KEGG pathways involved in transition from healthy to precancer to cancer |
| Tissue | Disease Stage | Enriched GO biological Processes |
| Colorectum | AD |  |
| Colorectum | SER |  |
| Colorectum | MSS |  |
| Colorectum | MSI-H |  |
| Colorectum | FAP |  |
| ∗Top 15 enriched GO BP terms are showed in the bar plot of each disease state in each tissue. Each row represents a significant GO biological process which is colored according to the -log10(p.adjust). |
| Page: 1 2 3 4 5 6 7 8 9 |
| GO ID | Tissue | Disease Stage | Description | Gene Ratio | Bg Ratio | pvalue | p.adjust | Count |
| GO:004873225 | Esophagus | HGIN | gland development | 88/2587 | 436/18723 | 1.34e-04 | 2.71e-03 | 88 |
| GO:0048732111 | Esophagus | ESCC | gland development | 269/8552 | 436/18723 | 7.81e-12 | 2.95e-10 | 269 |
| GO:00435888 | Esophagus | ESCC | skin development | 163/8552 | 263/18723 | 6.48e-08 | 1.14e-06 | 163 |
| GO:000854410 | Esophagus | ESCC | epidermis development | 193/8552 | 324/18723 | 2.87e-07 | 4.19e-06 | 193 |
| GO:00065757 | Esophagus | ESCC | cellular modified amino acid metabolic process | 112/8552 | 188/18723 | 8.31e-05 | 6.06e-04 | 112 |
| GO:00485386 | Esophagus | ESCC | thymus development | 33/8552 | 45/18723 | 1.54e-04 | 1.02e-03 | 33 |
| GO:00485687 | Esophagus | ESCC | embryonic organ development | 228/8552 | 427/18723 | 7.28e-04 | 3.79e-03 | 228 |
| GO:00224043 | Esophagus | ESCC | molting cycle process | 53/8552 | 84/18723 | 9.62e-04 | 4.88e-03 | 53 |
| GO:00224053 | Esophagus | ESCC | hair cycle process | 53/8552 | 84/18723 | 9.62e-04 | 4.88e-03 | 53 |
| GO:0001942 | Esophagus | ESCC | hair follicle development | 51/8552 | 81/18723 | 1.27e-03 | 6.14e-03 | 51 |
| GO:0098773 | Esophagus | ESCC | skin epidermis development | 53/8552 | 85/18723 | 1.43e-03 | 6.77e-03 | 53 |
| GO:00423033 | Esophagus | ESCC | molting cycle | 64/8552 | 107/18723 | 2.24e-03 | 9.85e-03 | 64 |
| GO:00426333 | Esophagus | ESCC | hair cycle | 64/8552 | 107/18723 | 2.24e-03 | 9.85e-03 | 64 |
| GO:0060021 | Esophagus | ESCC | roof of mouth development | 50/8552 | 85/18723 | 1.00e-02 | 3.42e-02 | 50 |
| GO:19048881 | Esophagus | ESCC | cranial skeletal system development | 41/8552 | 68/18723 | 1.07e-02 | 3.66e-02 | 41 |
| GO:004873220 | Oral cavity | OSCC | gland development | 226/7305 | 436/18723 | 2.78e-08 | 5.39e-07 | 226 |
| GO:00435887 | Oral cavity | OSCC | skin development | 143/7305 | 263/18723 | 2.77e-07 | 4.27e-06 | 143 |
| GO:00085449 | Oral cavity | OSCC | epidermis development | 171/7305 | 324/18723 | 2.89e-07 | 4.43e-06 | 171 |
| GO:00485385 | Oral cavity | OSCC | thymus development | 30/7305 | 45/18723 | 1.58e-04 | 1.10e-03 | 30 |
| GO:00065756 | Oral cavity | OSCC | cellular modified amino acid metabolic process | 91/7305 | 188/18723 | 5.33e-03 | 2.07e-02 | 91 |
| Page: 1 2 |
| Pathway ID | Tissue | Disease Stage | Description | Gene Ratio | Bg Ratio | pvalue | p.adjust | qvalue | Count |
| Page: 1 |
Top |
Cell-cell communication analysis |
| Identification of potential cell-cell interactions between two cell types and their ligand-receptor pairs for different disease states |
| Ligand | Receptor | LRpair | Pathway | Tissue | Disease Stage |
| Page: 1 |
Top |
Single-cell gene regulatory network inference analysis |
| Find out the significant the regulons (TFs) and the target genes of each regulon across cell types for different disease states |
| TF | Cell Type | Tissue | Disease Stage | Target Gene | RSS | Regulon Activity |
| FOXE1 | STM | Thyroid | goiters | PAX8,METTL7A,MT-ATP8, etc. | 6.95e-01 |  |
| ∗The dot plots of a searched regulon are shown for all cell subpopulations in each disease state of each tissue based on the regulon specific score inferred using pySCENIC and by calculating the average expression. |
| Page: 1 |
Top |
Somatic mutation of malignant transformation related genes |
| Annotation of somatic variants for genes involved in malignant transformation |
| Hugo Symbol | Variant Class | Variant Classification | dbSNP RS | HGVSc | HGVSp | HGVSp Short | SWISSPROT | BIOTYPE | SIFT | PolyPhen | Tumor Sample Barcode | Tissue | Histology | Sex | Age | Stage | Therapy Types | Drugs | Outcome |
| FOXE1 | SNV | Missense_Mutation | c.349G>C | p.Glu117Gln | p.E117Q | O00358 | protein_coding | deleterious(0) | probably_damaging(0.983) | TCGA-UC-A7PF-01 | Cervix | cervical & endocervical cancer | Female | <65 | I/II | Unknown | Unknown | SD | |
| FOXE1 | SNV | Missense_Mutation | novel | c.134N>A | p.Arg45His | p.R45H | O00358 | protein_coding | deleterious(0) | benign(0.273) | TCGA-VS-A8EC-01 | Cervix | cervical & endocervical cancer | Female | <65 | III/IV | Chemotherapy | carboplatin | CR |
| FOXE1 | SNV | Missense_Mutation | c.1039G>A | p.Gly347Arg | p.G347R | O00358 | protein_coding | deleterious(0) | benign(0.027) | TCGA-VS-A9UU-01 | Cervix | cervical & endocervical cancer | Female | <65 | I/II | Chemotherapy | cisplatin | CR | |
| FOXE1 | SNV | Missense_Mutation | novel | c.884N>T | p.Ala295Val | p.A295V | O00358 | protein_coding | tolerated(0.46) | benign(0.043) | TCGA-5M-AAT6-01 | Colorectum | colon adenocarcinoma | Female | <65 | III/IV | Unknown | Unknown | PD |
| FOXE1 | SNV | Missense_Mutation | rs777292713 | c.433C>T | p.Arg145Cys | p.R145C | O00358 | protein_coding | deleterious(0) | probably_damaging(0.997) | TCGA-A6-2686-01 | Colorectum | colon adenocarcinoma | Female | >=65 | I/II | Unknown | Unknown | SD |
| FOXE1 | SNV | Missense_Mutation | c.346N>T | p.Arg116Cys | p.R116C | O00358 | protein_coding | deleterious(0) | probably_damaging(0.999) | TCGA-A6-6780-01 | Colorectum | colon adenocarcinoma | Male | >=65 | I/II | Unknown | Unknown | SD | |
| FOXE1 | SNV | Missense_Mutation | novel | c.232N>A | p.Gly78Ser | p.G78S | O00358 | protein_coding | deleterious(0) | benign(0.343) | TCGA-AA-3947-01 | Colorectum | colon adenocarcinoma | Female | <65 | I/II | Unknown | Unknown | SD |
| FOXE1 | SNV | Missense_Mutation | c.430N>T | p.Arg144Cys | p.R144C | O00358 | protein_coding | deleterious(0) | probably_damaging(0.997) | TCGA-G4-6320-01 | Colorectum | colon adenocarcinoma | Male | >=65 | III/IV | Chemotherapy | oxaliplatin | SD | |
| FOXE1 | SNV | Missense_Mutation | c.437G>A | p.Arg146His | p.R146H | O00358 | protein_coding | deleterious(0) | probably_damaging(0.996) | TCGA-WS-AB45-01 | Colorectum | colon adenocarcinoma | Female | <65 | I/II | Unknown | Unknown | SD | |
| FOXE1 | SNV | Missense_Mutation | novel | c.1108N>A | p.Val370Met | p.V370M | O00358 | protein_coding | tolerated(0.05) | possibly_damaging(0.57) | TCGA-AJ-A3BG-01 | Endometrium | uterine corpus endometrioid carcinoma | Female | >=65 | I/II | Chemotherapy | carboplatin | PD |
| Page: 1 2 3 |
Top |
Related drugs of malignant transformation related genes |
| Identification of chemicals and drugs interact with genes involved in malignant transfromation |
| (DGIdb 4.0) |
| Entrez ID | Symbol | Category | Interaction Types | Drug Claim Name | Drug Name | PMIDs |
| Page: 1 |

Copyright 2023-Present -The University of Texas Health Science Center at Houston |