
|
|||||
|
 | |
| |
| |
| |
| |
| |
|
Gene: FOXD1 |
Gene summary for FOXD1 |
| Gene information | Species | Human | Gene symbol | FOXD1 | Gene ID | 2297 |
| Gene name | forkhead box D1 | |
| Gene Alias | FKHL8 | |
| Cytomap | 5q13.2 | |
| Gene Type | protein-coding | GO ID | GO:0000902 | UniProtAcc | Q16676 |
Top |
Malignant transformation analysis |
| Identification of the aberrant gene expression in precancerous and cancerous lesions by comparing the gene expression of stem-like cells in diseased tissues with normal stem cells |
| Entrez ID | Symbol | Replicates | Species | Organ | Tissue | Adj P-value | Log2FC | Malignancy |
| 2297 | FOXD1 | C04 | Human | Oral cavity | OSCC | 3.59e-05 | 2.42e-01 | 0.2633 |
| 2297 | FOXD1 | C21 | Human | Oral cavity | OSCC | 5.81e-29 | 7.11e-01 | 0.2678 |
| 2297 | FOXD1 | C30 | Human | Oral cavity | OSCC | 3.74e-18 | 6.15e-01 | 0.3055 |
| 2297 | FOXD1 | C43 | Human | Oral cavity | OSCC | 1.62e-02 | 9.96e-02 | 0.1704 |
| 2297 | FOXD1 | C08 | Human | Oral cavity | OSCC | 6.26e-05 | 1.50e-01 | 0.1919 |
| 2297 | FOXD1 | SYSMH1 | Human | Oral cavity | OSCC | 3.22e-04 | 1.58e-01 | 0.1127 |
| 2297 | FOXD1 | SYSMH2 | Human | Oral cavity | OSCC | 1.75e-02 | 2.28e-01 | 0.2326 |
| 2297 | FOXD1 | SYSMH3 | Human | Oral cavity | OSCC | 2.33e-15 | 4.19e-01 | 0.2442 |
| 2297 | FOXD1 | SYSMH5 | Human | Oral cavity | OSCC | 4.12e-03 | 1.48e-01 | 0.0647 |
| 2297 | FOXD1 | ATC11 | Human | Thyroid | ATC | 1.60e-07 | 5.04e-01 | 0.3386 |
| 2297 | FOXD1 | ATC12 | Human | Thyroid | ATC | 2.80e-17 | 3.80e-01 | 0.34 |
| 2297 | FOXD1 | ATC13 | Human | Thyroid | ATC | 7.27e-33 | 6.24e-01 | 0.34 |
| 2297 | FOXD1 | ATC2 | Human | Thyroid | ATC | 9.94e-09 | 7.17e-01 | 0.34 |
| 2297 | FOXD1 | ATC3 | Human | Thyroid | ATC | 4.34e-11 | 5.39e-01 | 0.338 |
| 2297 | FOXD1 | ATC4 | Human | Thyroid | ATC | 2.14e-21 | 4.68e-01 | 0.34 |
| 2297 | FOXD1 | ATC5 | Human | Thyroid | ATC | 4.37e-34 | 6.71e-01 | 0.34 |
| Page: 1 |
| Tissue | Expression Dynamics | Abbreviation |
| Oral Cavity |  | EOLP: Erosive Oral lichen planus |
| LP: leukoplakia | ||
| NEOLP: Non-erosive oral lichen planus | ||
| OSCC: Oral squamous cell carcinoma | ||
| Thyroid | 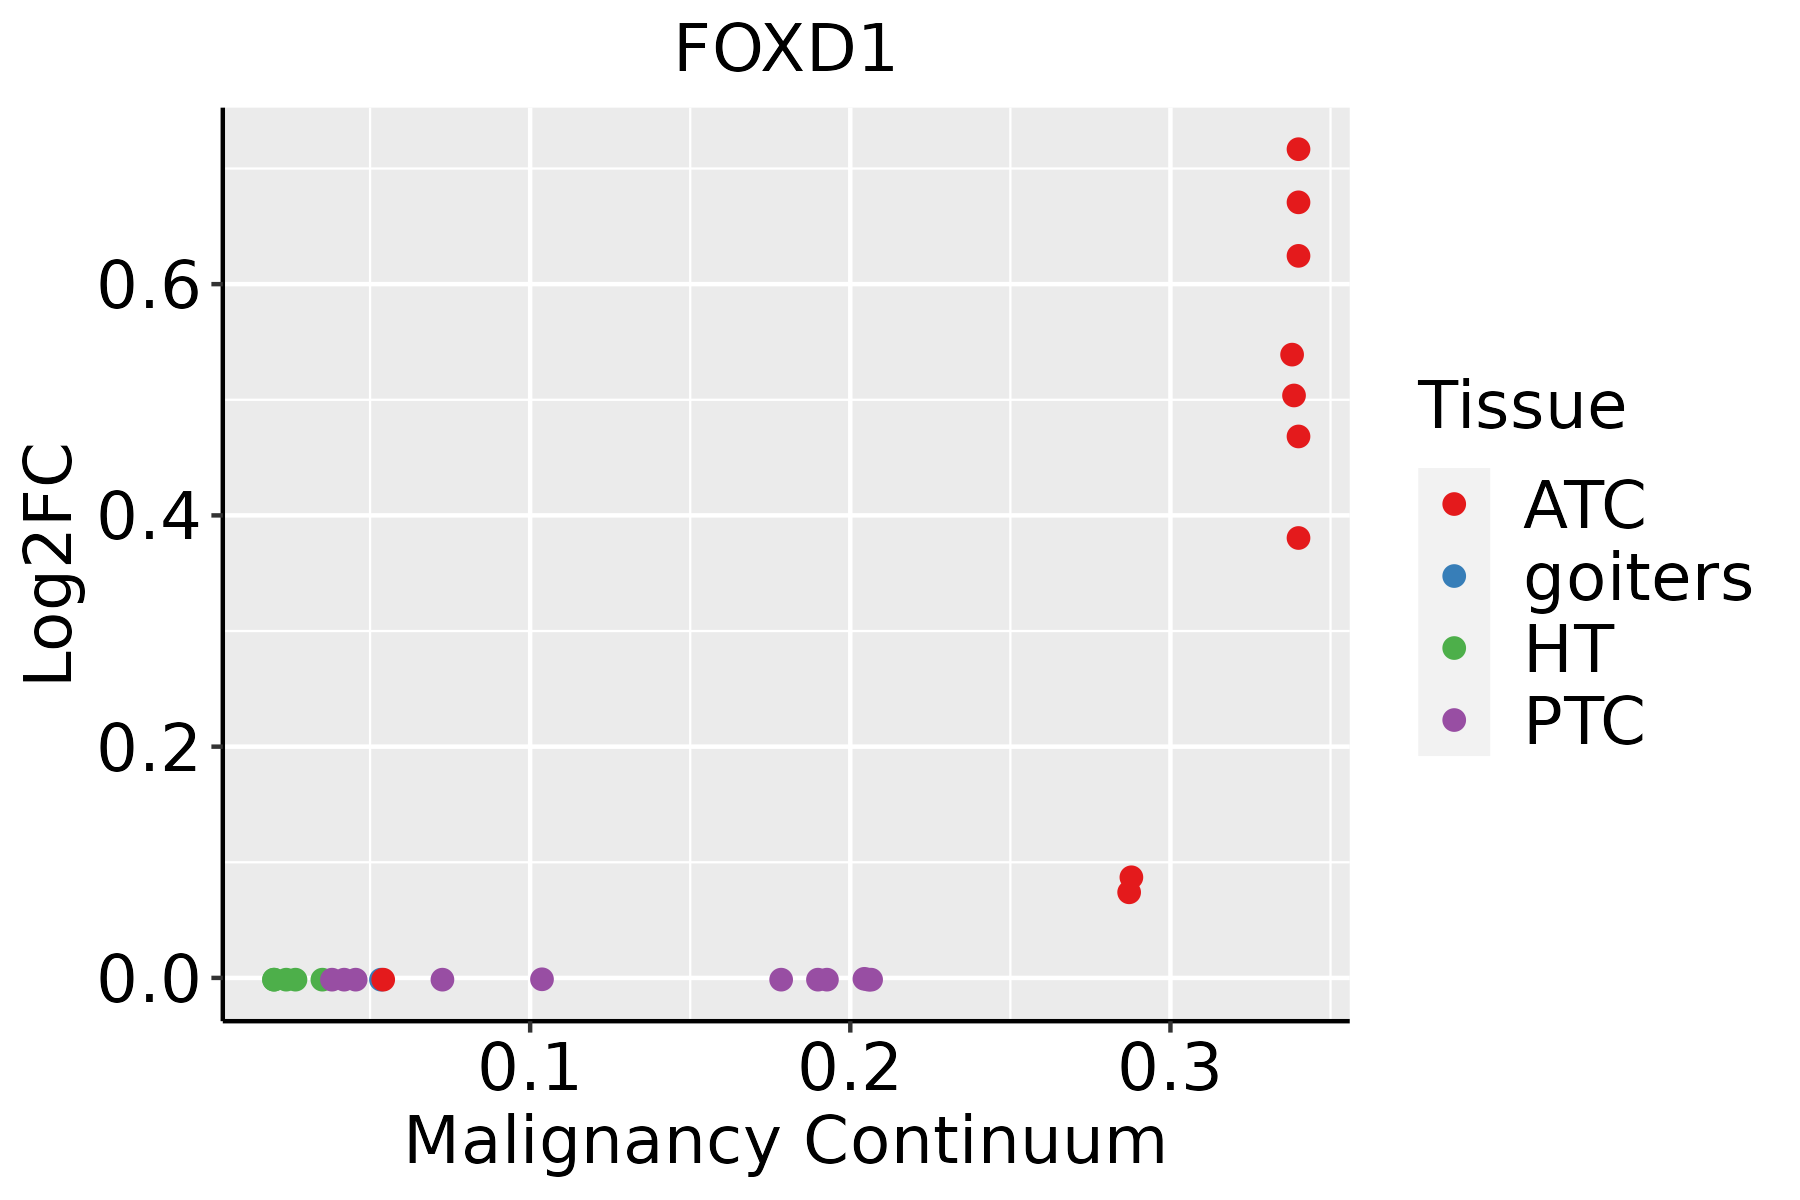 | ATC: Anaplastic thyroid cancer |
| HT: Hashimoto's thyroiditis | ||
| PTC: Papillary thyroid cancer |
| ∗log2FC in expression of this searched gene in stem-like cells from each diseased tissue sample relative to stem-like cells in normal samples in each tissue plotted against the malignancy continuum. Samples are colored based on if they are from different disease stage. |
Top |
Malignant transformation related pathway analysis |
| Find out the enriched GO biological processes and KEGG pathways involved in transition from healthy to precancer to cancer |
| Tissue | Disease Stage | Enriched GO biological Processes |
| Colorectum | AD |  |
| Colorectum | SER |  |
| Colorectum | MSS |  |
| Colorectum | MSI-H |  |
| Colorectum | FAP |  |
| ∗Top 15 enriched GO BP terms are showed in the bar plot of each disease state in each tissue. Each row represents a significant GO biological process which is colored according to the -log10(p.adjust). |
| Page: 1 2 3 4 5 6 7 8 9 |
| GO ID | Tissue | Disease Stage | Description | Gene Ratio | Bg Ratio | pvalue | p.adjust | Count |
| GO:00016558 | Oral cavity | OSCC | urogenital system development | 160/7305 | 338/18723 | 1.03e-03 | 5.31e-03 | 160 |
| GO:00071789 | Oral cavity | OSCC | transmembrane receptor protein serine/threonine kinase signaling pathway | 165/7305 | 355/18723 | 2.31e-03 | 1.02e-02 | 165 |
| GO:00605629 | Oral cavity | OSCC | epithelial tube morphogenesis | 149/7305 | 325/18723 | 6.73e-03 | 2.50e-02 | 149 |
| GO:006156410 | Oral cavity | OSCC | axon development | 207/7305 | 467/18723 | 1.01e-02 | 3.51e-02 | 207 |
| GO:006156423 | Thyroid | ATC | axon development | 220/6293 | 467/18723 | 6.85e-10 | 1.80e-08 | 220 |
| GO:000740919 | Thyroid | ATC | axonogenesis | 197/6293 | 418/18723 | 5.09e-09 | 1.13e-07 | 197 |
| GO:000182222 | Thyroid | ATC | kidney development | 146/6293 | 293/18723 | 5.81e-09 | 1.28e-07 | 146 |
| GO:000165522 | Thyroid | ATC | urogenital system development | 164/6293 | 338/18723 | 7.92e-09 | 1.70e-07 | 164 |
| GO:007200122 | Thyroid | ATC | renal system development | 149/6293 | 302/18723 | 9.48e-09 | 1.99e-07 | 149 |
| GO:000717823 | Thyroid | ATC | transmembrane receptor protein serine/threonine kinase signaling pathway | 170/6293 | 355/18723 | 1.40e-08 | 2.87e-07 | 170 |
| GO:006056222 | Thyroid | ATC | epithelial tube morphogenesis | 156/6293 | 325/18723 | 4.48e-08 | 8.14e-07 | 156 |
| GO:006048521 | Thyroid | ATC | mesenchyme development | 136/6293 | 291/18723 | 2.04e-06 | 2.43e-05 | 136 |
| GO:009028721 | Thyroid | ATC | regulation of cellular response to growth factor stimulus | 140/6293 | 304/18723 | 3.91e-06 | 4.33e-05 | 140 |
| GO:000176317 | Thyroid | ATC | morphogenesis of a branching structure | 96/6293 | 196/18723 | 5.68e-06 | 6.04e-05 | 96 |
| GO:009009214 | Thyroid | ATC | regulation of transmembrane receptor protein serine/threonine kinase signaling pathway | 120/6293 | 256/18723 | 6.62e-06 | 6.85e-05 | 120 |
| GO:006113815 | Thyroid | ATC | morphogenesis of a branching epithelium | 88/6293 | 182/18723 | 2.55e-05 | 2.20e-04 | 88 |
| GO:007207322 | Thyroid | ATC | kidney epithelium development | 68/6293 | 136/18723 | 5.50e-05 | 4.24e-04 | 68 |
| GO:007200614 | Thyroid | ATC | nephron development | 69/6293 | 142/18723 | 1.50e-04 | 1.04e-03 | 69 |
| GO:007216321 | Thyroid | ATC | mesonephric epithelium development | 48/6293 | 92/18723 | 1.81e-04 | 1.22e-03 | 48 |
| GO:007216421 | Thyroid | ATC | mesonephric tubule development | 48/6293 | 92/18723 | 1.81e-04 | 1.22e-03 | 48 |
| Page: 1 2 |
| Pathway ID | Tissue | Disease Stage | Description | Gene Ratio | Bg Ratio | pvalue | p.adjust | qvalue | Count |
| Page: 1 |
Top |
Cell-cell communication analysis |
| Identification of potential cell-cell interactions between two cell types and their ligand-receptor pairs for different disease states |
| Ligand | Receptor | LRpair | Pathway | Tissue | Disease Stage |
| Page: 1 |
Top |
Single-cell gene regulatory network inference analysis |
| Find out the significant the regulons (TFs) and the target genes of each regulon across cell types for different disease states |
| TF | Cell Type | Tissue | Disease Stage | Target Gene | RSS | Regulon Activity |
| FOXD1 | MYOFIB | Prostate | Healthy | GLUL,IGFBP6,SLC2A1, etc. | 4.01e-02 |  |
| FOXD1 | ICAF | Prostate | Tumor | GLUL,IGFBP6,SLC2A1, etc. | 1.30e-02 |  |
| ∗The dot plots of a searched regulon are shown for all cell subpopulations in each disease state of each tissue based on the regulon specific score inferred using pySCENIC and by calculating the average expression. |
| Page: 1 |
Top |
Somatic mutation of malignant transformation related genes |
| Annotation of somatic variants for genes involved in malignant transformation |
| Hugo Symbol | Variant Class | Variant Classification | dbSNP RS | HGVSc | HGVSp | HGVSp Short | SWISSPROT | BIOTYPE | SIFT | PolyPhen | Tumor Sample Barcode | Tissue | Histology | Sex | Age | Stage | Therapy Types | Drugs | Outcome |
| FOXD1 | SNV | Missense_Mutation | novel | c.160N>T | p.Arg54Trp | p.R54W | Q16676 | protein_coding | deleterious_low_confidence(0.04) | possibly_damaging(0.853) | TCGA-BH-A0W5-01 | Breast | breast invasive carcinoma | Female | >=65 | I/II | Hormone Therapy | arimidex | CR |
| FOXD1 | SNV | Missense_Mutation | novel | c.1300N>T | p.Ala434Ser | p.A434S | Q16676 | protein_coding | tolerated_low_confidence(0.32) | benign(0.24) | TCGA-WS-AB45-01 | Colorectum | colon adenocarcinoma | Female | <65 | I/II | Unknown | Unknown | SD |
| FOXD1 | SNV | Missense_Mutation | novel | c.559N>T | p.Pro187Ser | p.P187S | Q16676 | protein_coding | deleterious(0) | probably_damaging(0.997) | TCGA-A5-A0G2-01 | Endometrium | uterine corpus endometrioid carcinoma | Female | <65 | III/IV | Unknown | Unknown | SD |
| FOXD1 | SNV | Missense_Mutation | novel | c.155G>A | p.Arg52Gln | p.R52Q | Q16676 | protein_coding | tolerated_low_confidence(0.6) | possibly_damaging(0.602) | TCGA-A5-A7WJ-01 | Endometrium | uterine corpus endometrioid carcinoma | Female | <65 | I/II | Unknown | Unknown | SD |
| FOXD1 | SNV | Missense_Mutation | novel | c.591N>A | p.Asn197Lys | p.N197K | Q16676 | protein_coding | deleterious(0) | probably_damaging(0.986) | TCGA-AP-A1DK-01 | Endometrium | uterine corpus endometrioid carcinoma | Female | <65 | I/II | Unknown | Unknown | SD |
| FOXD1 | SNV | Missense_Mutation | novel | c.539N>C | p.Asn180Thr | p.N180T | Q16676 | protein_coding | deleterious(0) | probably_damaging(0.997) | TCGA-AX-A05Z-01 | Endometrium | uterine corpus endometrioid carcinoma | Female | <65 | III/IV | Chemotherapy | adriamycin | SD |
| FOXD1 | SNV | Missense_Mutation | novel | c.572N>A | p.Gly191Asp | p.G191D | Q16676 | protein_coding | deleterious(0) | probably_damaging(1) | TCGA-DF-A2KN-01 | Endometrium | uterine corpus endometrioid carcinoma | Female | Unknown | I/II | Unknown | Unknown | SD |
| FOXD1 | SNV | Missense_Mutation | rs765790973 | c.619N>A | p.Asp207Asn | p.D207N | Q16676 | protein_coding | deleterious(0) | probably_damaging(0.984) | TCGA-E6-A1LX-01 | Endometrium | uterine corpus endometrioid carcinoma | Female | <65 | I/II | Unknown | Unknown | SD |
| FOXD1 | SNV | Missense_Mutation | novel | c.581G>A | p.Gly194Asp | p.G194D | Q16676 | protein_coding | deleterious(0) | probably_damaging(1) | TCGA-LG-A9QC-01 | Liver | liver hepatocellular carcinoma | Male | <65 | I/II | Unknown | Unknown | SD |
| FOXD1 | SNV | Missense_Mutation | novel | c.368T>A | p.Leu123Gln | p.L123Q | Q16676 | protein_coding | deleterious(0) | probably_damaging(0.92) | TCGA-50-5931-01 | Lung | lung adenocarcinoma | Female | >=65 | I/II | Unknown | Unknown | PD |
| Page: 1 2 |
Top |
Related drugs of malignant transformation related genes |
| Identification of chemicals and drugs interact with genes involved in malignant transfromation |
| (DGIdb 4.0) |
| Entrez ID | Symbol | Category | Interaction Types | Drug Claim Name | Drug Name | PMIDs |
| Page: 1 |

Copyright 2023-Present -The University of Texas Health Science Center at Houston |