
|
|||||
|
 | |
| |
| |
| |
| |
| |
|
Gene: FOXC2 |
Gene summary for FOXC2 |
| Gene information | Species | Human | Gene symbol | FOXC2 | Gene ID | 2303 |
| Gene name | forkhead box C2 | |
| Gene Alias | FKHL14 | |
| Cytomap | 16q24.1 | |
| Gene Type | protein-coding | GO ID | GO:0000122 | UniProtAcc | Q99958 |
Top |
Malignant transformation analysis |
| Identification of the aberrant gene expression in precancerous and cancerous lesions by comparing the gene expression of stem-like cells in diseased tissues with normal stem cells |
| Entrez ID | Symbol | Replicates | Species | Organ | Tissue | Adj P-value | Log2FC | Malignancy |
| 2303 | FOXC2 | C30 | Human | Oral cavity | OSCC | 8.05e-05 | 5.40e-01 | 0.3055 |
| 2303 | FOXC2 | C43 | Human | Oral cavity | OSCC | 1.06e-02 | 3.16e-02 | 0.1704 |
| 2303 | FOXC2 | C09 | Human | Oral cavity | OSCC | 5.08e-29 | 9.70e-01 | 0.1431 |
| 2303 | FOXC2 | NEOLP-2 | Human | Oral cavity | NEOLP | 3.04e-03 | 1.47e-01 | -0.0196 |
| 2303 | FOXC2 | NEOLP-3 | Human | Oral cavity | NEOLP | 5.38e-04 | 1.31e-01 | -0.0191 |
| 2303 | FOXC2 | ATC11 | Human | Thyroid | ATC | 2.02e-16 | 1.27e+00 | 0.3386 |
| 2303 | FOXC2 | ATC13 | Human | Thyroid | ATC | 7.27e-33 | 6.02e-01 | 0.34 |
| 2303 | FOXC2 | ATC3 | Human | Thyroid | ATC | 4.14e-36 | 1.51e+00 | 0.338 |
| 2303 | FOXC2 | ATC5 | Human | Thyroid | ATC | 1.15e-38 | 6.39e-01 | 0.34 |
| Page: 1 |
| Tissue | Expression Dynamics | Abbreviation |
| Oral Cavity | 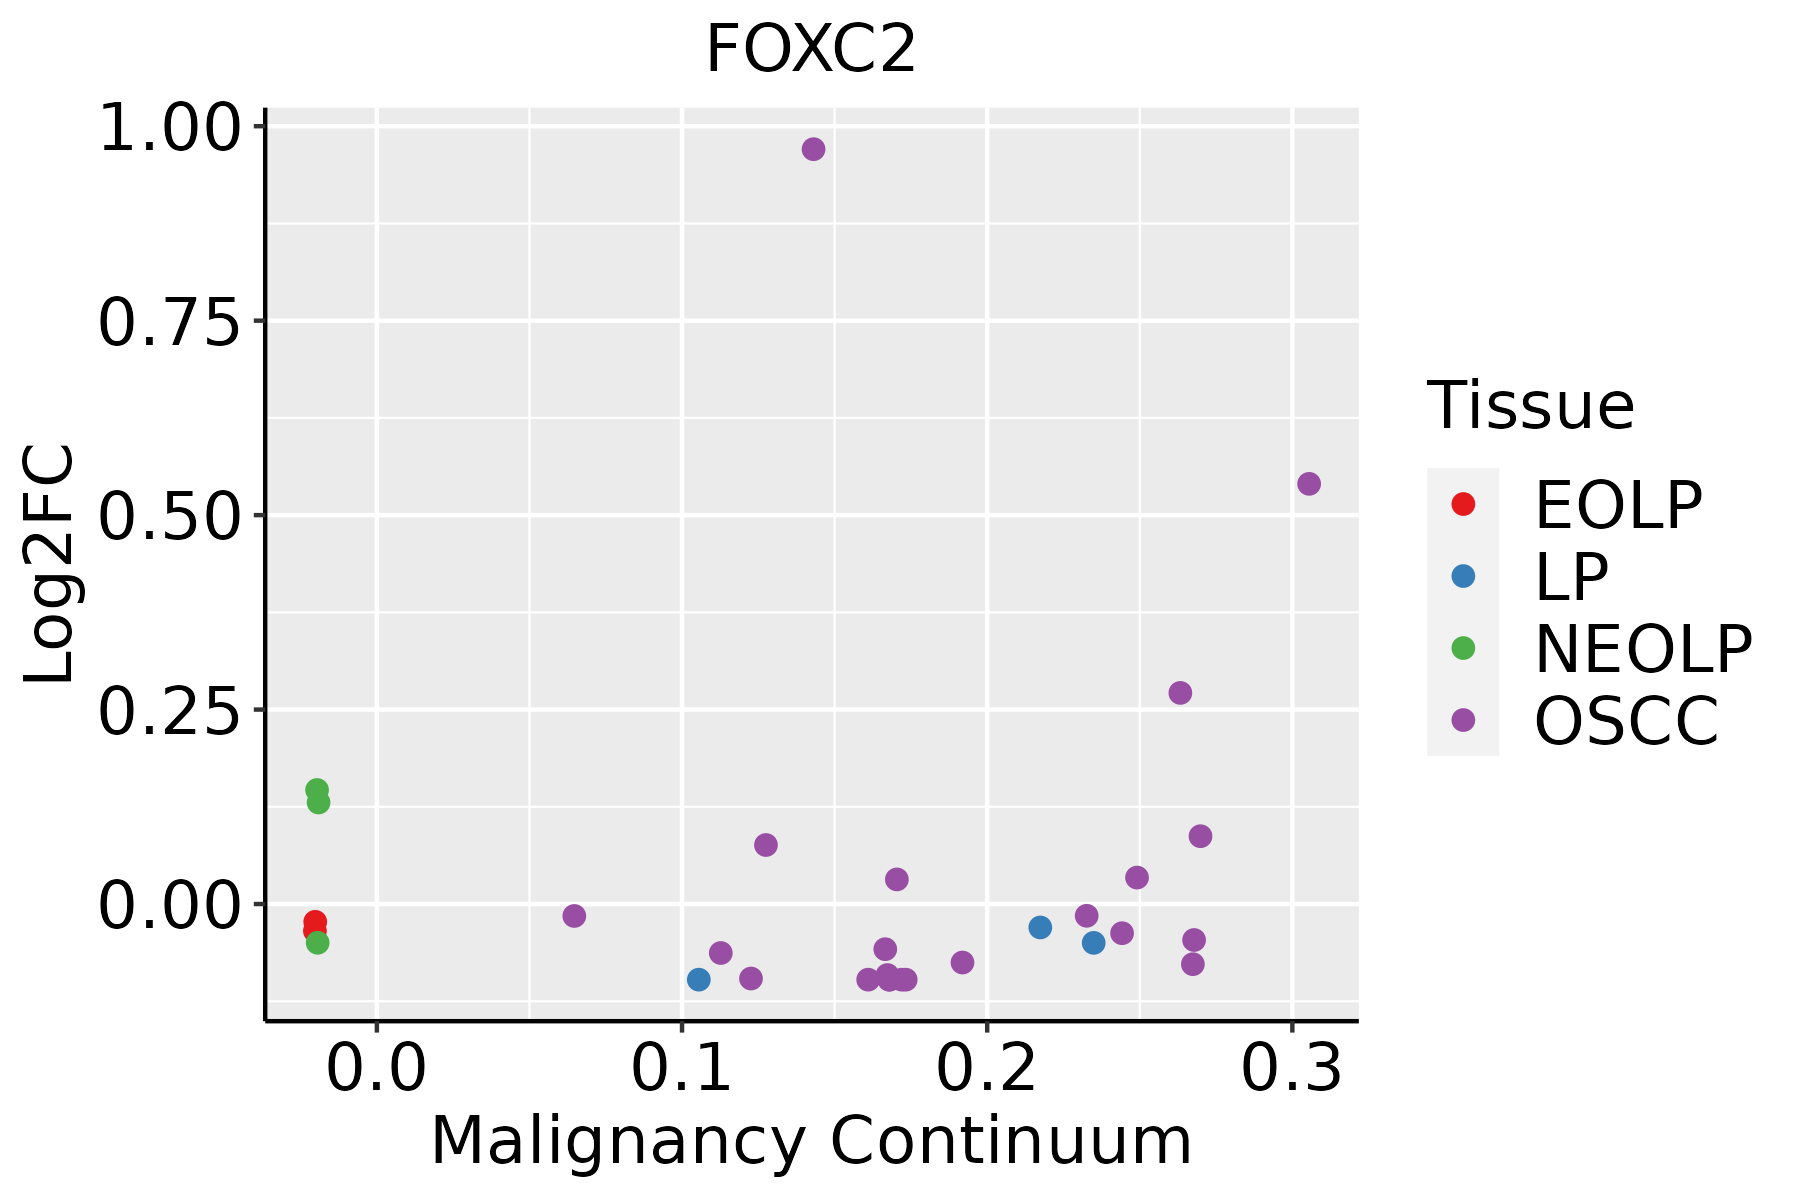 | EOLP: Erosive Oral lichen planus |
| LP: leukoplakia | ||
| NEOLP: Non-erosive oral lichen planus | ||
| OSCC: Oral squamous cell carcinoma | ||
| Thyroid | 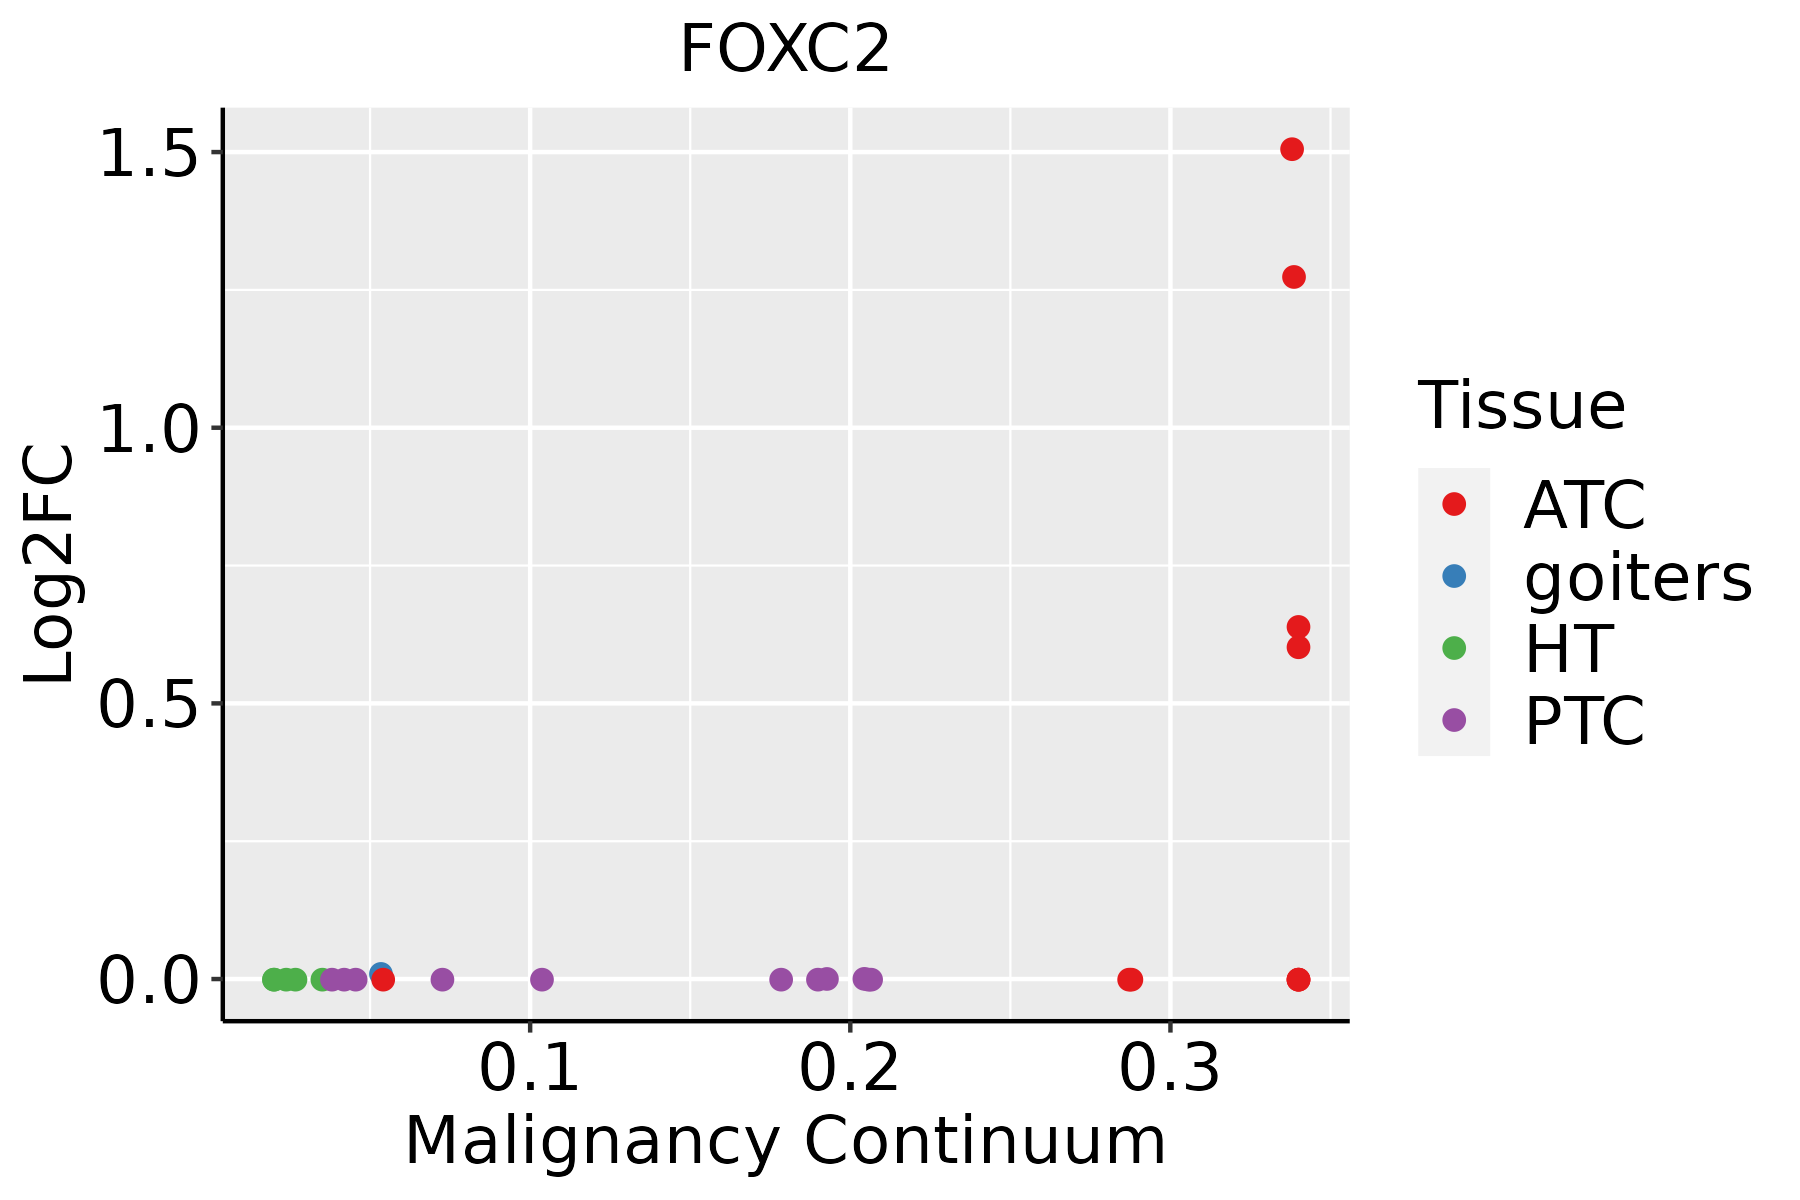 | ATC: Anaplastic thyroid cancer |
| HT: Hashimoto's thyroiditis | ||
| PTC: Papillary thyroid cancer |
| ∗log2FC in expression of this searched gene in stem-like cells from each diseased tissue sample relative to stem-like cells in normal samples in each tissue plotted against the malignancy continuum. Samples are colored based on if they are from different disease stage. |
Top |
Malignant transformation related pathway analysis |
| Find out the enriched GO biological processes and KEGG pathways involved in transition from healthy to precancer to cancer |
| Tissue | Disease Stage | Enriched GO biological Processes |
| Colorectum | AD |  |
| Colorectum | SER |  |
| Colorectum | MSS |  |
| Colorectum | MSI-H |  |
| Colorectum | FAP |  |
| ∗Top 15 enriched GO BP terms are showed in the bar plot of each disease state in each tissue. Each row represents a significant GO biological process which is colored according to the -log10(p.adjust). |
| Page: 1 2 3 4 5 6 7 8 9 |
| GO ID | Tissue | Disease Stage | Description | Gene Ratio | Bg Ratio | pvalue | p.adjust | Count |
| GO:004206020 | Oral cavity | OSCC | wound healing | 237/7305 | 422/18723 | 4.51e-13 | 2.18e-11 | 237 |
| GO:190165316 | Oral cavity | OSCC | cellular response to peptide | 194/7305 | 359/18723 | 4.31e-09 | 9.57e-08 | 194 |
| GO:004578520 | Oral cavity | OSCC | positive regulation of cell adhesion | 225/7305 | 437/18723 | 6.06e-08 | 1.09e-06 | 225 |
| GO:003286916 | Oral cavity | OSCC | cellular response to insulin stimulus | 114/7305 | 203/18723 | 5.07e-07 | 7.41e-06 | 114 |
| GO:007137510 | Oral cavity | OSCC | cellular response to peptide hormone stimulus | 153/7305 | 290/18723 | 1.23e-06 | 1.63e-05 | 153 |
| GO:004343419 | Oral cavity | OSCC | response to peptide hormone | 208/7305 | 414/18723 | 1.83e-06 | 2.35e-05 | 208 |
| GO:000150310 | Oral cavity | OSCC | ossification | 203/7305 | 408/18723 | 5.54e-06 | 6.19e-05 | 203 |
| GO:003286816 | Oral cavity | OSCC | response to insulin | 138/7305 | 264/18723 | 7.54e-06 | 8.15e-05 | 138 |
| GO:00336274 | Oral cavity | OSCC | cell adhesion mediated by integrin | 46/7305 | 72/18723 | 1.66e-05 | 1.64e-04 | 46 |
| GO:000206419 | Oral cavity | OSCC | epithelial cell development | 116/7305 | 220/18723 | 2.34e-05 | 2.21e-04 | 116 |
| GO:00082868 | Oral cavity | OSCC | insulin receptor signaling pathway | 67/7305 | 116/18723 | 3.23e-05 | 2.91e-04 | 67 |
| GO:000166719 | Oral cavity | OSCC | ameboidal-type cell migration | 228/7305 | 475/18723 | 3.46e-05 | 3.10e-04 | 228 |
| GO:00072196 | Oral cavity | OSCC | Notch signaling pathway | 92/7305 | 172/18723 | 7.84e-05 | 6.08e-04 | 92 |
| GO:001063118 | Oral cavity | OSCC | epithelial cell migration | 174/7305 | 357/18723 | 1.04e-04 | 7.70e-04 | 174 |
| GO:009013218 | Oral cavity | OSCC | epithelium migration | 175/7305 | 360/18723 | 1.18e-04 | 8.54e-04 | 175 |
| GO:009013018 | Oral cavity | OSCC | tissue migration | 176/7305 | 365/18723 | 1.92e-04 | 1.29e-03 | 176 |
| GO:190303418 | Oral cavity | OSCC | regulation of response to wounding | 87/7305 | 167/18723 | 3.91e-04 | 2.38e-03 | 87 |
| GO:00073697 | Oral cavity | OSCC | gastrulation | 95/7305 | 185/18723 | 4.17e-04 | 2.54e-03 | 95 |
| GO:00301983 | Oral cavity | OSCC | extracellular matrix organization | 146/7305 | 301/18723 | 4.67e-04 | 2.77e-03 | 146 |
| GO:00452293 | Oral cavity | OSCC | external encapsulating structure organization | 147/7305 | 304/18723 | 5.30e-04 | 3.08e-03 | 147 |
| Page: 1 2 3 4 5 6 7 8 9 10 11 |
| Pathway ID | Tissue | Disease Stage | Description | Gene Ratio | Bg Ratio | pvalue | p.adjust | qvalue | Count |
| Page: 1 |
Top |
Cell-cell communication analysis |
| Identification of potential cell-cell interactions between two cell types and their ligand-receptor pairs for different disease states |
| Ligand | Receptor | LRpair | Pathway | Tissue | Disease Stage |
| Page: 1 |
Top |
Single-cell gene regulatory network inference analysis |
| Find out the significant the regulons (TFs) and the target genes of each regulon across cell types for different disease states |
| TF | Cell Type | Tissue | Disease Stage | Target Gene | RSS | Regulon Activity |
| FOXC2 | MYOEPI | Breast | Healthy | MT1E,MT2A,ITGB4, etc. | 3.15e-01 |  |
| FOXC2 | MYOFIB | Breast | ADJ | WDR5,ARC,CCDC3, etc. | 3.06e-01 |  |
| FOXC2 | SMC | Breast | Healthy | WDR5,ARC,CCDC3, etc. | 1.35e-01 | |
| FOXC2 | MYOFIB | Breast | Precancer | WDR5,ARC,CCDC3, etc. | 3.04e-01 |  |
| FOXC2 | MYOFIB | Cervix | CC | C1QTNF1,SUSD5,ADIRF, etc. | 3.06e-01 |  |
| FOXC2 | KER | Esophagus | LGIN | IER5,NFATC2,MMP1, etc. | 1.00e+00 |  |
| FOXC2 | PERI | Liver | Cirrhotic | CLDN11,SLC24A1,NTS, etc. | 1.11e-01 |  |
| FOXC2 | SMC | Liver | Cirrhotic | CLDN11,SLC24A1,NTS, etc. | 1.29e-01 | |
| FOXC2 | PFIB | Liver | Cirrhotic | CLDN11,SLC24A1,NTS, etc. | 1.51e-01 | |
| FOXC2 | PERI | Liver | HCC | CLDN11,SLC24A1,NTS, etc. | 2.67e-01 |  |
| ∗The dot plots of a searched regulon are shown for all cell subpopulations in each disease state of each tissue based on the regulon specific score inferred using pySCENIC and by calculating the average expression. |
| Page: 1 2 |
Top |
Somatic mutation of malignant transformation related genes |
| Annotation of somatic variants for genes involved in malignant transformation |
| Hugo Symbol | Variant Class | Variant Classification | dbSNP RS | HGVSc | HGVSp | HGVSp Short | SWISSPROT | BIOTYPE | SIFT | PolyPhen | Tumor Sample Barcode | Tissue | Histology | Sex | Age | Stage | Therapy Types | Drugs | Outcome |
| FOXC2 | SNV | Missense_Mutation | c.406N>T | p.Asp136Tyr | p.D136Y | Q99958 | protein_coding | deleterious(0) | probably_damaging(0.995) | TCGA-AC-A23H-01 | Breast | breast invasive carcinoma | Female | >=65 | I/II | Unknown | Unknown | PD | |
| FOXC2 | SNV | Missense_Mutation | c.455C>G | p.Ser152Cys | p.S152C | Q99958 | protein_coding | deleterious(0.02) | possibly_damaging(0.627) | TCGA-D8-A1XQ-01 | Breast | breast invasive carcinoma | Female | >=65 | I/II | Unknown | Unknown | SD | |
| FOXC2 | insertion | Nonsense_Mutation | novel | c.91_92insGAATACAA | p.Tyr31Ter | p.Y31* | Q99958 | protein_coding | TCGA-AN-A04C-01 | Breast | breast invasive carcinoma | Female | <65 | I/II | Unknown | Unknown | SD | ||
| FOXC2 | SNV | Missense_Mutation | c.1354N>A | p.Glu452Lys | p.E452K | Q99958 | protein_coding | deleterious(0) | probably_damaging(0.978) | TCGA-FU-A23K-01 | Cervix | cervical & endocervical cancer | Female | <65 | III/IV | Unknown | Unknown | SD | |
| FOXC2 | SNV | Missense_Mutation | novel | c.66N>C | p.Gln22His | p.Q22H | Q99958 | protein_coding | deleterious(0) | possibly_damaging(0.804) | TCGA-VS-A8EL-01 | Cervix | cervical & endocervical cancer | Female | <65 | I/II | Chemotherapy | cisplatin | CR |
| FOXC2 | SNV | Missense_Mutation | c.118N>A | p.Val40Ile | p.V40I | Q99958 | protein_coding | deleterious(0.01) | possibly_damaging(0.448) | TCGA-CM-6166-01 | Colorectum | colon adenocarcinoma | Female | <65 | I/II | Unknown | Unknown | SD | |
| FOXC2 | SNV | Missense_Mutation | c.404N>A | p.Arg135His | p.R135H | Q99958 | protein_coding | deleterious(0) | probably_damaging(1) | TCGA-DM-A0XD-01 | Colorectum | colon adenocarcinoma | Male | >=65 | I/II | Unknown | Unknown | PD | |
| FOXC2 | SNV | Missense_Mutation | c.1319N>G | p.Phe440Cys | p.F440C | Q99958 | protein_coding | deleterious(0.01) | possibly_damaging(0.85) | TCGA-G4-6323-01 | Colorectum | colon adenocarcinoma | Male | <65 | I/II | Unknown | Unknown | SD | |
| FOXC2 | SNV | Missense_Mutation | c.376N>G | p.Leu126Val | p.L126V | Q99958 | protein_coding | deleterious(0) | probably_damaging(0.994) | TCGA-DC-4745-01 | Colorectum | rectum adenocarcinoma | Female | <65 | III/IV | Chemotherapy | 5-fluorouracil | SD | |
| FOXC2 | SNV | Missense_Mutation | novel | c.1373G>A | p.Arg458Gln | p.R458Q | Q99958 | protein_coding | deleterious(0) | probably_damaging(0.988) | TCGA-EI-6507-01 | Colorectum | rectum adenocarcinoma | Male | <65 | I/II | Unknown | Unknown | SD |
| Page: 1 2 3 4 5 |
Top |
Related drugs of malignant transformation related genes |
| Identification of chemicals and drugs interact with genes involved in malignant transfromation |
| (DGIdb 4.0) |
| Entrez ID | Symbol | Category | Interaction Types | Drug Claim Name | Drug Name | PMIDs |
| 2303 | FOXC2 | DRUG RESISTANCE, TRANSCRIPTION FACTOR | OXALIPLATIN | OXALIPLATIN | 32110058 |
| Page: 1 |

Copyright 2023-Present -The University of Texas Health Science Center at Houston |