
|
|||||
|
 | |
| |
| |
| |
| |
| |
|
Gene: FOXC1 |
Gene summary for FOXC1 |
| Gene information | Species | Human | Gene symbol | FOXC1 | Gene ID | 2296 |
| Gene name | forkhead box C1 | |
| Gene Alias | ARA | |
| Cytomap | 6p25.3 | |
| Gene Type | protein-coding | GO ID | GO:0000003 | UniProtAcc | Q12948 |
Top |
Malignant transformation analysis |
| Identification of the aberrant gene expression in precancerous and cancerous lesions by comparing the gene expression of stem-like cells in diseased tissues with normal stem cells |
| Entrez ID | Symbol | Replicates | Species | Organ | Tissue | Adj P-value | Log2FC | Malignancy |
| 2296 | FOXC1 | LZE4T | Human | Esophagus | ESCC | 1.93e-02 | -3.22e-01 | 0.0811 |
| 2296 | FOXC1 | LZE8T | Human | Esophagus | ESCC | 7.51e-06 | -2.23e-01 | 0.067 |
| 2296 | FOXC1 | LZE20T | Human | Esophagus | ESCC | 6.68e-08 | -7.44e-02 | 0.0662 |
| 2296 | FOXC1 | LZE24T | Human | Esophagus | ESCC | 6.33e-05 | -3.17e-01 | 0.0596 |
| 2296 | FOXC1 | LZE21T | Human | Esophagus | ESCC | 2.11e-02 | -1.98e-01 | 0.0655 |
| 2296 | FOXC1 | P2T-E | Human | Esophagus | ESCC | 4.32e-20 | 5.70e-01 | 0.1177 |
| 2296 | FOXC1 | P4T-E | Human | Esophagus | ESCC | 3.02e-06 | -2.68e-01 | 0.1323 |
| 2296 | FOXC1 | P5T-E | Human | Esophagus | ESCC | 9.23e-06 | -3.24e-01 | 0.1327 |
| 2296 | FOXC1 | P8T-E | Human | Esophagus | ESCC | 4.94e-08 | -1.79e-01 | 0.0889 |
| 2296 | FOXC1 | P9T-E | Human | Esophagus | ESCC | 2.28e-05 | -2.83e-01 | 0.1131 |
| 2296 | FOXC1 | P10T-E | Human | Esophagus | ESCC | 3.31e-07 | -2.93e-01 | 0.116 |
| 2296 | FOXC1 | P11T-E | Human | Esophagus | ESCC | 8.05e-09 | 1.34e-01 | 0.1426 |
| 2296 | FOXC1 | P12T-E | Human | Esophagus | ESCC | 3.77e-06 | -1.72e-01 | 0.1122 |
| 2296 | FOXC1 | P15T-E | Human | Esophagus | ESCC | 1.14e-04 | -3.18e-01 | 0.1149 |
| 2296 | FOXC1 | P16T-E | Human | Esophagus | ESCC | 2.63e-17 | 1.30e-01 | 0.1153 |
| 2296 | FOXC1 | P17T-E | Human | Esophagus | ESCC | 1.51e-03 | -4.14e-02 | 0.1278 |
| 2296 | FOXC1 | P20T-E | Human | Esophagus | ESCC | 1.57e-04 | -3.08e-01 | 0.1124 |
| 2296 | FOXC1 | P21T-E | Human | Esophagus | ESCC | 4.23e-07 | -2.55e-01 | 0.1617 |
| 2296 | FOXC1 | P22T-E | Human | Esophagus | ESCC | 1.14e-07 | -2.67e-01 | 0.1236 |
| 2296 | FOXC1 | P23T-E | Human | Esophagus | ESCC | 2.40e-05 | -7.24e-02 | 0.108 |
| Page: 1 2 3 4 |
| Tissue | Expression Dynamics | Abbreviation |
| Esophagus | 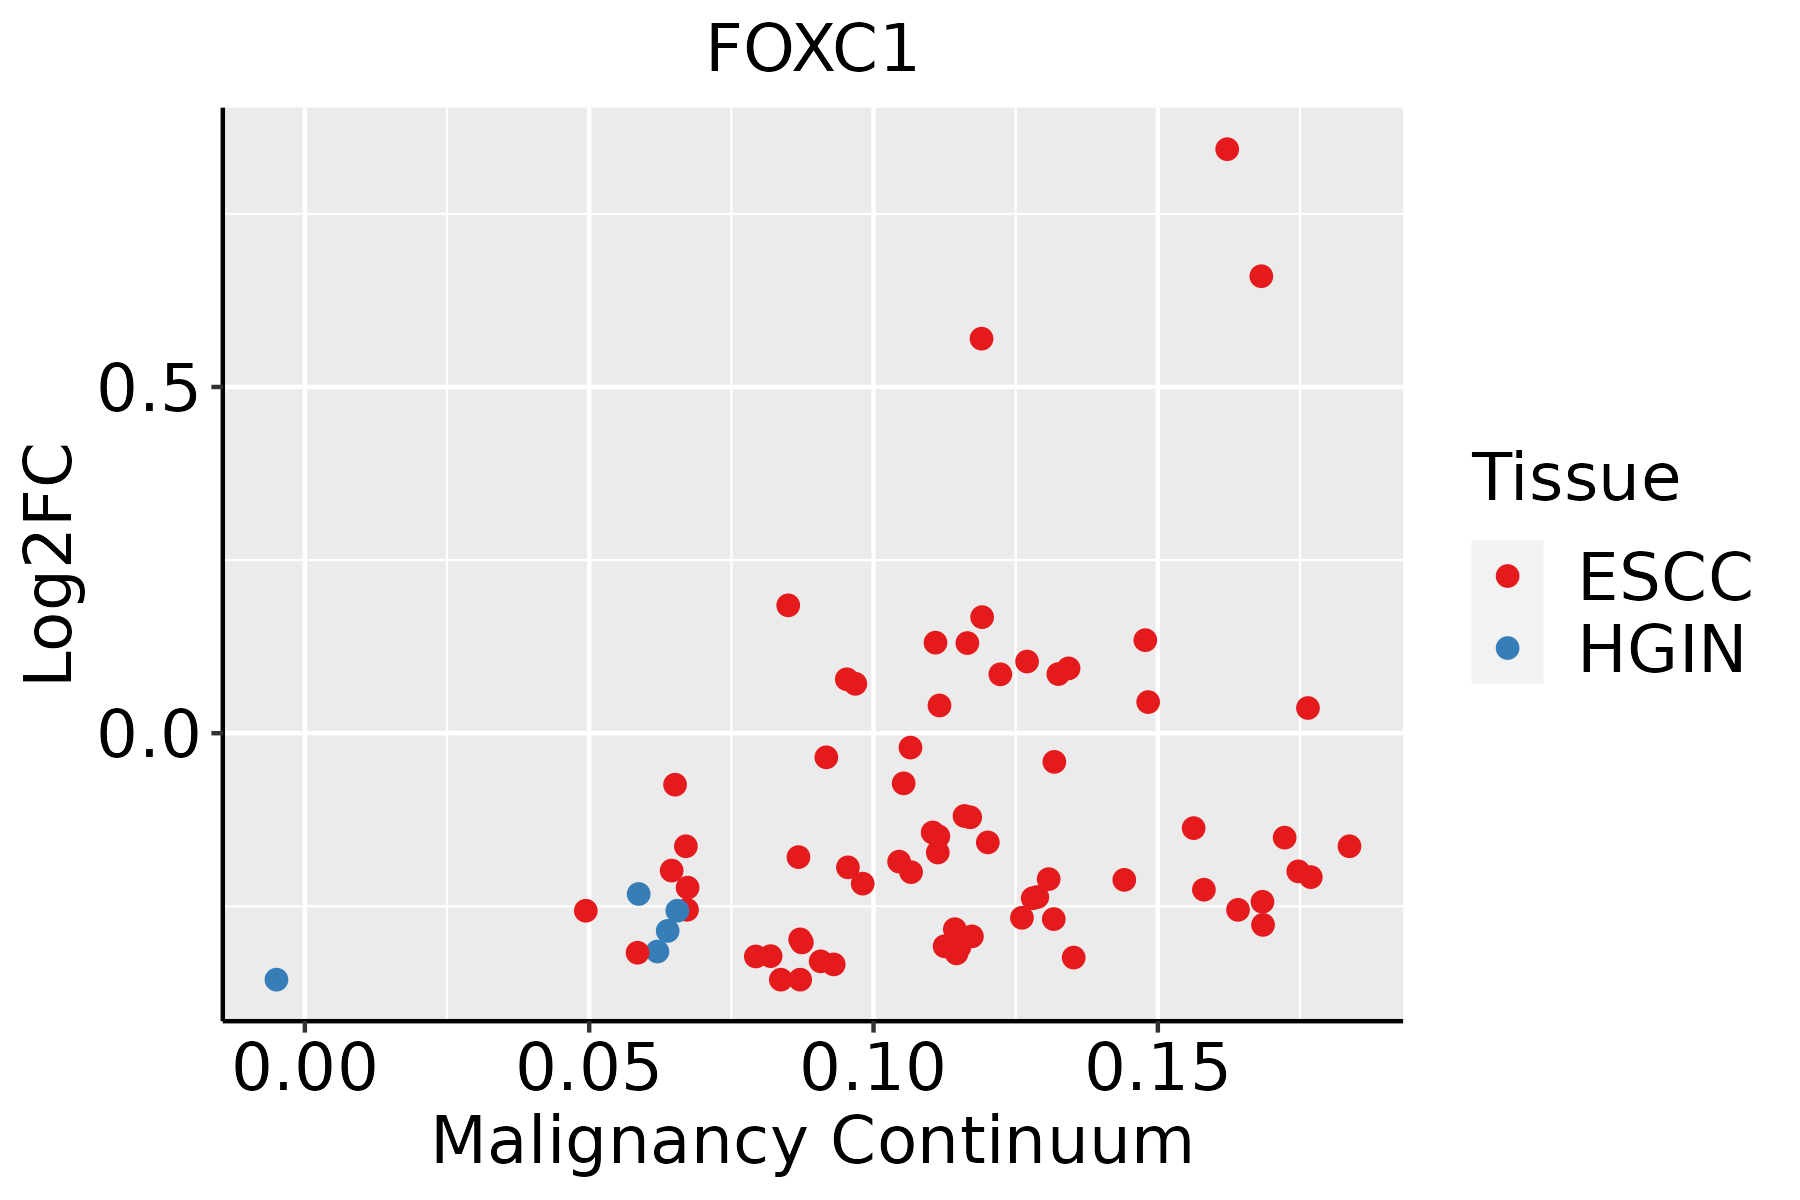 | ESCC: Esophageal squamous cell carcinoma |
| HGIN: High-grade intraepithelial neoplasias | ||
| LGIN: Low-grade intraepithelial neoplasias | ||
| Prostate | 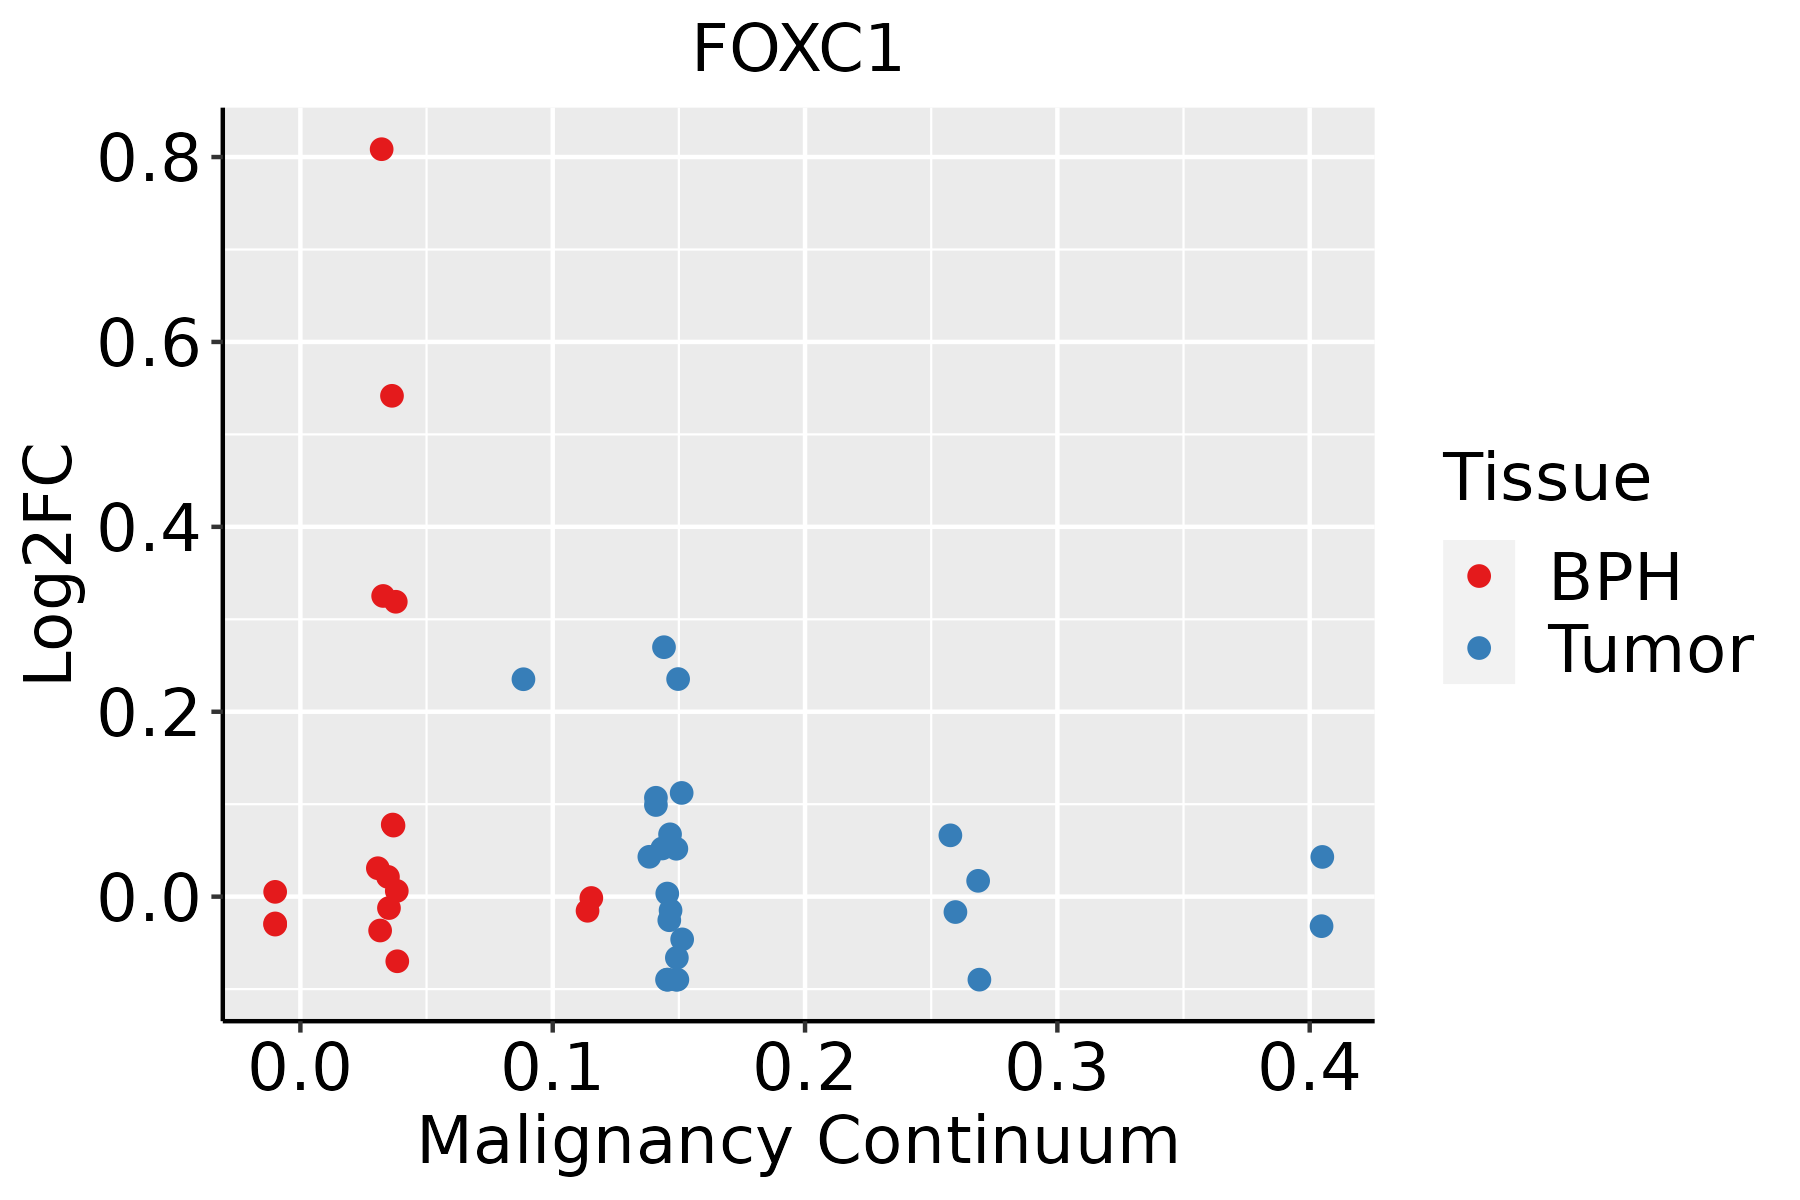 | BPH: Benign Prostatic Hyperplasia |
| Skin |  | AK: Actinic keratosis |
| cSCC: Cutaneous squamous cell carcinoma | ||
| SCCIS:squamous cell carcinoma in situ | ||
| Thyroid |  | ATC: Anaplastic thyroid cancer |
| HT: Hashimoto's thyroiditis | ||
| PTC: Papillary thyroid cancer |
| ∗log2FC in expression of this searched gene in stem-like cells from each diseased tissue sample relative to stem-like cells in normal samples in each tissue plotted against the malignancy continuum. Samples are colored based on if they are from different disease stage. |
Top |
Malignant transformation related pathway analysis |
| Find out the enriched GO biological processes and KEGG pathways involved in transition from healthy to precancer to cancer |
| Tissue | Disease Stage | Enriched GO biological Processes |
| Colorectum | AD |  |
| Colorectum | SER |  |
| Colorectum | MSS |  |
| Colorectum | MSI-H |  |
| Colorectum | FAP |  |
| ∗Top 15 enriched GO BP terms are showed in the bar plot of each disease state in each tissue. Each row represents a significant GO biological process which is colored according to the -log10(p.adjust). |
| Page: 1 2 3 4 5 6 7 8 9 |
| GO ID | Tissue | Disease Stage | Description | Gene Ratio | Bg Ratio | pvalue | p.adjust | Count |
| GO:0051098111 | Esophagus | ESCC | regulation of binding | 251/8552 | 363/18723 | 6.73e-20 | 8.46e-18 | 251 |
| GO:000734615 | Esophagus | ESCC | regulation of mitotic cell cycle | 293/8552 | 457/18723 | 8.00e-16 | 5.64e-14 | 293 |
| GO:000170119 | Esophagus | ESCC | in utero embryonic development | 243/8552 | 367/18723 | 1.00e-15 | 6.86e-14 | 243 |
| GO:0048732111 | Esophagus | ESCC | gland development | 269/8552 | 436/18723 | 7.81e-12 | 2.95e-10 | 269 |
| GO:0051099111 | Esophagus | ESCC | positive regulation of binding | 122/8552 | 173/18723 | 2.79e-11 | 9.45e-10 | 122 |
| GO:00457865 | Esophagus | ESCC | negative regulation of cell cycle | 236/8552 | 385/18723 | 3.62e-10 | 9.93e-09 | 236 |
| GO:0051101111 | Esophagus | ESCC | regulation of DNA binding | 84/8552 | 118/18723 | 1.64e-08 | 3.21e-07 | 84 |
| GO:00435888 | Esophagus | ESCC | skin development | 163/8552 | 263/18723 | 6.48e-08 | 1.14e-06 | 163 |
| GO:0061458110 | Esophagus | ESCC | reproductive system development | 247/8552 | 427/18723 | 2.24e-07 | 3.42e-06 | 247 |
| GO:004860818 | Esophagus | ESCC | reproductive structure development | 245/8552 | 424/18723 | 2.82e-07 | 4.14e-06 | 245 |
| GO:000854410 | Esophagus | ESCC | epidermis development | 193/8552 | 324/18723 | 2.87e-07 | 4.19e-06 | 193 |
| GO:004593013 | Esophagus | ESCC | negative regulation of mitotic cell cycle | 143/8552 | 235/18723 | 1.84e-06 | 2.15e-05 | 143 |
| GO:000150317 | Esophagus | ESCC | ossification | 232/8552 | 408/18723 | 3.00e-06 | 3.40e-05 | 232 |
| GO:00107184 | Esophagus | ESCC | positive regulation of epithelial to mesenchymal transition | 40/8552 | 52/18723 | 4.25e-06 | 4.56e-05 | 40 |
| GO:00073698 | Esophagus | ESCC | gastrulation | 115/8552 | 185/18723 | 4.35e-06 | 4.64e-05 | 115 |
| GO:007084919 | Esophagus | ESCC | response to epidermal growth factor | 38/8552 | 49/18723 | 5.24e-06 | 5.49e-05 | 38 |
| GO:007136419 | Esophagus | ESCC | cellular response to epidermal growth factor stimulus | 35/8552 | 45/18723 | 1.11e-05 | 1.04e-04 | 35 |
| GO:000991310 | Esophagus | ESCC | epidermal cell differentiation | 122/8552 | 202/18723 | 1.69e-05 | 1.51e-04 | 122 |
| GO:00072197 | Esophagus | ESCC | Notch signaling pathway | 106/8552 | 172/18723 | 1.74e-05 | 1.55e-04 | 106 |
| GO:00456826 | Esophagus | ESCC | regulation of epidermis development | 46/8552 | 65/18723 | 3.65e-05 | 2.97e-04 | 46 |
| Page: 1 2 3 4 5 6 7 8 9 10 11 12 13 14 15 16 17 18 19 20 21 22 |
| Pathway ID | Tissue | Disease Stage | Description | Gene Ratio | Bg Ratio | pvalue | p.adjust | qvalue | Count |
| Page: 1 |
Top |
Cell-cell communication analysis |
| Identification of potential cell-cell interactions between two cell types and their ligand-receptor pairs for different disease states |
| Ligand | Receptor | LRpair | Pathway | Tissue | Disease Stage |
| Page: 1 |
Top |
Single-cell gene regulatory network inference analysis |
| Find out the significant the regulons (TFs) and the target genes of each regulon across cell types for different disease states |
| TF | Cell Type | Tissue | Disease Stage | Target Gene | RSS | Regulon Activity |
| FOXC1 | MES | Cervix | HSIL_HPV | TCHP,ARRB2,SLC39A2, etc. | 4.61e-01 |  |
| FOXC1 | M1MAC | Cervix | Healthy | SPARCL1,AQP1,ADIRF, etc. | 2.90e-01 |  |
| FOXC1 | MYOFIB | Cervix | CC | CDKN1A,CSRP2,YBX3, etc. | 2.95e-01 |  |
| FOXC1 | MYOFIB | Cervix | HSIL_HPV | CDKN1A,CSRP2,YBX3, etc. | 1.01e-01 | |
| FOXC1 | ABS | Colorectum | MSI-H | CLEC19A,RARRES3,HLA-B, etc. | 3.21e-01 |  |
| FOXC1 | IMENT | Colorectum | MSI-H | CLEC19A,RARRES3,HLA-B, etc. | 1.16e-01 | |
| FOXC1 | ASC | Colorectum | MSI-H | CLEC19A,RARRES3,HLA-B, etc. | 1.69e-01 | |
| FOXC1 | CT | Colorectum | SER | CLEC19A,RARRES3,HLA-B, etc. | 3.95e-02 |  |
| FOXC1 | MVA | Endometrium | EEC | PPP1R2,YBX3,CDKN1A, etc. | 2.03e-01 |  |
| FOXC1 | MVA | Endometrium | Healthy | PPP1R2,YBX3,CDKN1A, etc. | 2.11e-01 |  |
| ∗The dot plots of a searched regulon are shown for all cell subpopulations in each disease state of each tissue based on the regulon specific score inferred using pySCENIC and by calculating the average expression. |
| Page: 1 2 |
Top |
Somatic mutation of malignant transformation related genes |
| Annotation of somatic variants for genes involved in malignant transformation |
| Hugo Symbol | Variant Class | Variant Classification | dbSNP RS | HGVSc | HGVSp | HGVSp Short | SWISSPROT | BIOTYPE | SIFT | PolyPhen | Tumor Sample Barcode | Tissue | Histology | Sex | Age | Stage | Therapy Types | Drugs | Outcome |
| FOXC1 | SNV | Missense_Mutation | novel | c.1628N>T | p.Ser543Phe | p.S543F | Q12948 | protein_coding | deleterious(0) | probably_damaging(0.986) | TCGA-A7-A6VX-01 | Breast | breast invasive carcinoma | Female | >=65 | I/II | Chemotherapy | docetaxel | CR |
| FOXC1 | SNV | Missense_Mutation | c.373N>G | p.Ser125Gly | p.S125G | Q12948 | protein_coding | deleterious(0) | probably_damaging(0.997) | TCGA-D8-A1XQ-01 | Breast | breast invasive carcinoma | Female | >=65 | I/II | Unknown | Unknown | SD | |
| FOXC1 | insertion | Frame_Shift_Ins | novel | c.257_258insTA | p.Ile87ThrfsTer16 | p.I87Tfs*16 | Q12948 | protein_coding | TCGA-LL-A5YL-01 | Breast | breast invasive carcinoma | Female | <65 | I/II | Chemotherapy | adriamycin | SD | ||
| FOXC1 | SNV | Missense_Mutation | c.1519G>A | p.Val507Met | p.V507M | Q12948 | protein_coding | deleterious(0.01) | possibly_damaging(0.694) | TCGA-C5-A7CJ-01 | Cervix | cervical & endocervical cancer | Female | <65 | I/II | Chemotherapy | cisplatin | SD | |
| FOXC1 | SNV | Missense_Mutation | c.253N>A | p.Ala85Thr | p.A85T | Q12948 | protein_coding | deleterious(0) | probably_damaging(0.997) | TCGA-A6-3809-01 | Colorectum | colon adenocarcinoma | Female | >=65 | I/II | Unknown | Unknown | SD | |
| FOXC1 | SNV | Missense_Mutation | novel | c.1550N>A | p.Gly517Asp | p.G517D | Q12948 | protein_coding | deleterious(0) | probably_damaging(0.998) | TCGA-AA-3947-01 | Colorectum | colon adenocarcinoma | Female | <65 | I/II | Unknown | Unknown | SD |
| FOXC1 | SNV | Missense_Mutation | c.469N>T | p.Asp157Tyr | p.D157Y | Q12948 | protein_coding | deleterious(0) | probably_damaging(0.999) | TCGA-A5-A0G1-01 | Endometrium | uterine corpus endometrioid carcinoma | Female | >=65 | I/II | Unknown | Unknown | SD | |
| FOXC1 | SNV | Missense_Mutation | c.469N>T | p.Asp157Tyr | p.D157Y | Q12948 | protein_coding | deleterious(0) | probably_damaging(0.999) | TCGA-A5-A0GG-01 | Endometrium | uterine corpus endometrioid carcinoma | Female | >=65 | I/II | Unknown | Unknown | SD | |
| FOXC1 | SNV | Missense_Mutation | novel | c.414G>T | p.Lys138Asn | p.K138N | Q12948 | protein_coding | deleterious(0) | probably_damaging(0.999) | TCGA-AJ-A3EK-01 | Endometrium | uterine corpus endometrioid carcinoma | Female | <65 | I/II | Chemotherapy | carboplatin | CR |
| FOXC1 | SNV | Missense_Mutation | rs765987336 | c.229N>A | p.Val77Met | p.V77M | Q12948 | protein_coding | deleterious(0) | probably_damaging(0.995) | TCGA-AP-A0LM-01 | Endometrium | uterine corpus endometrioid carcinoma | Female | <65 | III/IV | Chemotherapy | cisplatin | SD |
| Page: 1 2 3 |
Top |
Related drugs of malignant transformation related genes |
| Identification of chemicals and drugs interact with genes involved in malignant transfromation |
| (DGIdb 4.0) |
| Entrez ID | Symbol | Category | Interaction Types | Drug Claim Name | Drug Name | PMIDs |
| Page: 1 |

Copyright 2023-Present -The University of Texas Health Science Center at Houston |