
|
|||||
|
 | |
| |
| |
| |
| |
| |
|
Gene: FOXA1 |
Gene summary for FOXA1 |
| Gene information | Species | Human | Gene symbol | FOXA1 | Gene ID | 3169 |
| Gene name | forkhead box A1 | |
| Gene Alias | HNF3A | |
| Cytomap | 14q21.1 | |
| Gene Type | protein-coding | GO ID | GO:0000003 | UniProtAcc | P55317 |
Top |
Malignant transformation analysis |
| Identification of the aberrant gene expression in precancerous and cancerous lesions by comparing the gene expression of stem-like cells in diseased tissues with normal stem cells |
| Entrez ID | Symbol | Replicates | Species | Organ | Tissue | Adj P-value | Log2FC | Malignancy |
| 3169 | FOXA1 | GSM4909281 | Human | Breast | IDC | 1.77e-06 | -2.00e-01 | 0.21 |
| 3169 | FOXA1 | GSM4909282 | Human | Breast | IDC | 3.78e-06 | -1.95e-01 | -0.0288 |
| 3169 | FOXA1 | GSM4909285 | Human | Breast | IDC | 4.58e-02 | -1.76e-01 | 0.21 |
| 3169 | FOXA1 | GSM4909287 | Human | Breast | IDC | 1.20e-05 | -1.95e-01 | 0.2057 |
| 3169 | FOXA1 | GSM4909290 | Human | Breast | IDC | 2.02e-13 | 5.63e-01 | 0.2096 |
| 3169 | FOXA1 | GSM4909293 | Human | Breast | IDC | 4.37e-19 | 4.70e-01 | 0.1581 |
| 3169 | FOXA1 | GSM4909295 | Human | Breast | IDC | 1.38e-02 | -2.00e-01 | 0.0898 |
| 3169 | FOXA1 | GSM4909298 | Human | Breast | IDC | 2.09e-23 | 5.45e-01 | 0.1551 |
| 3169 | FOXA1 | GSM4909301 | Human | Breast | IDC | 4.93e-12 | 5.08e-01 | 0.1577 |
| 3169 | FOXA1 | GSM4909304 | Human | Breast | IDC | 1.54e-23 | 5.17e-01 | 0.1636 |
| 3169 | FOXA1 | GSM4909306 | Human | Breast | IDC | 7.79e-10 | 3.56e-01 | 0.1564 |
| 3169 | FOXA1 | GSM4909307 | Human | Breast | IDC | 1.69e-08 | 4.38e-01 | 0.1569 |
| 3169 | FOXA1 | GSM4909308 | Human | Breast | IDC | 1.09e-24 | 6.17e-01 | 0.158 |
| 3169 | FOXA1 | GSM4909311 | Human | Breast | IDC | 3.98e-02 | -1.18e-01 | 0.1534 |
| 3169 | FOXA1 | GSM4909319 | Human | Breast | IDC | 4.12e-06 | -1.59e-01 | 0.1563 |
| 3169 | FOXA1 | brca2 | Human | Breast | Precancer | 9.46e-05 | 2.12e-01 | -0.024 |
| 3169 | FOXA1 | M1 | Human | Breast | IDC | 7.93e-09 | 4.49e-01 | 0.1577 |
| 3169 | FOXA1 | M5 | Human | Breast | IDC | 4.65e-05 | 6.70e-01 | 0.1598 |
| 3169 | FOXA1 | NCCBC14 | Human | Breast | DCIS | 7.58e-05 | 3.88e-01 | 0.2021 |
| 3169 | FOXA1 | NCCBC5 | Human | Breast | DCIS | 2.29e-02 | 1.22e-01 | 0.2046 |
| Page: 1 2 3 4 5 |
| Tissue | Expression Dynamics | Abbreviation |
| Breast | 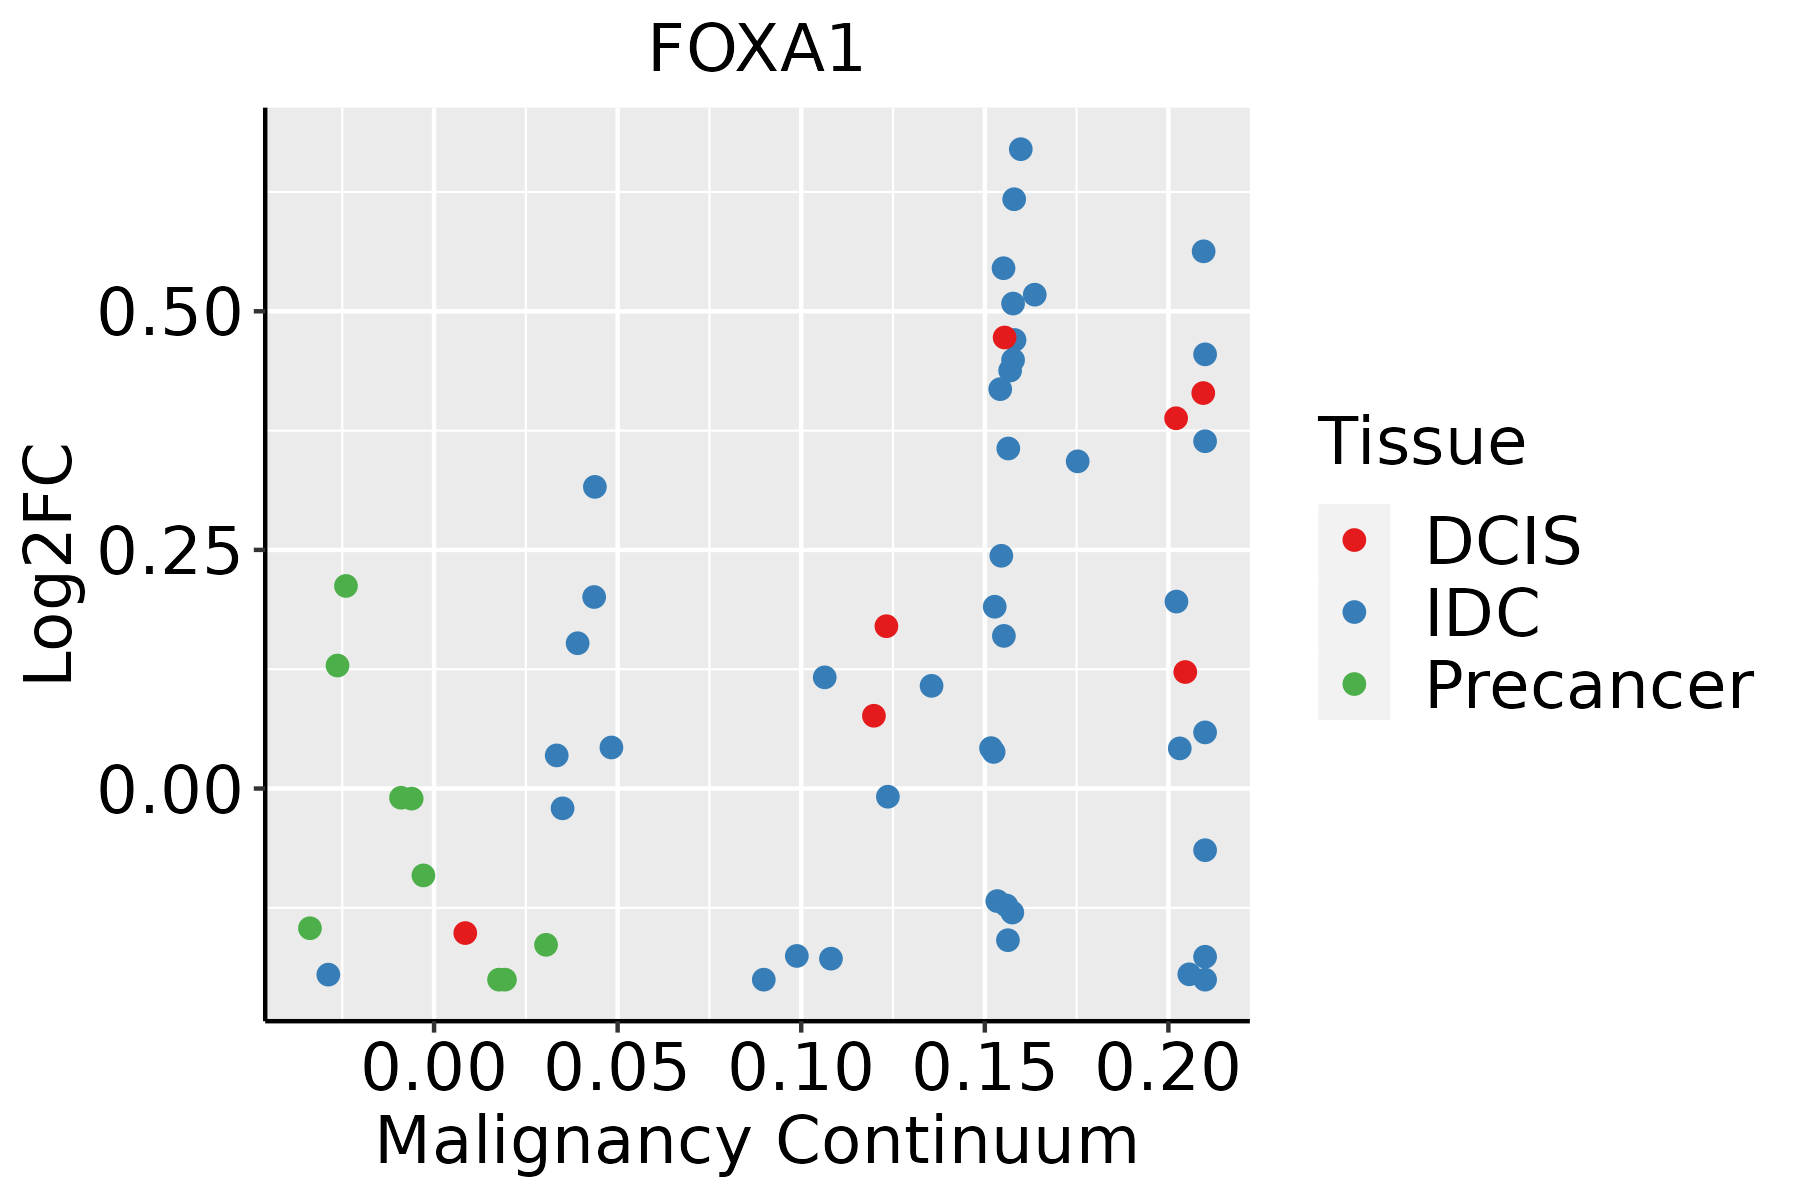 | IDC: Invasive ductal carcinoma |
| DCIS: Ductal carcinoma in situ | ||
| Precancer(BRCA1-mut): Precancerous lesion from BRCA1 mutation carriers | ||
| Colorectum (GSE201348) |  | FAP: Familial adenomatous polyposis |
| CRC: Colorectal cancer | ||
| Colorectum (HTA11) |  | AD: Adenomas |
| SER: Sessile serrated lesions | ||
| MSI-H: Microsatellite-high colorectal cancer | ||
| MSS: Microsatellite stable colorectal cancer | ||
| Esophagus | 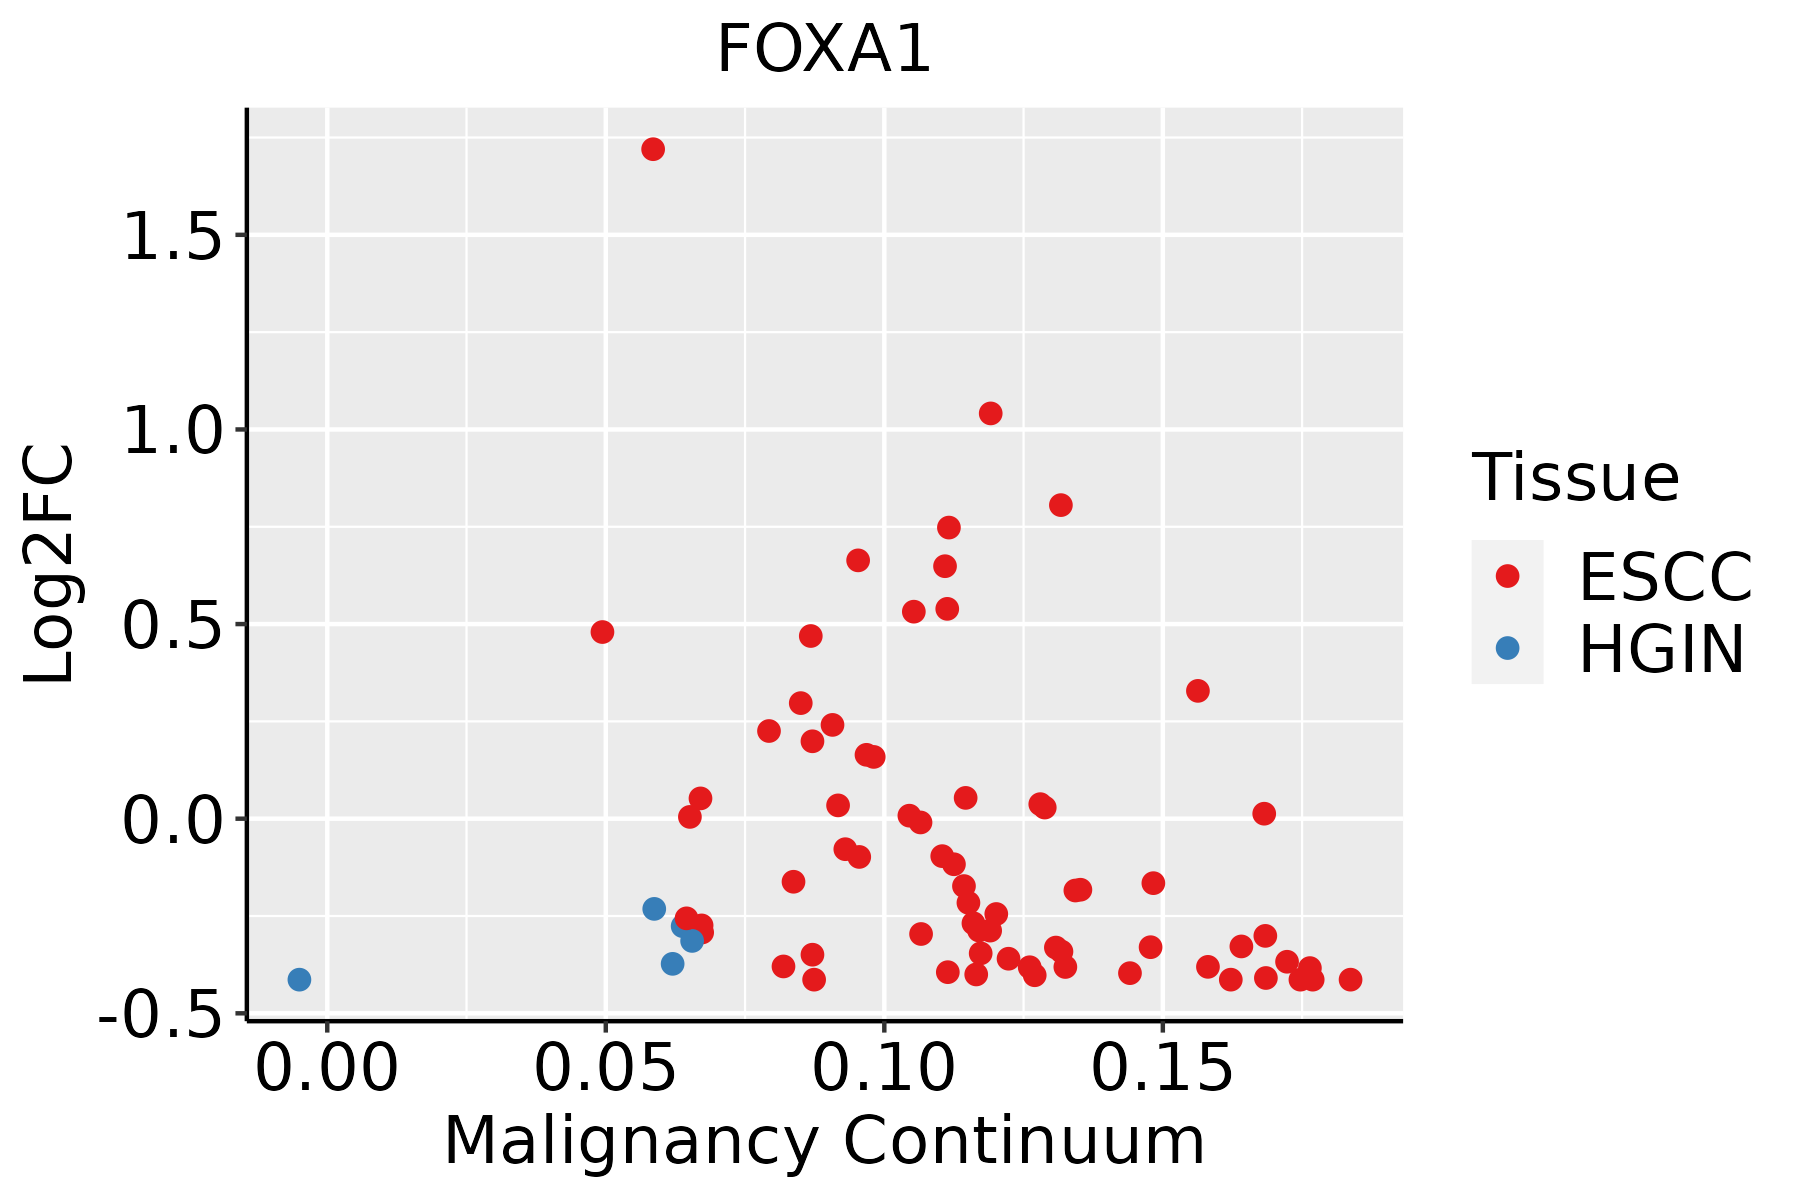 | ESCC: Esophageal squamous cell carcinoma |
| HGIN: High-grade intraepithelial neoplasias | ||
| LGIN: Low-grade intraepithelial neoplasias | ||
| Oral Cavity | 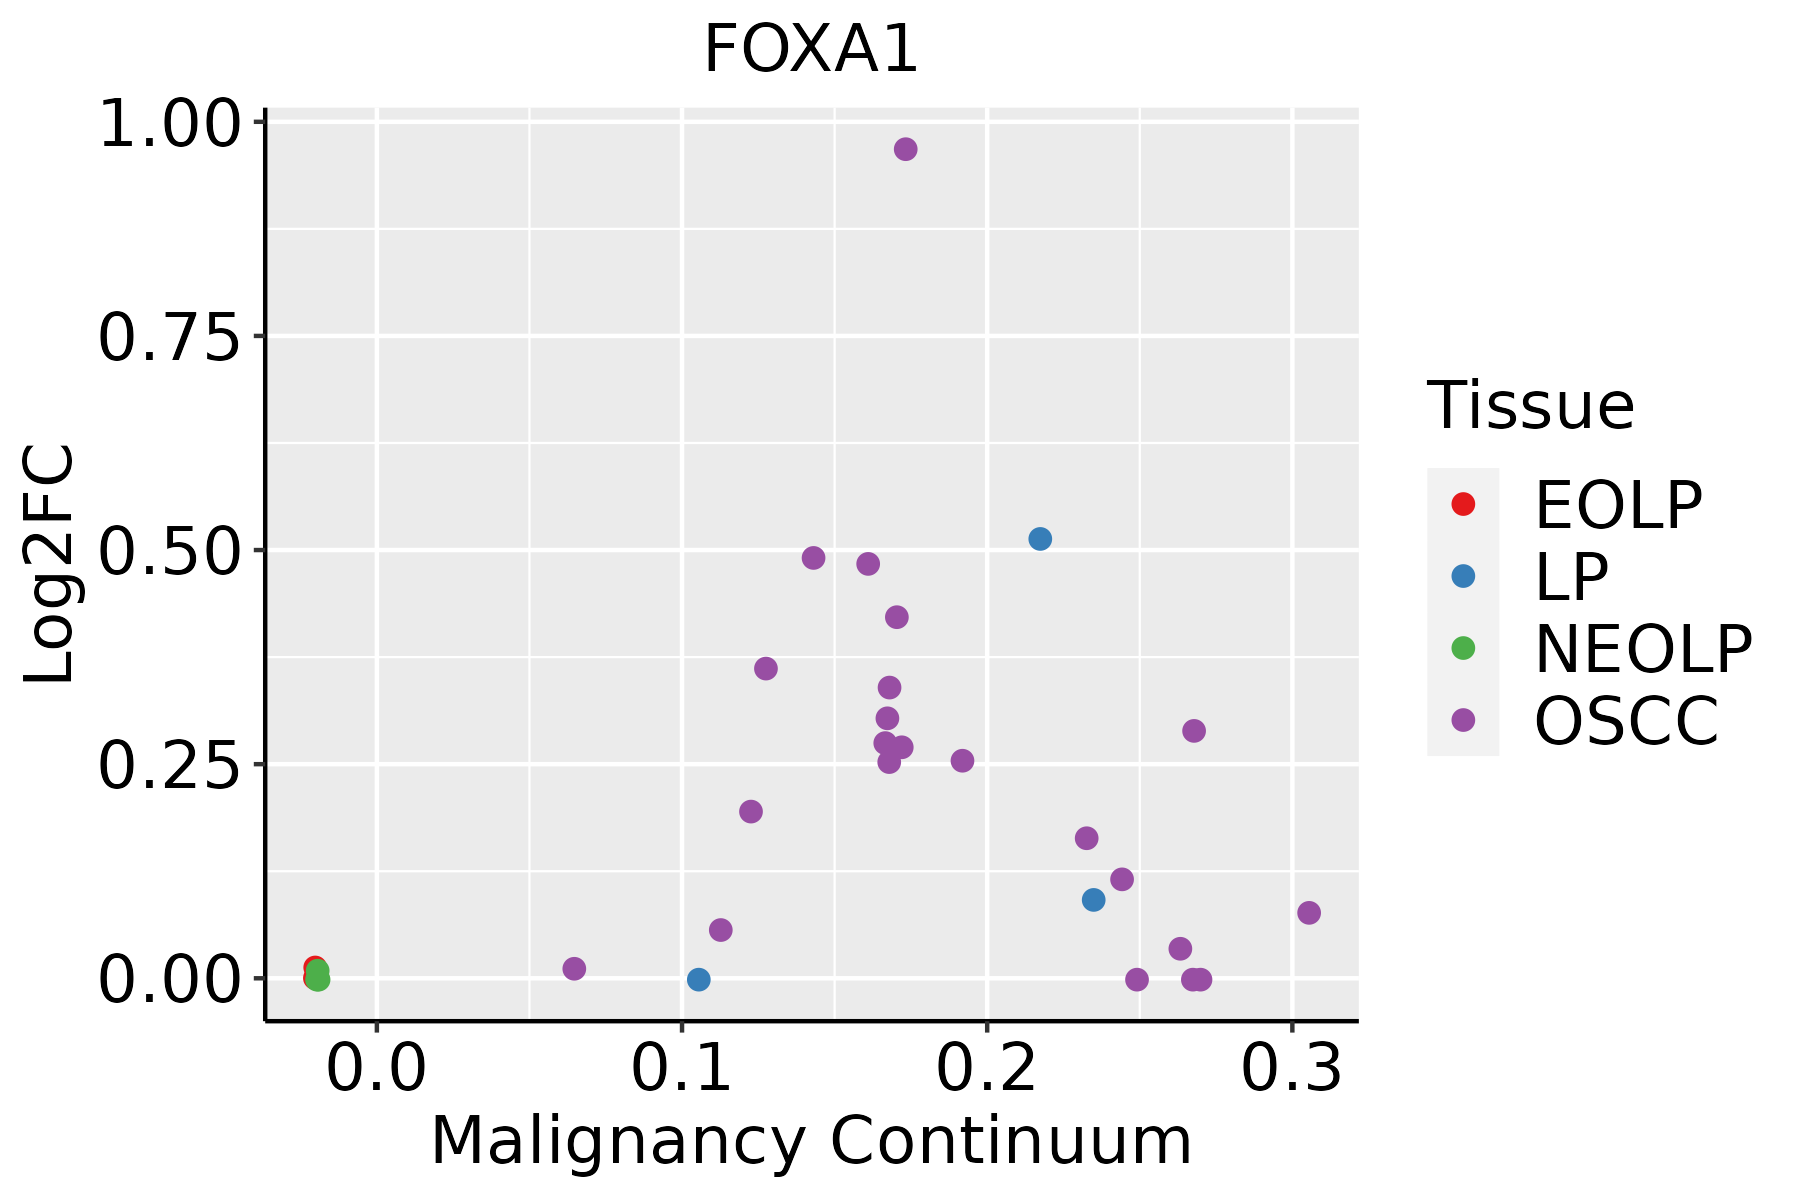 | EOLP: Erosive Oral lichen planus |
| LP: leukoplakia | ||
| NEOLP: Non-erosive oral lichen planus | ||
| OSCC: Oral squamous cell carcinoma | ||
| Prostate |  | BPH: Benign Prostatic Hyperplasia |
| ∗log2FC in expression of this searched gene in stem-like cells from each diseased tissue sample relative to stem-like cells in normal samples in each tissue plotted against the malignancy continuum. Samples are colored based on if they are from different disease stage. |
Top |
Malignant transformation related pathway analysis |
| Find out the enriched GO biological processes and KEGG pathways involved in transition from healthy to precancer to cancer |
| Tissue | Disease Stage | Enriched GO biological Processes |
| Colorectum | AD |  |
| Colorectum | SER |  |
| Colorectum | MSS |  |
| Colorectum | MSI-H |  |
| Colorectum | FAP |  |
| ∗Top 15 enriched GO BP terms are showed in the bar plot of each disease state in each tissue. Each row represents a significant GO biological process which is colored according to the -log10(p.adjust). |
| Page: 1 2 3 4 5 6 7 8 9 |
| GO ID | Tissue | Disease Stage | Description | Gene Ratio | Bg Ratio | pvalue | p.adjust | Count |
| GO:00485459 | Breast | Precancer | response to steroid hormone | 53/1080 | 339/18723 | 3.07e-11 | 3.66e-09 | 53 |
| GO:00457859 | Breast | Precancer | positive regulation of cell adhesion | 52/1080 | 437/18723 | 5.74e-07 | 2.49e-05 | 52 |
| GO:00487329 | Breast | Precancer | gland development | 49/1080 | 436/18723 | 6.11e-06 | 1.73e-04 | 49 |
| GO:00713838 | Breast | Precancer | cellular response to steroid hormone stimulus | 28/1080 | 204/18723 | 1.78e-05 | 4.26e-04 | 28 |
| GO:00425938 | Breast | Precancer | glucose homeostasis | 31/1080 | 258/18723 | 8.89e-05 | 1.69e-03 | 31 |
| GO:00335008 | Breast | Precancer | carbohydrate homeostasis | 31/1080 | 259/18723 | 9.56e-05 | 1.79e-03 | 31 |
| GO:00224098 | Breast | Precancer | positive regulation of cell-cell adhesion | 33/1080 | 284/18723 | 1.03e-04 | 1.89e-03 | 33 |
| GO:00224079 | Breast | Precancer | regulation of cell-cell adhesion | 45/1080 | 448/18723 | 2.12e-04 | 3.30e-03 | 45 |
| GO:00486087 | Breast | Precancer | reproductive structure development | 43/1080 | 424/18723 | 2.36e-04 | 3.56e-03 | 43 |
| GO:00614587 | Breast | Precancer | reproductive system development | 43/1080 | 427/18723 | 2.75e-04 | 4.00e-03 | 43 |
| GO:00323555 | Breast | Precancer | response to estradiol | 19/1080 | 141/18723 | 4.81e-04 | 6.31e-03 | 19 |
| GO:00305187 | Breast | Precancer | intracellular steroid hormone receptor signaling pathway | 16/1080 | 116/18723 | 1.01e-03 | 1.13e-02 | 16 |
| GO:00018373 | Breast | Precancer | epithelial to mesenchymal transition | 19/1080 | 157/18723 | 1.78e-03 | 1.75e-02 | 19 |
| GO:00604792 | Breast | Precancer | lung cell differentiation | 6/1080 | 24/18723 | 1.99e-03 | 1.90e-02 | 6 |
| GO:00305228 | Breast | Precancer | intracellular receptor signaling pathway | 27/1080 | 265/18723 | 2.99e-03 | 2.57e-02 | 27 |
| GO:00605625 | Breast | Precancer | epithelial tube morphogenesis | 31/1080 | 325/18723 | 4.21e-03 | 3.31e-02 | 31 |
| GO:00020649 | Breast | Precancer | epithelial cell development | 23/1080 | 220/18723 | 4.28e-03 | 3.35e-02 | 23 |
| GO:00434018 | Breast | Precancer | steroid hormone mediated signaling pathway | 16/1080 | 136/18723 | 5.21e-03 | 3.88e-02 | 16 |
| GO:004854514 | Breast | IDC | response to steroid hormone | 70/1434 | 339/18723 | 1.34e-14 | 4.23e-12 | 70 |
| GO:004873214 | Breast | IDC | gland development | 64/1434 | 436/18723 | 3.47e-07 | 1.74e-05 | 64 |
| Page: 1 2 3 4 5 6 7 8 9 10 11 12 13 14 15 16 17 18 19 20 21 22 |
| Pathway ID | Tissue | Disease Stage | Description | Gene Ratio | Bg Ratio | pvalue | p.adjust | qvalue | Count |
| Page: 1 |
Top |
Cell-cell communication analysis |
| Identification of potential cell-cell interactions between two cell types and their ligand-receptor pairs for different disease states |
| Ligand | Receptor | LRpair | Pathway | Tissue | Disease Stage |
| Page: 1 |
Top |
Single-cell gene regulatory network inference analysis |
| Find out the significant the regulons (TFs) and the target genes of each regulon across cell types for different disease states |
| TF | Cell Type | Tissue | Disease Stage | Target Gene | RSS | Regulon Activity |
| FOXA1 | MLUM | Breast | ADJ | DHCR24,GATA3,SLC39A6, etc. | 3.09e-01 |  |
| FOXA1 | MLUM | Breast | IDC | DHCR24,GATA3,SLC39A6, etc. | 5.10e-01 |  |
| FOXA1 | MLUM | Breast | Precancer | DHCR24,GATA3,SLC39A6, etc. | 2.54e-01 |  |
| FOXA1 | PLA | Breast | ADJ | SLC39A6,TFF3,AGR3, etc. | 1.41e-01 | |
| FOXA1 | NK | Breast | DCIS | SLC39A6,TFF3,AGR3, etc. | 1.29e-01 |  |
| FOXA1 | PLA | Breast | DCIS | SLC39A6,TFF3,AGR3, etc. | 1.30e-01 | |
| FOXA1 | BMEM | Breast | DCIS | SLC39A6,TFF3,AGR3, etc. | 1.19e-01 | |
| FOXA1 | BMEM | Breast | Healthy | SLC39A6,TFF3,AGR3, etc. | 9.47e-02 |  |
| FOXA1 | NK | Breast | Healthy | SLC39A6,TFF3,AGR3, etc. | 1.03e-01 | |
| FOXA1 | NK | Breast | IDC | SLC39A6,TFF3,AGR3, etc. | 9.31e-02 | |
| ∗The dot plots of a searched regulon are shown for all cell subpopulations in each disease state of each tissue based on the regulon specific score inferred using pySCENIC and by calculating the average expression. |
| Page: 1 2 |
Top |
Somatic mutation of malignant transformation related genes |
| Annotation of somatic variants for genes involved in malignant transformation |
| Hugo Symbol | Variant Class | Variant Classification | dbSNP RS | HGVSc | HGVSp | HGVSp Short | SWISSPROT | BIOTYPE | SIFT | PolyPhen | Tumor Sample Barcode | Tissue | Histology | Sex | Age | Stage | Therapy Types | Drugs | Outcome |
| FOXA1 | SNV | Missense_Mutation | novel | c.637C>T | p.Arg213Cys | p.R213C | P55317 | protein_coding | deleterious(0) | probably_damaging(1) | TCGA-5L-AAT1-01 | Breast | breast invasive carcinoma | Female | <65 | III/IV | Hormone Therapy | letrozol | SD |
| FOXA1 | SNV | Missense_Mutation | novel | c.22G>A | p.Glu8Lys | p.E8K | P55317 | protein_coding | deleterious(0) | probably_damaging(0.968) | TCGA-5L-AAT1-01 | Breast | breast invasive carcinoma | Female | <65 | III/IV | Hormone Therapy | letrozol | SD |
| FOXA1 | SNV | Missense_Mutation | c.1350N>G | p.Ile450Met | p.I450M | P55317 | protein_coding | tolerated(0.35) | benign(0.07) | TCGA-A2-A0SY-01 | Breast | breast invasive carcinoma | Female | <65 | III/IV | Hormone Therapy | arimidex | SD | |
| FOXA1 | SNV | Missense_Mutation | c.739N>T | p.His247Tyr | p.H247Y | P55317 | protein_coding | deleterious(0) | probably_damaging(0.999) | TCGA-A2-A0SY-01 | Breast | breast invasive carcinoma | Female | <65 | III/IV | Hormone Therapy | arimidex | SD | |
| FOXA1 | SNV | Missense_Mutation | c.749N>T | p.Ser250Phe | p.S250F | P55317 | protein_coding | deleterious(0) | probably_damaging(1) | TCGA-A8-A082-01 | Breast | breast invasive carcinoma | Female | <65 | I/II | Chemotherapy | 5-fluorouracil | CR | |
| FOXA1 | SNV | Missense_Mutation | c.676N>A | p.Asp226Asn | p.D226N | P55317 | protein_coding | deleterious(0) | possibly_damaging(0.864) | TCGA-AC-A23H-01 | Breast | breast invasive carcinoma | Female | >=65 | I/II | Unknown | Unknown | PD | |
| FOXA1 | SNV | Missense_Mutation | novel | c.764N>T | p.Glu255Val | p.E255V | P55317 | protein_coding | deleterious(0) | probably_damaging(0.999) | TCGA-AC-A2FM-01 | Breast | breast invasive carcinoma | Female | >=65 | I/II | Unknown | Unknown | PD |
| FOXA1 | SNV | Missense_Mutation | c.526A>G | p.Ile176Val | p.I176V | P55317 | protein_coding | deleterious(0) | probably_damaging(0.995) | TCGA-AC-A3EH-01 | Breast | breast invasive carcinoma | Female | >=65 | III/IV | Unknown | Unknown | SD | |
| FOXA1 | SNV | Missense_Mutation | novel | c.677A>G | p.Asp226Gly | p.D226G | P55317 | protein_coding | deleterious(0) | possibly_damaging(0.762) | TCGA-AC-A4ZE-01 | Breast | breast invasive carcinoma | Female | <65 | I/II | Unknown | Unknown | SD |
| FOXA1 | SNV | Missense_Mutation | novel | c.1213N>T | p.Leu405Phe | p.L405F | P55317 | protein_coding | deleterious(0) | probably_damaging(0.999) | TCGA-AN-A0FF-01 | Breast | breast invasive carcinoma | Female | <65 | I/II | Unknown | Unknown | SD |
| Page: 1 2 3 4 5 6 7 8 9 10 11 12 |
Top |
Related drugs of malignant transformation related genes |
| Identification of chemicals and drugs interact with genes involved in malignant transfromation |
| (DGIdb 4.0) |
| Entrez ID | Symbol | Category | Interaction Types | Drug Claim Name | Drug Name | PMIDs |
| Page: 1 |

Copyright 2023-Present -The University of Texas Health Science Center at Houston |