
|
|||||
|
 | |
| |
| |
| |
| |
| |
|
Gene: FOSL2 |
Gene summary for FOSL2 |
| Gene information | Species | Human | Gene symbol | FOSL2 | Gene ID | 2355 |
| Gene name | FOS like 2, AP-1 transcription factor subunit | |
| Gene Alias | FRA2 | |
| Cytomap | 2p23.2 | |
| Gene Type | protein-coding | GO ID | GO:0002064 | UniProtAcc | P15408 |
Top |
Malignant transformation analysis |
| Identification of the aberrant gene expression in precancerous and cancerous lesions by comparing the gene expression of stem-like cells in diseased tissues with normal stem cells |
| Entrez ID | Symbol | Replicates | Species | Organ | Tissue | Adj P-value | Log2FC | Malignancy |
| 2355 | FOSL2 | LZE2D | Human | Esophagus | HGIN | 1.95e-04 | -1.12e-01 | 0.0642 |
| 2355 | FOSL2 | LZE4T | Human | Esophagus | ESCC | 1.58e-12 | 1.60e-02 | 0.0811 |
| 2355 | FOSL2 | LZE7T | Human | Esophagus | ESCC | 1.38e-06 | 3.43e-01 | 0.0667 |
| 2355 | FOSL2 | LZE8T | Human | Esophagus | ESCC | 2.11e-13 | -1.97e-02 | 0.067 |
| 2355 | FOSL2 | LZE20T | Human | Esophagus | ESCC | 5.69e-04 | 9.02e-03 | 0.0662 |
| 2355 | FOSL2 | LZE21D1 | Human | Esophagus | HGIN | 4.59e-03 | -2.28e-01 | 0.0632 |
| 2355 | FOSL2 | LZE22D1 | Human | Esophagus | HGIN | 2.08e-02 | -1.82e-01 | 0.0595 |
| 2355 | FOSL2 | LZE24T | Human | Esophagus | ESCC | 1.21e-09 | 5.82e-01 | 0.0596 |
| 2355 | FOSL2 | LZE21T | Human | Esophagus | ESCC | 6.64e-04 | 2.35e-01 | 0.0655 |
| 2355 | FOSL2 | LZE6T | Human | Esophagus | ESCC | 9.01e-08 | -2.62e-02 | 0.0845 |
| 2355 | FOSL2 | P2T-E | Human | Esophagus | ESCC | 7.94e-09 | 1.71e-01 | 0.1177 |
| 2355 | FOSL2 | P4T-E | Human | Esophagus | ESCC | 1.56e-07 | 3.80e-01 | 0.1323 |
| 2355 | FOSL2 | P5T-E | Human | Esophagus | ESCC | 1.61e-16 | 1.81e-01 | 0.1327 |
| 2355 | FOSL2 | P8T-E | Human | Esophagus | ESCC | 3.07e-04 | 4.13e-02 | 0.0889 |
| 2355 | FOSL2 | P9T-E | Human | Esophagus | ESCC | 3.18e-13 | 3.22e-01 | 0.1131 |
| 2355 | FOSL2 | P10T-E | Human | Esophagus | ESCC | 7.07e-11 | 2.87e-01 | 0.116 |
| 2355 | FOSL2 | P11T-E | Human | Esophagus | ESCC | 1.12e-03 | 6.09e-01 | 0.1426 |
| 2355 | FOSL2 | P12T-E | Human | Esophagus | ESCC | 3.71e-11 | 4.16e-01 | 0.1122 |
| 2355 | FOSL2 | P15T-E | Human | Esophagus | ESCC | 3.79e-13 | 5.44e-01 | 0.1149 |
| 2355 | FOSL2 | P16T-E | Human | Esophagus | ESCC | 8.00e-13 | -1.37e-01 | 0.1153 |
| Page: 1 2 3 4 5 6 |
| Tissue | Expression Dynamics | Abbreviation |
| Esophagus | 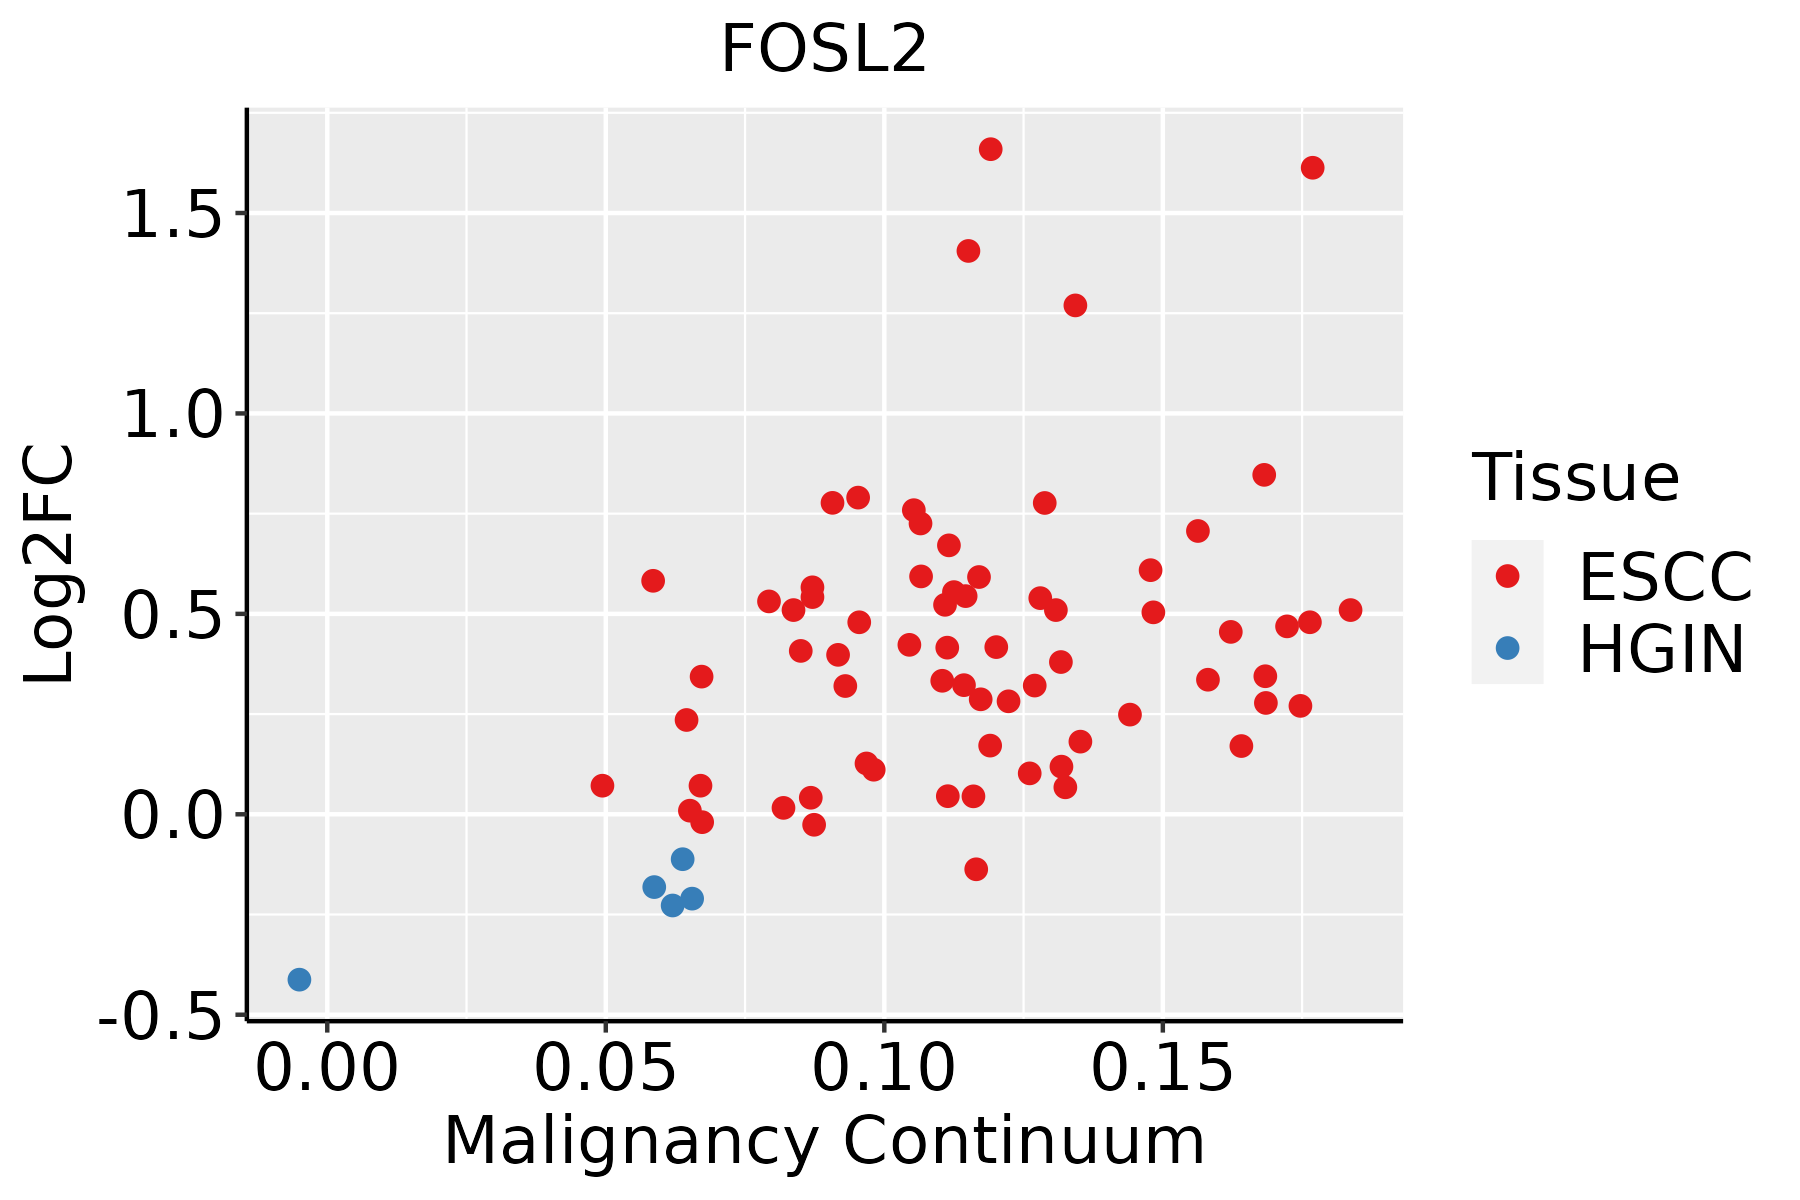 | ESCC: Esophageal squamous cell carcinoma |
| HGIN: High-grade intraepithelial neoplasias | ||
| LGIN: Low-grade intraepithelial neoplasias | ||
| Liver | 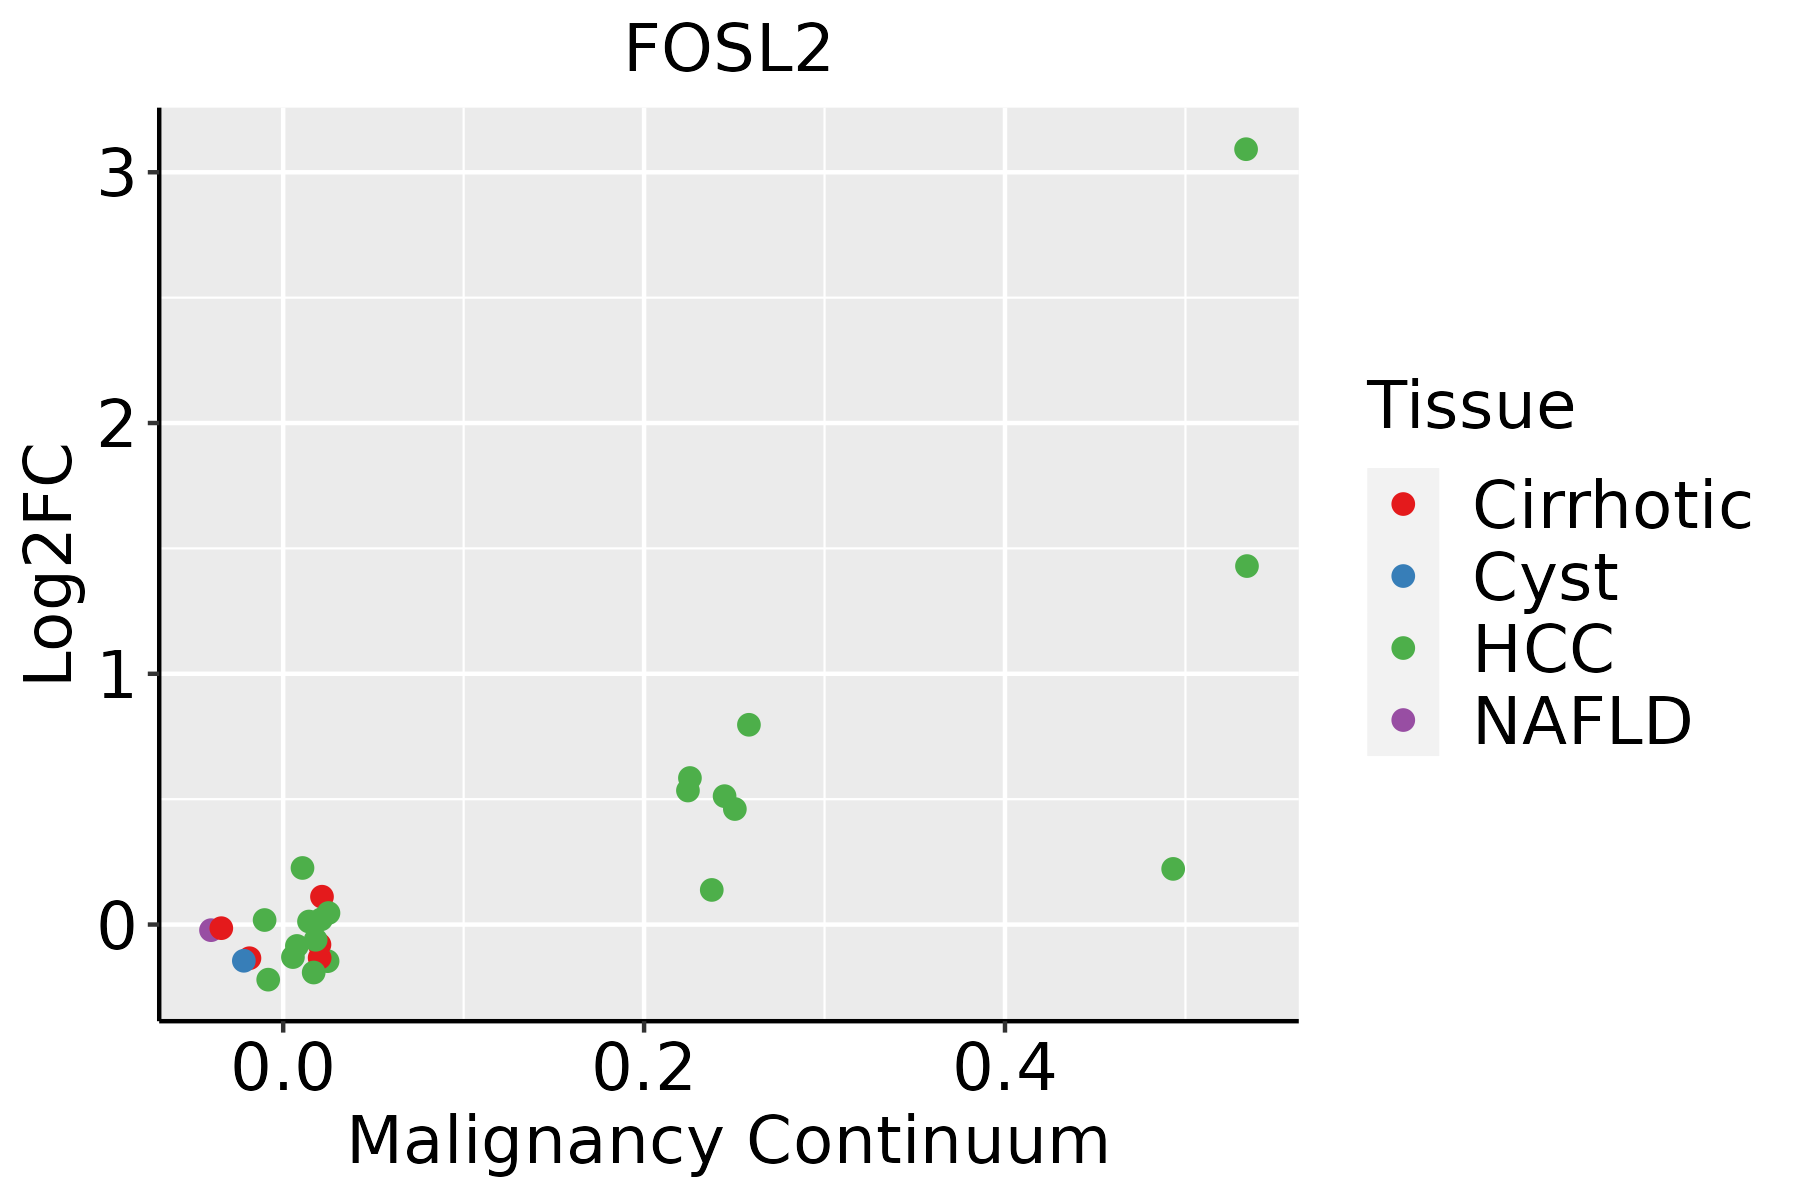 | HCC: Hepatocellular carcinoma |
| NAFLD: Non-alcoholic fatty liver disease | ||
| Oral Cavity |  | EOLP: Erosive Oral lichen planus |
| LP: leukoplakia | ||
| NEOLP: Non-erosive oral lichen planus | ||
| OSCC: Oral squamous cell carcinoma | ||
| Skin |  | AK: Actinic keratosis |
| cSCC: Cutaneous squamous cell carcinoma | ||
| SCCIS:squamous cell carcinoma in situ | ||
| Thyroid | 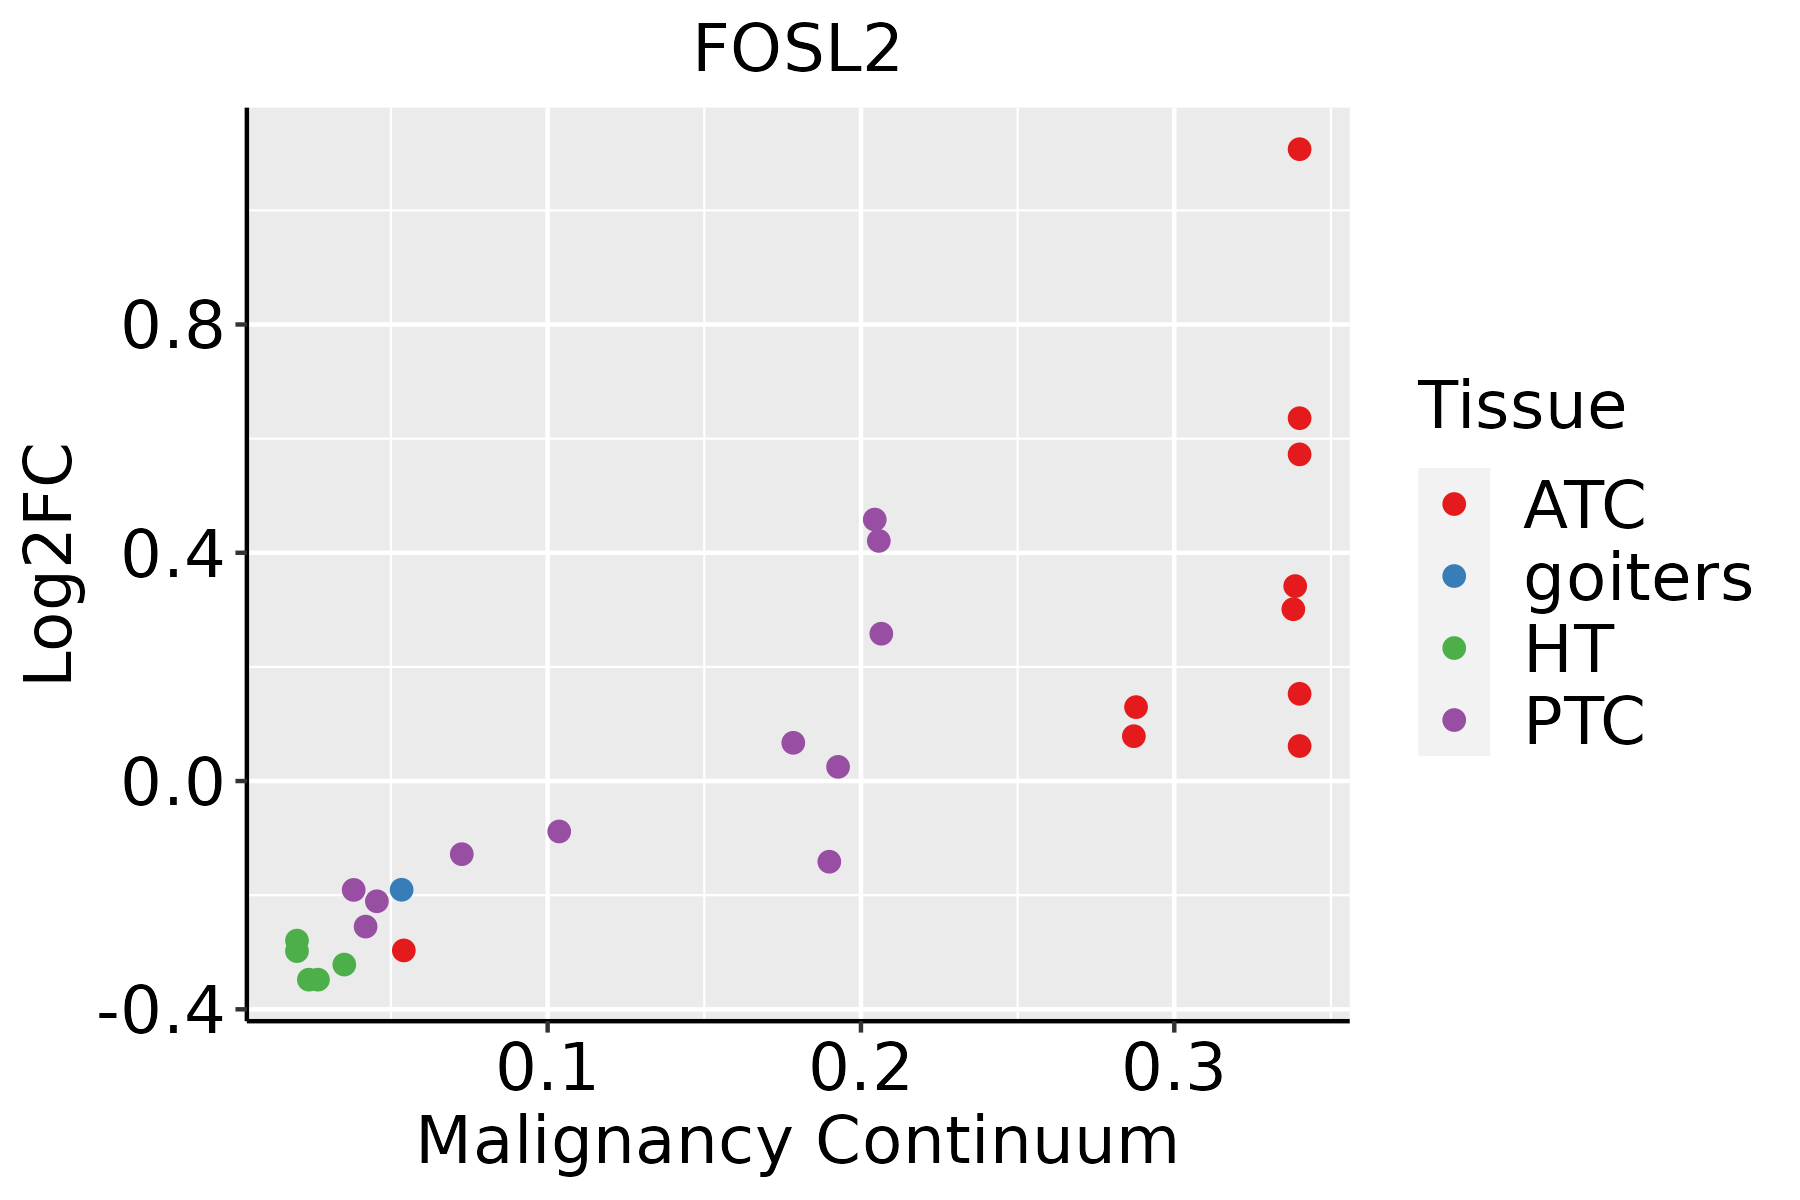 | ATC: Anaplastic thyroid cancer |
| HT: Hashimoto's thyroiditis | ||
| PTC: Papillary thyroid cancer |
| ∗log2FC in expression of this searched gene in stem-like cells from each diseased tissue sample relative to stem-like cells in normal samples in each tissue plotted against the malignancy continuum. Samples are colored based on if they are from different disease stage. |
Top |
Malignant transformation related pathway analysis |
| Find out the enriched GO biological processes and KEGG pathways involved in transition from healthy to precancer to cancer |
| Tissue | Disease Stage | Enriched GO biological Processes |
| Colorectum | AD |  |
| Colorectum | SER |  |
| Colorectum | MSS |  |
| Colorectum | MSI-H |  |
| Colorectum | FAP |  |
| ∗Top 15 enriched GO BP terms are showed in the bar plot of each disease state in each tissue. Each row represents a significant GO biological process which is colored according to the -log10(p.adjust). |
| Page: 1 2 3 4 5 6 7 8 9 |
| GO ID | Tissue | Disease Stage | Description | Gene Ratio | Bg Ratio | pvalue | p.adjust | Count |
| GO:00481458 | Esophagus | HGIN | regulation of fibroblast proliferation | 23/2587 | 80/18723 | 3.71e-04 | 5.77e-03 | 23 |
| GO:00481447 | Esophagus | HGIN | fibroblast proliferation | 23/2587 | 81/18723 | 4.52e-04 | 6.62e-03 | 23 |
| GO:00435888 | Esophagus | ESCC | skin development | 163/8552 | 263/18723 | 6.48e-08 | 1.14e-06 | 163 |
| GO:000854410 | Esophagus | ESCC | epidermis development | 193/8552 | 324/18723 | 2.87e-07 | 4.19e-06 | 193 |
| GO:000206420 | Esophagus | ESCC | epithelial cell development | 136/8552 | 220/18723 | 9.50e-07 | 1.21e-05 | 136 |
| GO:004814414 | Esophagus | ESCC | fibroblast proliferation | 57/8552 | 81/18723 | 5.83e-06 | 6.03e-05 | 57 |
| GO:004814514 | Esophagus | ESCC | regulation of fibroblast proliferation | 56/8552 | 80/18723 | 9.08e-06 | 8.71e-05 | 56 |
| GO:000991310 | Esophagus | ESCC | epidermal cell differentiation | 122/8552 | 202/18723 | 1.69e-05 | 1.51e-04 | 122 |
| GO:00302167 | Esophagus | ESCC | keratinocyte differentiation | 86/8552 | 139/18723 | 8.53e-05 | 6.19e-04 | 86 |
| GO:00481464 | Esophagus | ESCC | positive regulation of fibroblast proliferation | 32/8552 | 48/18723 | 2.70e-03 | 1.14e-02 | 32 |
| GO:000206412 | Liver | Cirrhotic | epithelial cell development | 80/4634 | 220/18723 | 7.63e-05 | 8.44e-04 | 80 |
| GO:0048145 | Liver | Cirrhotic | regulation of fibroblast proliferation | 33/4634 | 80/18723 | 8.46e-04 | 6.12e-03 | 33 |
| GO:0048144 | Liver | Cirrhotic | fibroblast proliferation | 33/4634 | 81/18723 | 1.09e-03 | 7.59e-03 | 33 |
| GO:0048146 | Liver | Cirrhotic | positive regulation of fibroblast proliferation | 20/4634 | 48/18723 | 7.37e-03 | 3.52e-02 | 20 |
| GO:000206422 | Liver | HCC | epithelial cell development | 114/7958 | 220/18723 | 3.19e-03 | 1.47e-02 | 114 |
| GO:00435887 | Oral cavity | OSCC | skin development | 143/7305 | 263/18723 | 2.77e-07 | 4.27e-06 | 143 |
| GO:00085449 | Oral cavity | OSCC | epidermis development | 171/7305 | 324/18723 | 2.89e-07 | 4.43e-06 | 171 |
| GO:00302166 | Oral cavity | OSCC | keratinocyte differentiation | 81/7305 | 139/18723 | 3.16e-06 | 3.81e-05 | 81 |
| GO:00099139 | Oral cavity | OSCC | epidermal cell differentiation | 109/7305 | 202/18723 | 1.08e-05 | 1.14e-04 | 109 |
| GO:000206419 | Oral cavity | OSCC | epithelial cell development | 116/7305 | 220/18723 | 2.34e-05 | 2.21e-04 | 116 |
| Page: 1 2 3 |
| Pathway ID | Tissue | Disease Stage | Description | Gene Ratio | Bg Ratio | pvalue | p.adjust | qvalue | Count |
| hsa043806 | Oral cavity | OSCC | Osteoclast differentiation | 73/3704 | 128/8465 | 1.60e-03 | 4.44e-03 | 2.26e-03 | 73 |
| hsa0438011 | Oral cavity | OSCC | Osteoclast differentiation | 73/3704 | 128/8465 | 1.60e-03 | 4.44e-03 | 2.26e-03 | 73 |
| hsa043802 | Oral cavity | EOLP | Osteoclast differentiation | 44/1218 | 128/8465 | 8.92e-09 | 1.37e-07 | 8.10e-08 | 44 |
| hsa043803 | Oral cavity | EOLP | Osteoclast differentiation | 44/1218 | 128/8465 | 8.92e-09 | 1.37e-07 | 8.10e-08 | 44 |
| Page: 1 |
Top |
Cell-cell communication analysis |
| Identification of potential cell-cell interactions between two cell types and their ligand-receptor pairs for different disease states |
| Ligand | Receptor | LRpair | Pathway | Tissue | Disease Stage |
| Page: 1 |
Top |
Single-cell gene regulatory network inference analysis |
| Find out the significant the regulons (TFs) and the target genes of each regulon across cell types for different disease states |
| TF | Cell Type | Tissue | Disease Stage | Target Gene | RSS | Regulon Activity |
| FOSL2 | MES | Cervix | CC | SLC2A1,WSB1,BHLHE40, etc. | 7.00e-01 |  |
| FOSL2 | MES | Cervix | HSIL_HPV | SLC2A1,WSB1,BHLHE40, etc. | 4.60e-01 |  |
| FOSL2 | IMENT | Colorectum | AD | AQP8,PDK4,PLAAT2, etc. | 1.69e-01 |  |
| FOSL2 | IMENT | Colorectum | SER | AQP8,PDK4,PLAAT2, etc. | 1.96e-01 |  |
| FOSL2 | PANIN | Pancreas | Healthy | UGCG,CCL14,PTPN1, etc. | 2.34e-01 |  |
| ∗The dot plots of a searched regulon are shown for all cell subpopulations in each disease state of each tissue based on the regulon specific score inferred using pySCENIC and by calculating the average expression. |
| Page: 1 |
Top |
Somatic mutation of malignant transformation related genes |
| Annotation of somatic variants for genes involved in malignant transformation |
| Hugo Symbol | Variant Class | Variant Classification | dbSNP RS | HGVSc | HGVSp | HGVSp Short | SWISSPROT | BIOTYPE | SIFT | PolyPhen | Tumor Sample Barcode | Tissue | Histology | Sex | Age | Stage | Therapy Types | Drugs | Outcome |
| FOSL2 | SNV | Missense_Mutation | novel | c.128C>T | p.Ser43Leu | p.S43L | P15408 | protein_coding | deleterious(0) | probably_damaging(0.987) | TCGA-AN-A0XW-01 | Breast | breast invasive carcinoma | Female | <65 | III/IV | Unknown | Unknown | SD |
| FOSL2 | SNV | Missense_Mutation | c.439N>C | p.Glu147Gln | p.E147Q | P15408 | protein_coding | deleterious(0) | probably_damaging(0.99) | TCGA-E2-A15L-01 | Breast | breast invasive carcinoma | Female | >=65 | I/II | Hormone Therapy | arimidex | SD | |
| FOSL2 | insertion | Frame_Shift_Ins | novel | c.911_912insGCAATCT | p.His304GlnfsTer8 | p.H304Qfs*8 | P15408 | protein_coding | TCGA-BH-A0HF-01 | Breast | breast invasive carcinoma | Female | >=65 | I/II | Hormone Therapy | arimidex | SD | ||
| FOSL2 | SNV | Missense_Mutation | novel | c.534G>T | p.Glu178Asp | p.E178D | P15408 | protein_coding | tolerated(0.16) | benign(0.018) | TCGA-2W-A8YY-01 | Cervix | cervical & endocervical cancer | Female | <65 | I/II | Chemotherapy | cisplatin | CR |
| FOSL2 | SNV | Missense_Mutation | c.58N>G | p.Pro20Ala | p.P20A | P15408 | protein_coding | deleterious(0.01) | possibly_damaging(0.757) | TCGA-EK-A2RJ-01 | Cervix | cervical & endocervical cancer | Female | <65 | I/II | Unknown | Unknown | SD | |
| FOSL2 | SNV | Missense_Mutation | rs143327177 | c.596N>A | p.Arg199Gln | p.R199Q | P15408 | protein_coding | tolerated(0.65) | benign(0.003) | TCGA-AZ-4315-01 | Colorectum | colon adenocarcinoma | Male | <65 | I/II | Unknown | Unknown | SD |
| FOSL2 | SNV | Missense_Mutation | rs199613963 | c.248N>T | p.Ser83Ile | p.S83I | P15408 | protein_coding | deleterious(0.03) | possibly_damaging(0.758) | TCGA-AG-A002-01 | Colorectum | rectum adenocarcinoma | Male | <65 | I/II | Unknown | Unknown | SD |
| FOSL2 | SNV | Missense_Mutation | novel | c.908N>T | p.Ala303Val | p.A303V | P15408 | protein_coding | tolerated(0.06) | probably_damaging(0.986) | TCGA-A5-A0G2-01 | Endometrium | uterine corpus endometrioid carcinoma | Female | <65 | III/IV | Unknown | Unknown | SD |
| FOSL2 | SNV | Missense_Mutation | novel | c.331N>T | p.Gly111Cys | p.G111C | P15408 | protein_coding | deleterious(0.01) | probably_damaging(0.927) | TCGA-AJ-A3OJ-01 | Endometrium | uterine corpus endometrioid carcinoma | Female | <65 | I/II | Chemotherapy | carboplatin | CR |
| FOSL2 | SNV | Missense_Mutation | c.383G>A | p.Arg128His | p.R128H | P15408 | protein_coding | deleterious(0) | probably_damaging(0.998) | TCGA-AP-A059-01 | Endometrium | uterine corpus endometrioid carcinoma | Female | >=65 | I/II | Unknown | Unknown | SD |
| Page: 1 2 3 4 5 |
Top |
Related drugs of malignant transformation related genes |
| Identification of chemicals and drugs interact with genes involved in malignant transfromation |
| (DGIdb 4.0) |
| Entrez ID | Symbol | Category | Interaction Types | Drug Claim Name | Drug Name | PMIDs |
| Page: 1 |

Copyright 2023-Present -The University of Texas Health Science Center at Houston |