
|
|||||
|
 | |
| |
| |
| |
| |
| |
|
Gene: FOSL1 |
Gene summary for FOSL1 |
| Gene information | Species | Human | Gene symbol | FOSL1 | Gene ID | 8061 |
| Gene name | FOS like 1, AP-1 transcription factor subunit | |
| Gene Alias | FRA | |
| Cytomap | 11q13.1 | |
| Gene Type | protein-coding | GO ID | GO:0000003 | UniProtAcc | E9PPX2 |
Top |
Malignant transformation analysis |
| Identification of the aberrant gene expression in precancerous and cancerous lesions by comparing the gene expression of stem-like cells in diseased tissues with normal stem cells |
| Entrez ID | Symbol | Replicates | Species | Organ | Tissue | Adj P-value | Log2FC | Malignancy |
| 8061 | FOSL1 | sample1 | Human | Cervix | CC | 3.40e-23 | 8.78e-01 | 0.0959 |
| 8061 | FOSL1 | sample3 | Human | Cervix | CC | 2.40e-03 | 2.57e-01 | 0.1387 |
| 8061 | FOSL1 | T1 | Human | Cervix | CC | 2.11e-32 | 7.51e-01 | 0.0918 |
| 8061 | FOSL1 | T3 | Human | Cervix | CC | 5.75e-05 | 3.00e-01 | 0.1389 |
| 8061 | FOSL1 | AEH-subject1 | Human | Endometrium | AEH | 1.84e-20 | 4.87e-01 | -0.3059 |
| 8061 | FOSL1 | AEH-subject2 | Human | Endometrium | AEH | 8.02e-07 | 3.67e-01 | -0.2525 |
| 8061 | FOSL1 | AEH-subject3 | Human | Endometrium | AEH | 1.44e-08 | 3.19e-01 | -0.2576 |
| 8061 | FOSL1 | EEC-subject1 | Human | Endometrium | EEC | 2.97e-14 | 4.00e-01 | -0.2682 |
| 8061 | FOSL1 | EEC-subject2 | Human | Endometrium | EEC | 1.21e-02 | 2.17e-01 | -0.2607 |
| 8061 | FOSL1 | EEC-subject3 | Human | Endometrium | EEC | 8.37e-04 | 2.23e-01 | -0.2525 |
| 8061 | FOSL1 | EEC-subject5 | Human | Endometrium | EEC | 6.46e-09 | 2.82e-01 | -0.249 |
| 8061 | FOSL1 | GSM5276934 | Human | Endometrium | EEC | 2.70e-23 | 5.05e-01 | -0.0913 |
| 8061 | FOSL1 | GSM5276937 | Human | Endometrium | EEC | 1.55e-29 | 6.81e-01 | -0.0897 |
| 8061 | FOSL1 | LZE7T | Human | Esophagus | ESCC | 5.03e-05 | -1.79e-01 | 0.0667 |
| 8061 | FOSL1 | LZE20T | Human | Esophagus | ESCC | 7.07e-05 | 9.91e-01 | 0.0662 |
| 8061 | FOSL1 | LZE24T | Human | Esophagus | ESCC | 2.97e-04 | 1.14e+00 | 0.0596 |
| 8061 | FOSL1 | P2T-E | Human | Esophagus | ESCC | 6.74e-07 | 4.52e-01 | 0.1177 |
| 8061 | FOSL1 | P4T-E | Human | Esophagus | ESCC | 1.91e-25 | 2.22e+00 | 0.1323 |
| 8061 | FOSL1 | P5T-E | Human | Esophagus | ESCC | 3.06e-33 | 1.43e+00 | 0.1327 |
| 8061 | FOSL1 | P8T-E | Human | Esophagus | ESCC | 6.25e-04 | 6.92e-01 | 0.0889 |
| Page: 1 2 3 4 5 6 |
| Tissue | Expression Dynamics | Abbreviation |
| Cervix | 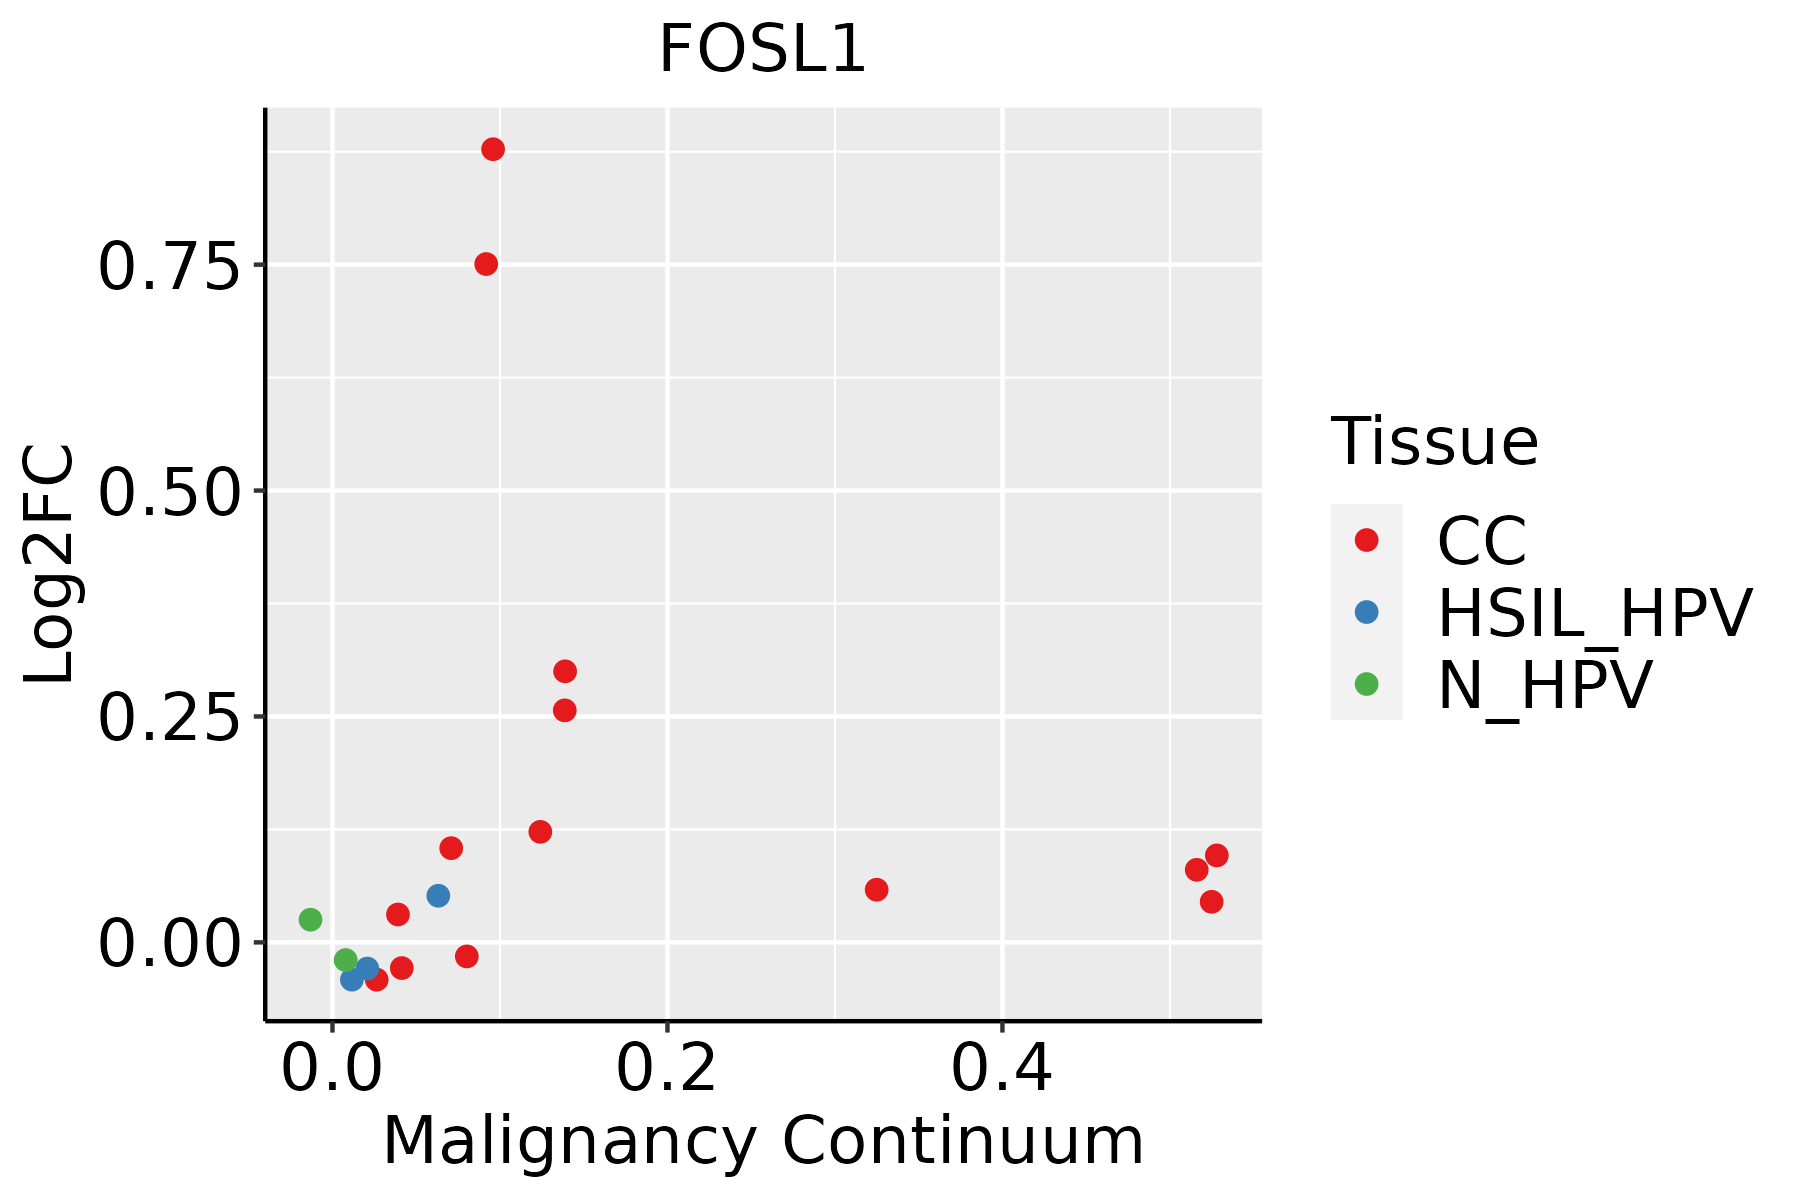 | CC: Cervix cancer |
| HSIL_HPV: HPV-infected high-grade squamous intraepithelial lesions | ||
| N_HPV: HPV-infected normal cervix | ||
| Endometrium | 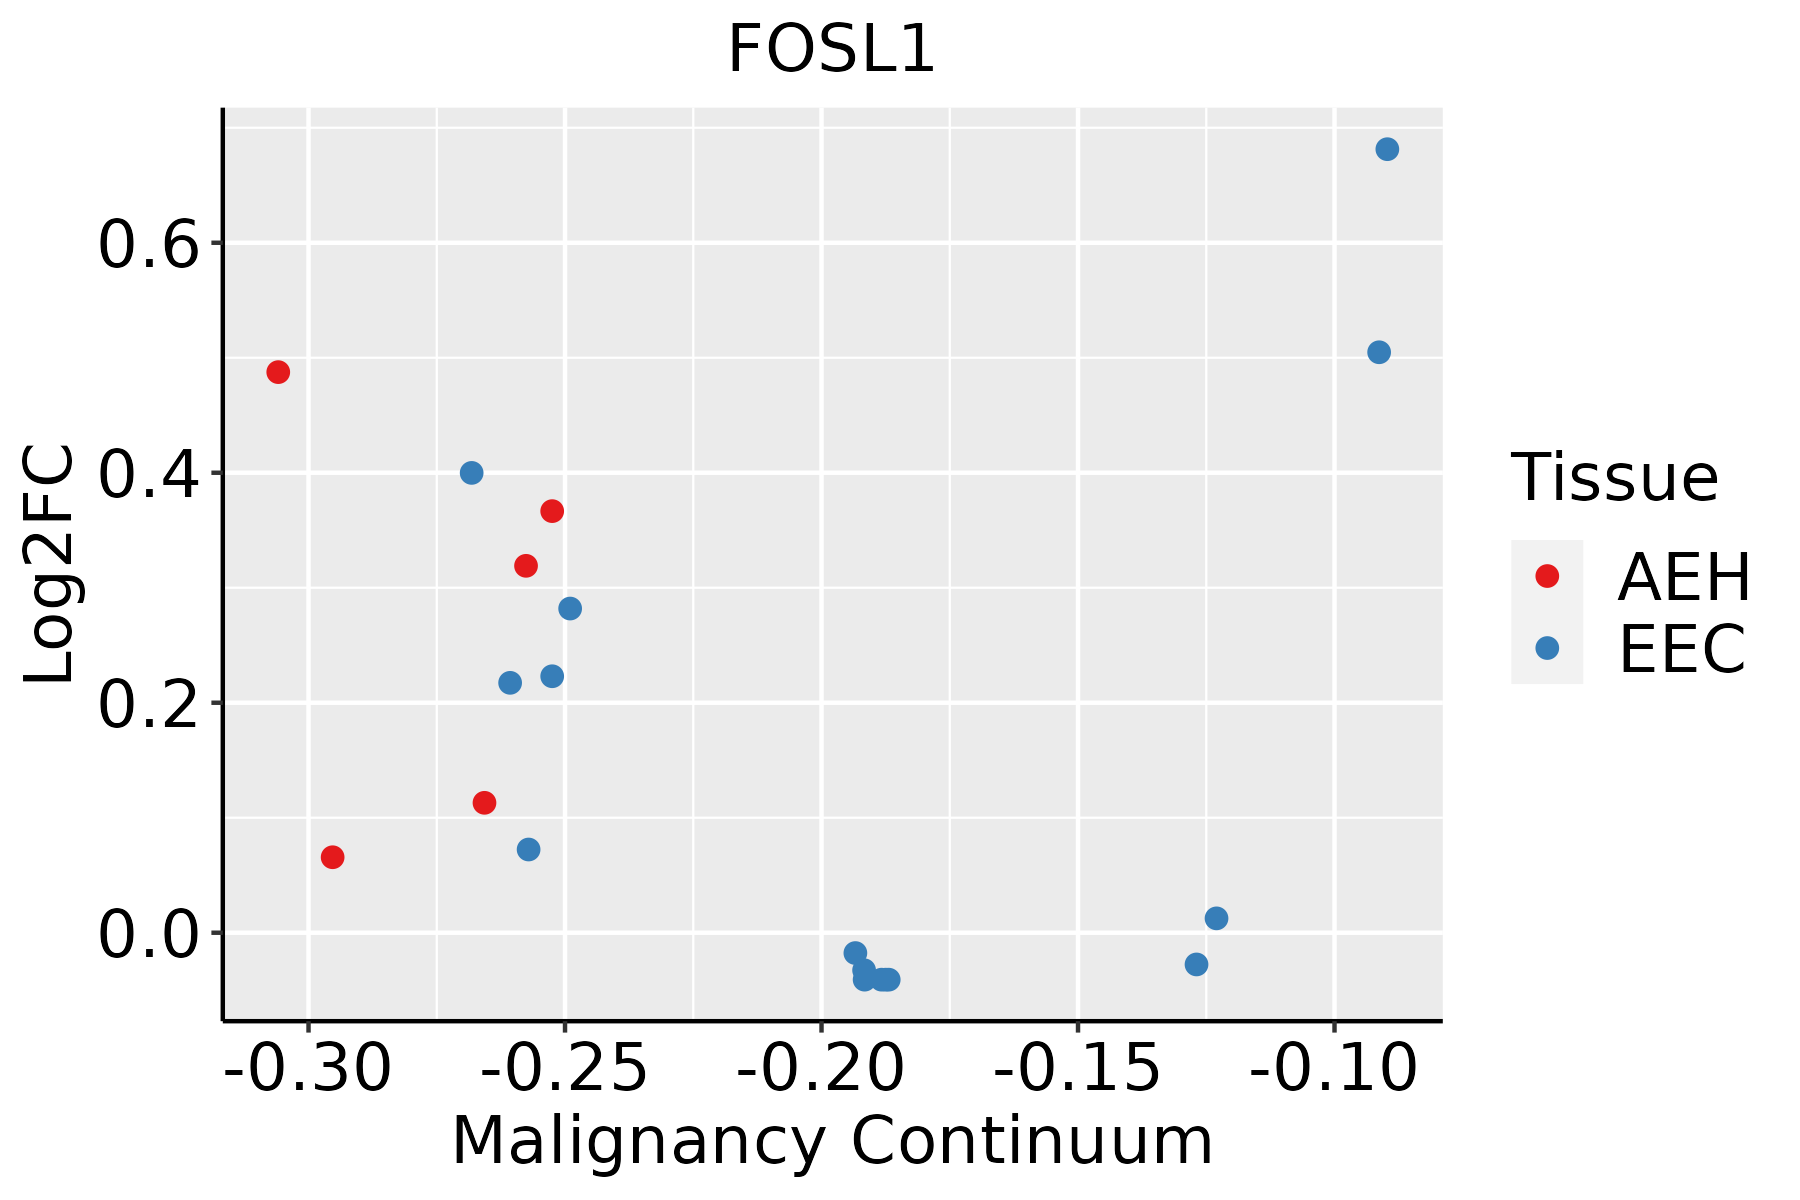 | AEH: Atypical endometrial hyperplasia |
| EEC: Endometrioid Cancer | ||
| Esophagus |  | ESCC: Esophageal squamous cell carcinoma |
| HGIN: High-grade intraepithelial neoplasias | ||
| LGIN: Low-grade intraepithelial neoplasias | ||
| Liver |  | HCC: Hepatocellular carcinoma |
| NAFLD: Non-alcoholic fatty liver disease | ||
| Lung | 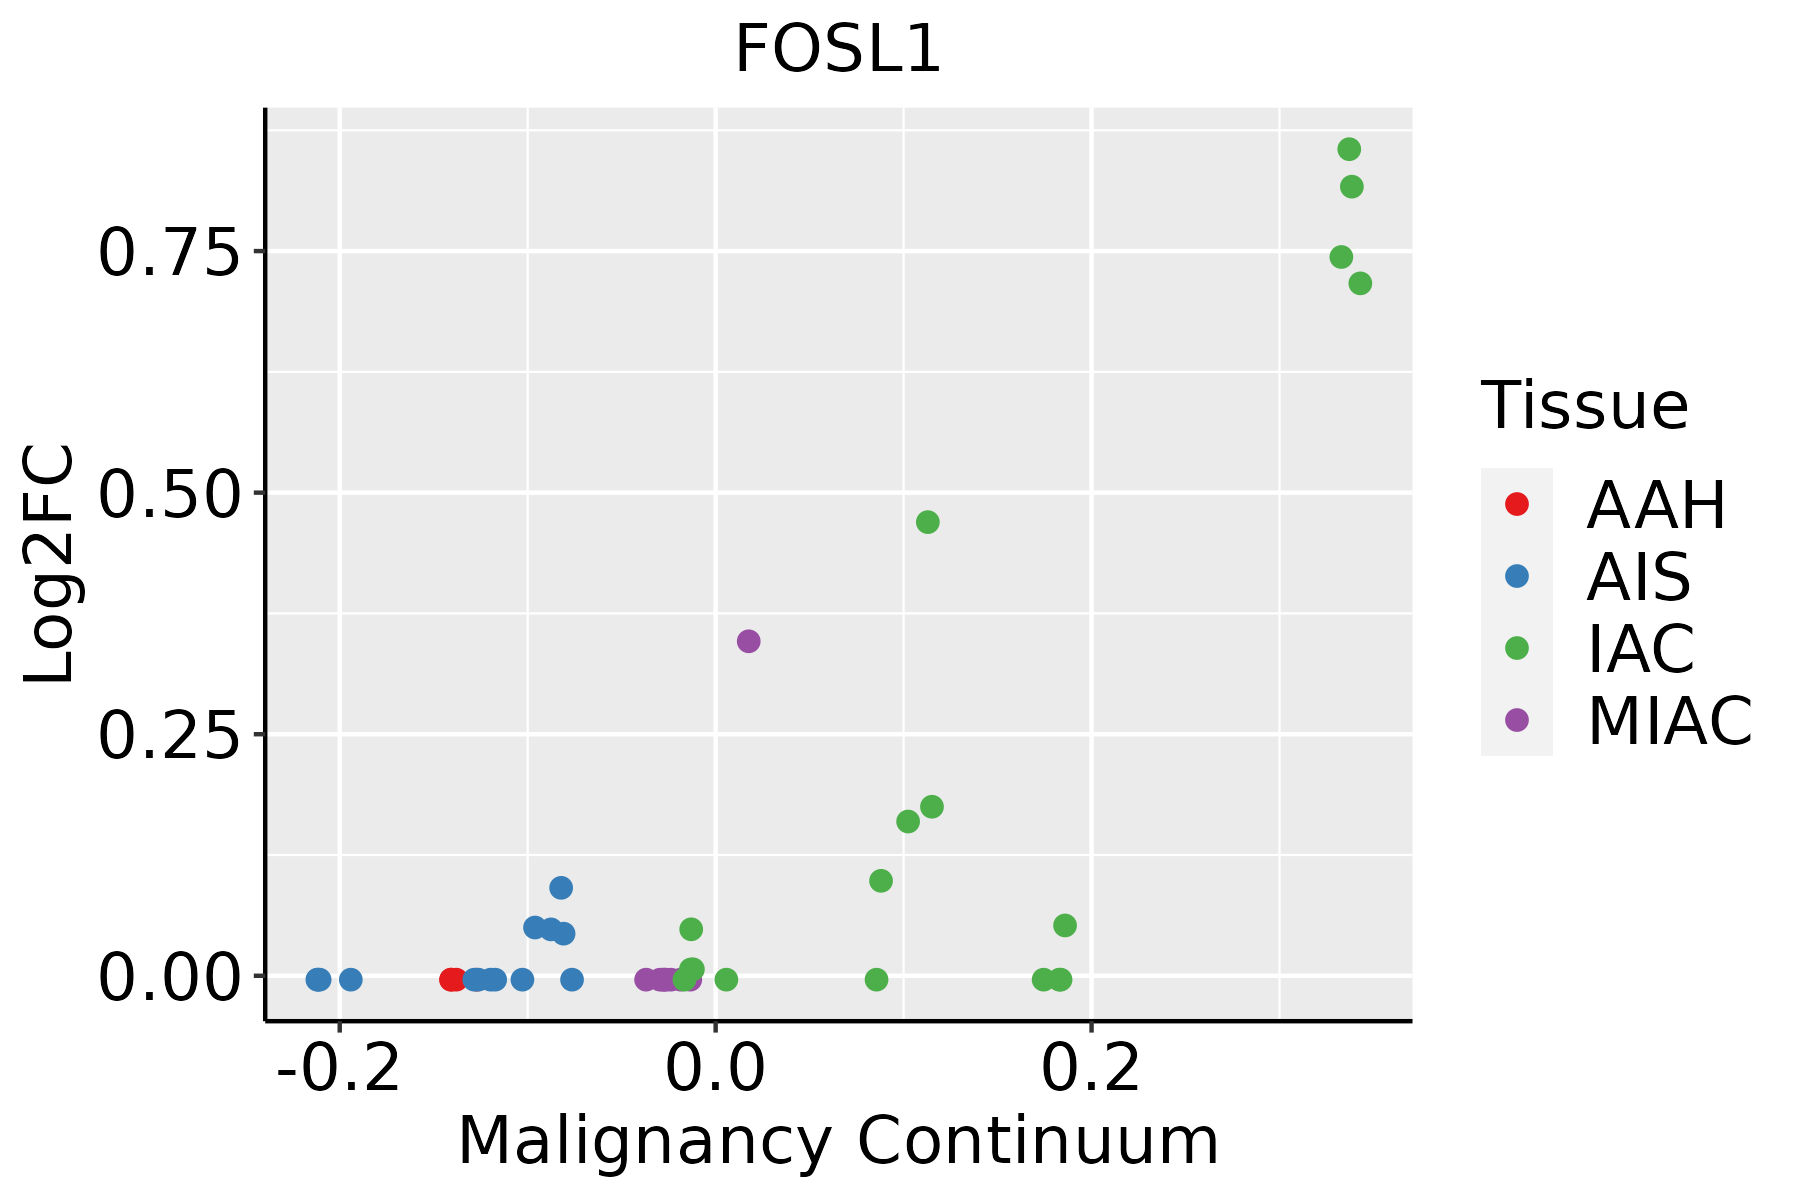 | AAH: Atypical adenomatous hyperplasia |
| AIS: Adenocarcinoma in situ | ||
| IAC: Invasive lung adenocarcinoma | ||
| MIA: Minimally invasive adenocarcinoma | ||
| Oral Cavity | 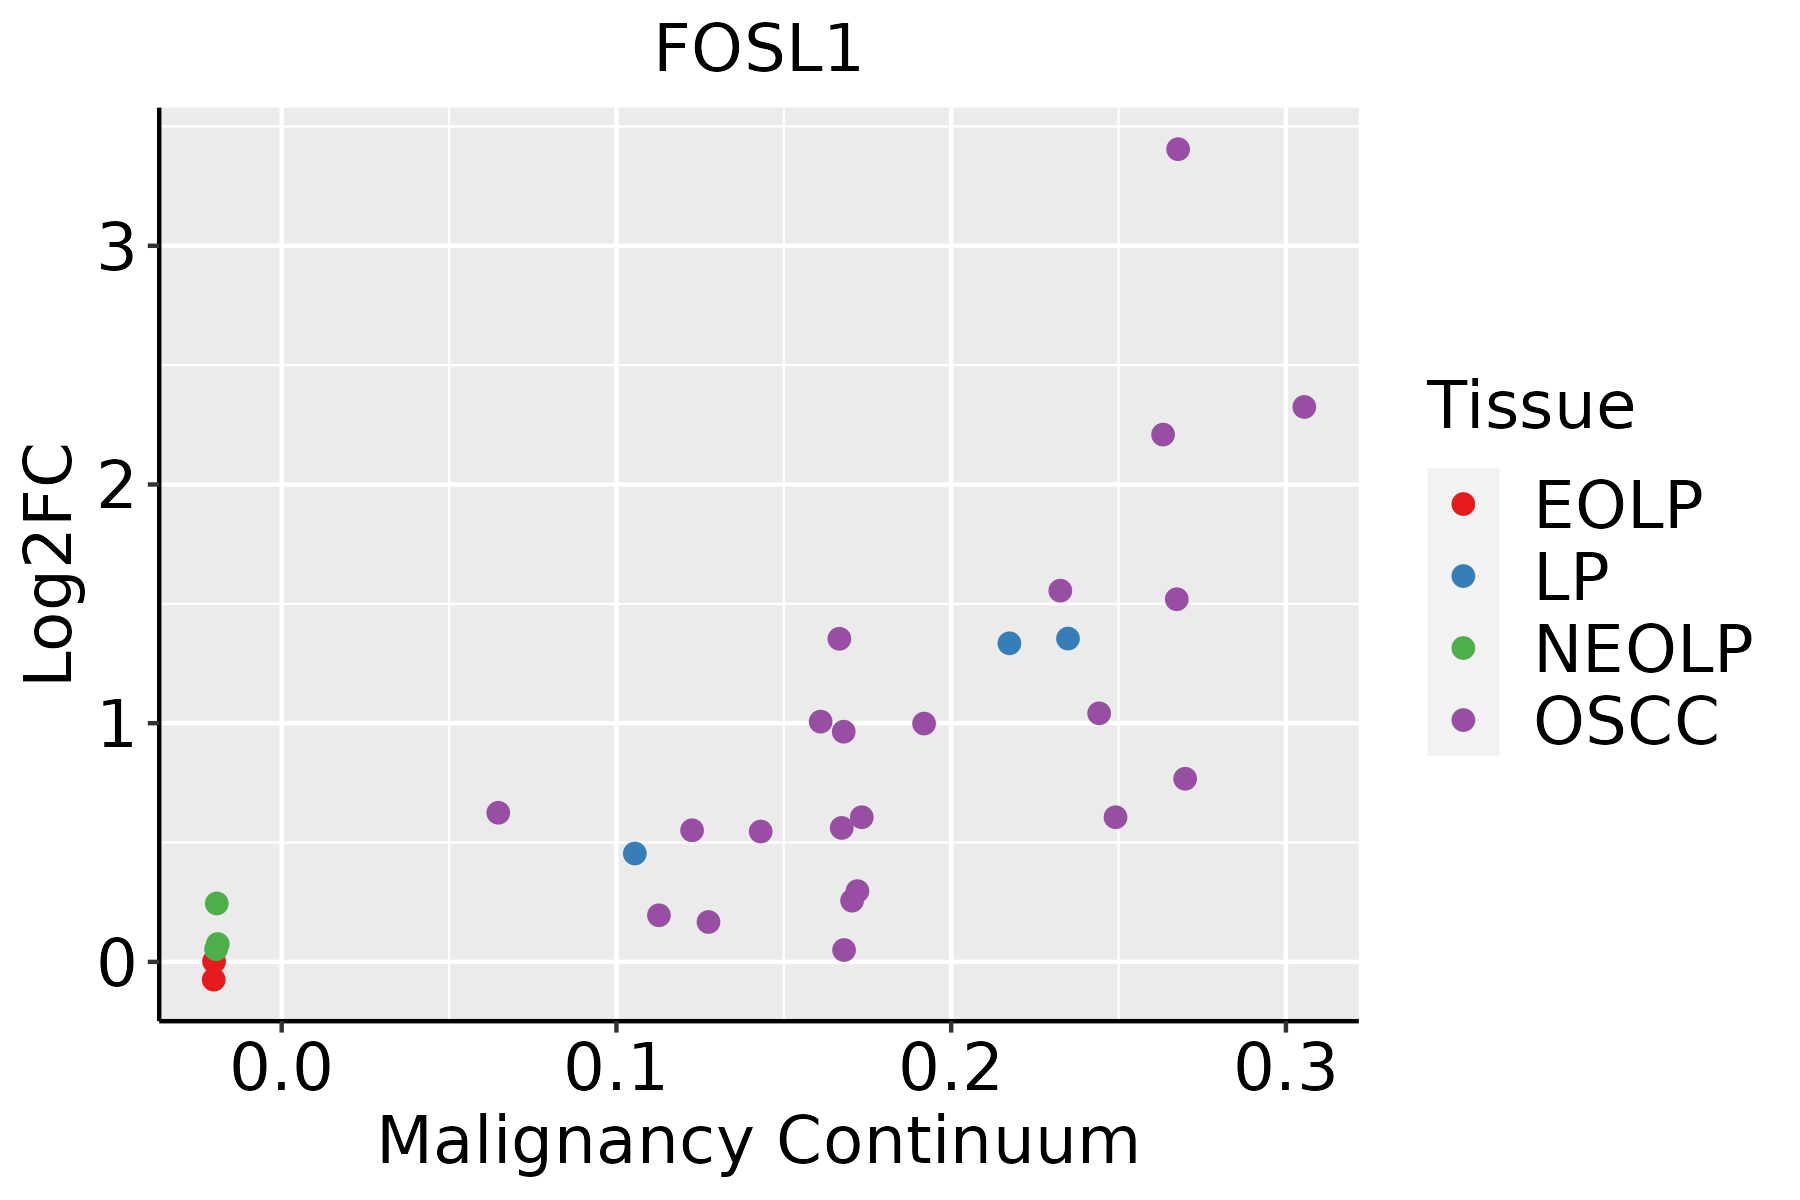 | EOLP: Erosive Oral lichen planus |
| LP: leukoplakia | ||
| NEOLP: Non-erosive oral lichen planus | ||
| OSCC: Oral squamous cell carcinoma | ||
| Prostate | 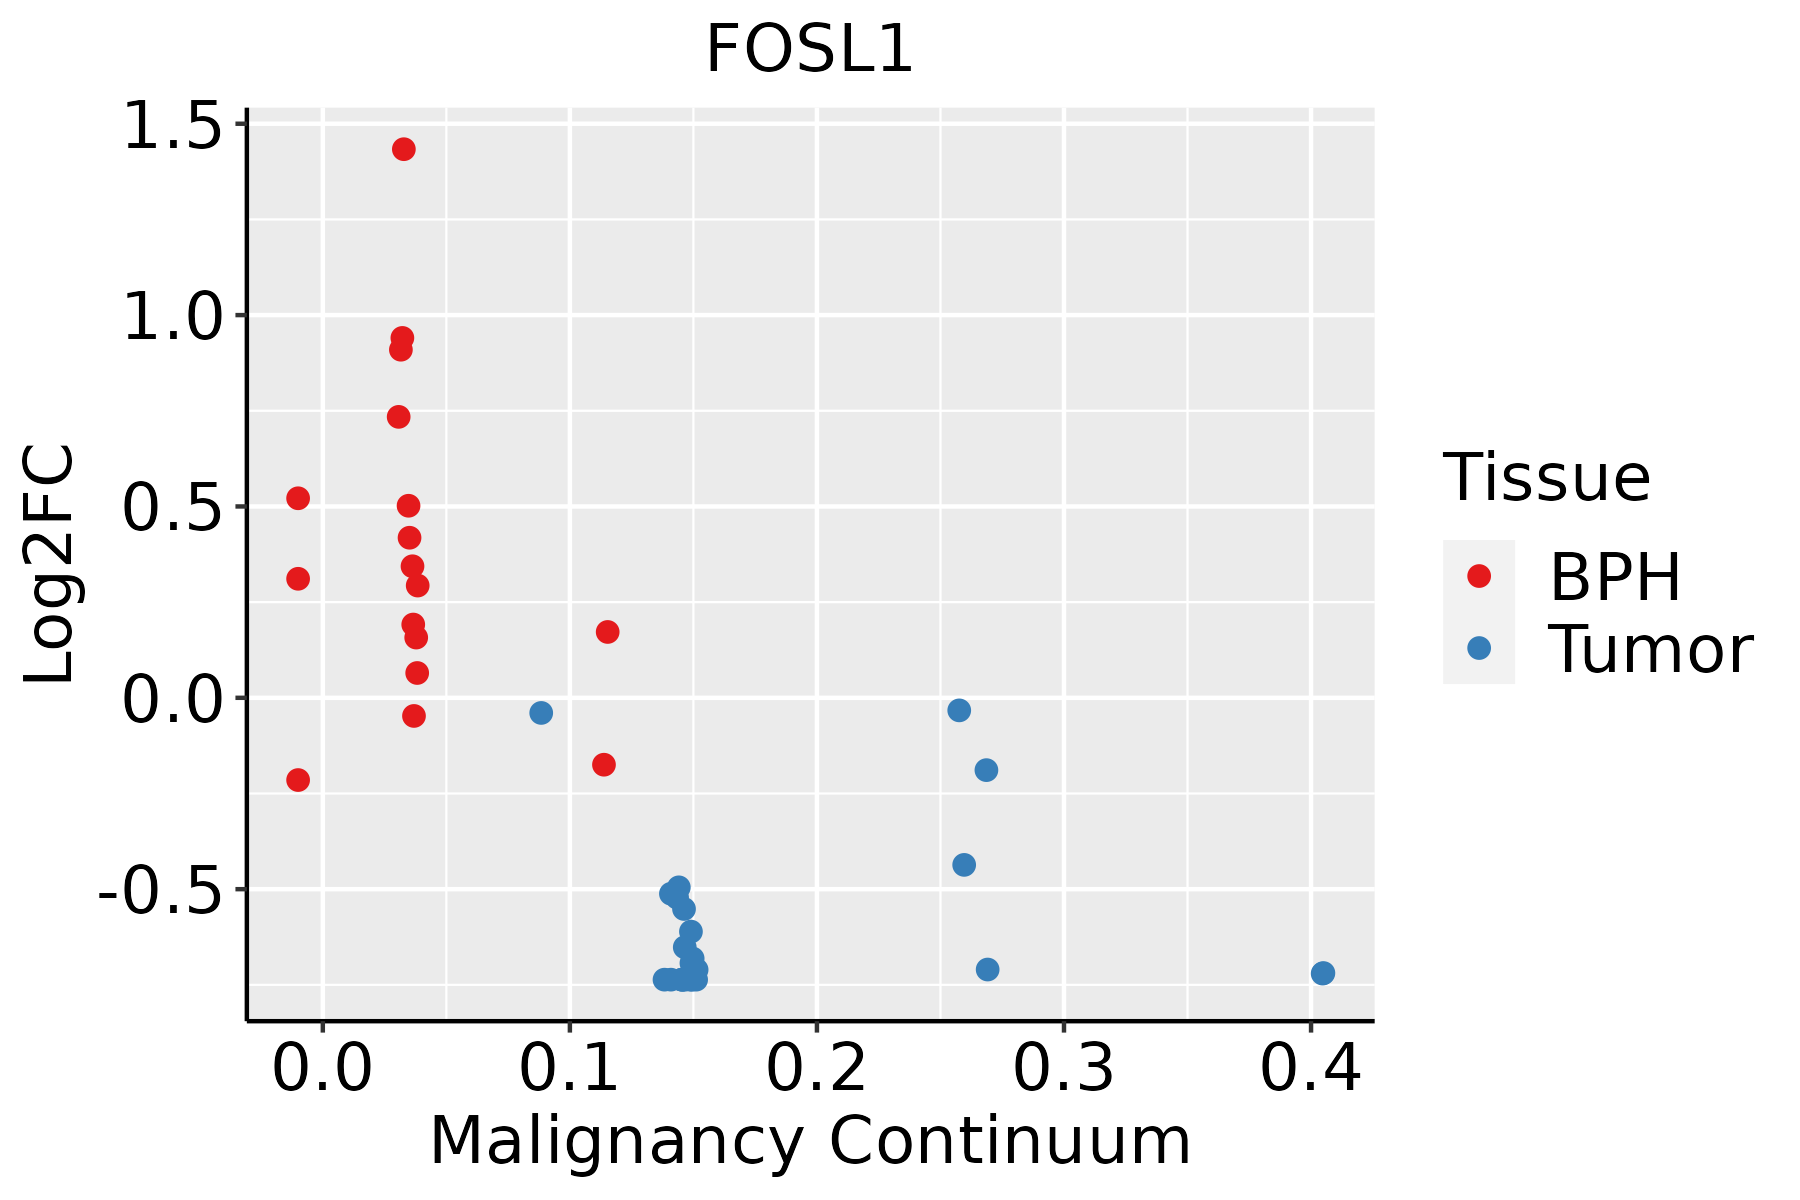 | BPH: Benign Prostatic Hyperplasia |
| Skin | 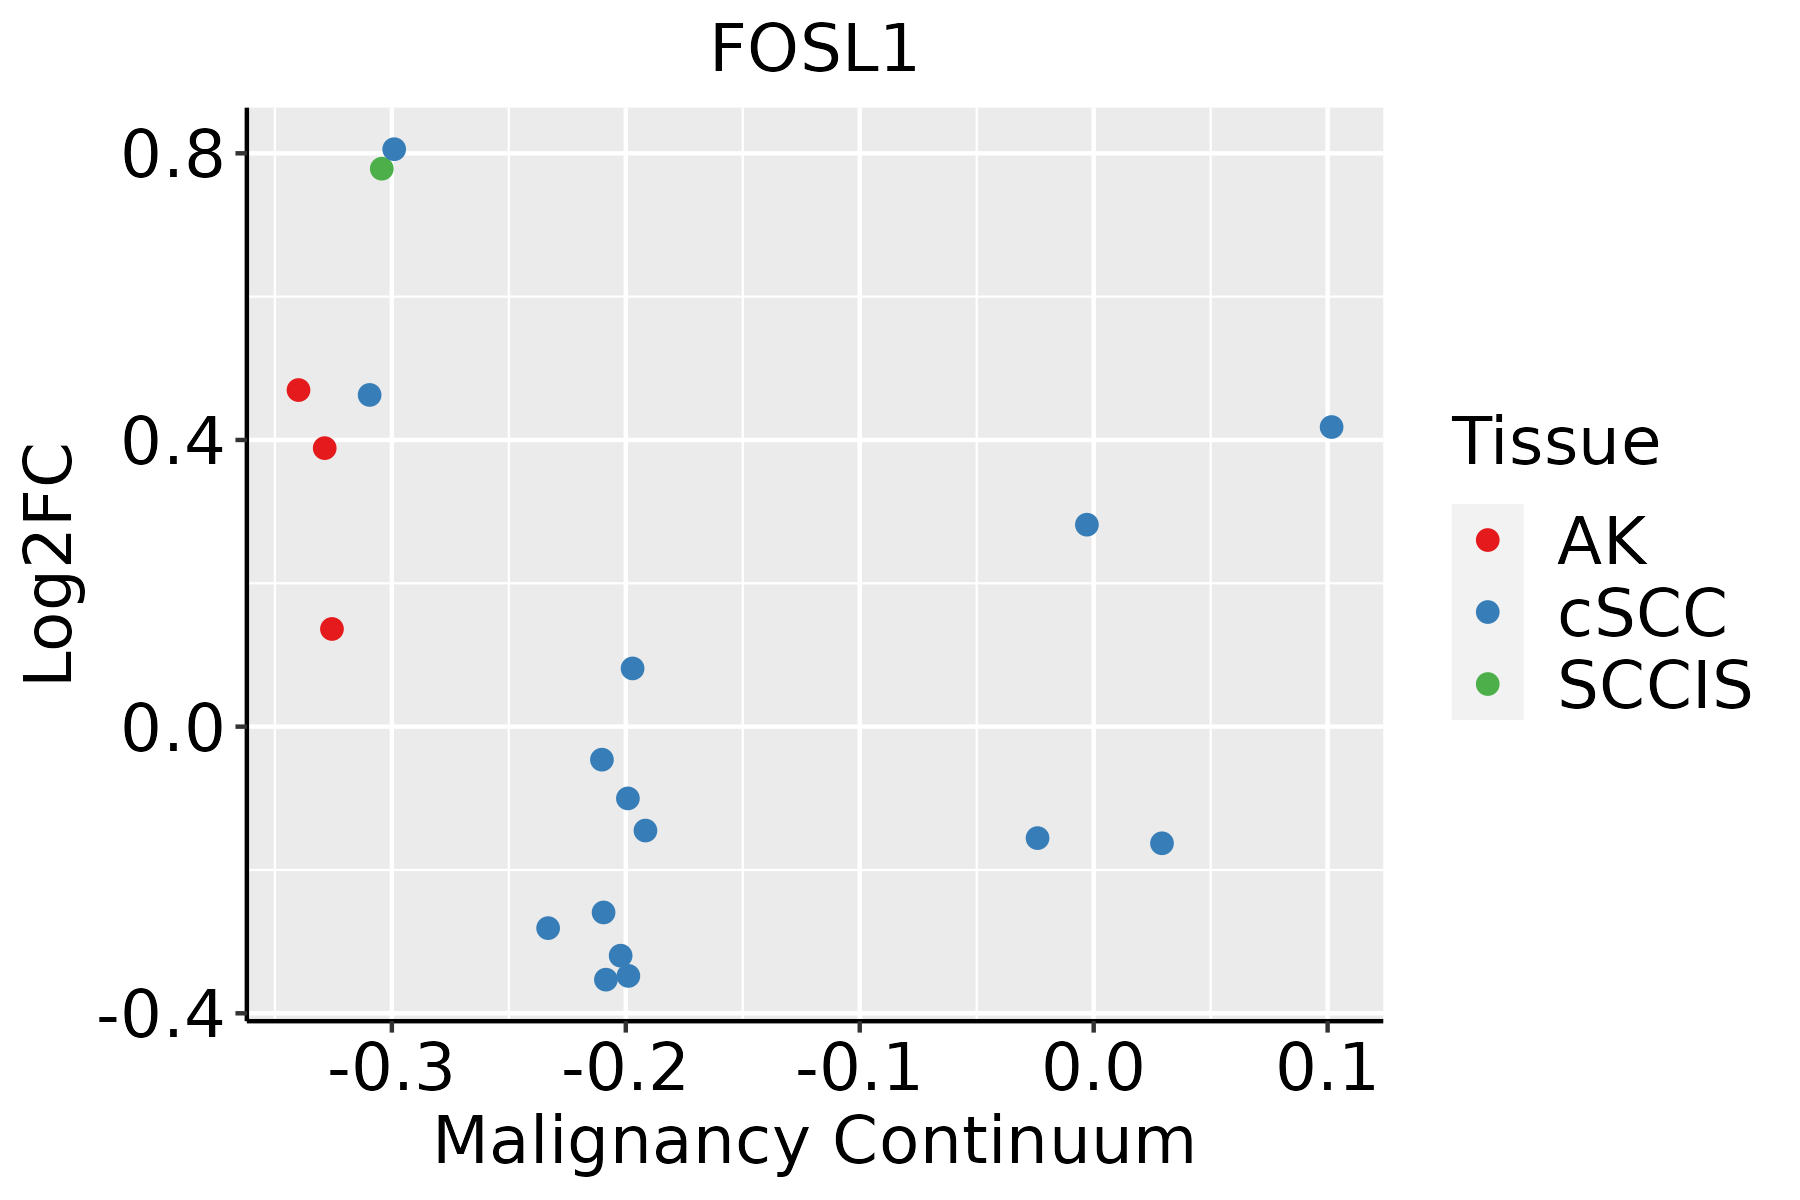 | AK: Actinic keratosis |
| cSCC: Cutaneous squamous cell carcinoma | ||
| SCCIS:squamous cell carcinoma in situ |
| ∗log2FC in expression of this searched gene in stem-like cells from each diseased tissue sample relative to stem-like cells in normal samples in each tissue plotted against the malignancy continuum. Samples are colored based on if they are from different disease stage. |
Top |
Malignant transformation related pathway analysis |
| Find out the enriched GO biological processes and KEGG pathways involved in transition from healthy to precancer to cancer |
| Tissue | Disease Stage | Enriched GO biological Processes |
| Colorectum | AD |  |
| Colorectum | SER |  |
| Colorectum | MSS |  |
| Colorectum | MSI-H |  |
| Colorectum | FAP |  |
| ∗Top 15 enriched GO BP terms are showed in the bar plot of each disease state in each tissue. Each row represents a significant GO biological process which is colored according to the -log10(p.adjust). |
| Page: 1 2 3 4 5 6 7 8 9 |
| GO ID | Tissue | Disease Stage | Description | Gene Ratio | Bg Ratio | pvalue | p.adjust | Count |
| GO:000697910 | Cervix | CC | response to oxidative stress | 102/2311 | 446/18723 | 2.99e-10 | 4.36e-08 | 102 |
| GO:007149610 | Cervix | CC | cellular response to external stimulus | 78/2311 | 320/18723 | 1.82e-09 | 1.98e-07 | 78 |
| GO:000030210 | Cervix | CC | response to reactive oxygen species | 56/2311 | 222/18723 | 1.00e-07 | 5.25e-06 | 56 |
| GO:00316689 | Cervix | CC | cellular response to extracellular stimulus | 59/2311 | 246/18723 | 3.03e-07 | 1.24e-05 | 59 |
| GO:00018908 | Cervix | CC | placenta development | 40/2311 | 144/18723 | 4.59e-07 | 1.77e-05 | 40 |
| GO:004854510 | Cervix | CC | response to steroid hormone | 74/2311 | 339/18723 | 5.71e-07 | 2.09e-05 | 74 |
| GO:004254210 | Cervix | CC | response to hydrogen peroxide | 40/2311 | 146/18723 | 6.79e-07 | 2.46e-05 | 40 |
| GO:00614588 | Cervix | CC | reproductive system development | 87/2311 | 427/18723 | 1.37e-06 | 4.55e-05 | 87 |
| GO:00486088 | Cervix | CC | reproductive structure development | 86/2311 | 424/18723 | 1.90e-06 | 5.97e-05 | 86 |
| GO:00616148 | Cervix | CC | pri-miRNA transcription by RNA polymerase II | 20/2311 | 55/18723 | 4.22e-06 | 1.09e-04 | 20 |
| GO:00510904 | Cervix | CC | regulation of DNA-binding transcription factor activity | 87/2311 | 440/18723 | 4.85e-06 | 1.22e-04 | 87 |
| GO:00457876 | Cervix | CC | positive regulation of cell cycle | 66/2311 | 313/18723 | 7.78e-06 | 1.81e-04 | 66 |
| GO:19028938 | Cervix | CC | regulation of pri-miRNA transcription by RNA polymerase II | 19/2311 | 54/18723 | 1.27e-05 | 2.60e-04 | 19 |
| GO:190165410 | Cervix | CC | response to ketone | 45/2311 | 194/18723 | 1.83e-05 | 3.44e-04 | 45 |
| GO:00096158 | Cervix | CC | response to virus | 73/2311 | 367/18723 | 2.22e-05 | 3.95e-04 | 73 |
| GO:00096127 | Cervix | CC | response to mechanical stimulus | 48/2311 | 216/18723 | 3.23e-05 | 5.29e-04 | 48 |
| GO:00319609 | Cervix | CC | response to corticosteroid | 39/2311 | 167/18723 | 5.48e-05 | 8.06e-04 | 39 |
| GO:00017018 | Cervix | CC | in utero embryonic development | 71/2311 | 367/18723 | 7.21e-05 | 1.00e-03 | 71 |
| GO:00075654 | Cervix | CC | female pregnancy | 43/2311 | 193/18723 | 7.62e-05 | 1.04e-03 | 43 |
| GO:19028955 | Cervix | CC | positive regulation of pri-miRNA transcription by RNA polymerase II | 15/2311 | 42/18723 | 8.42e-05 | 1.13e-03 | 15 |
| Page: 1 2 3 4 5 6 7 8 9 10 11 12 13 14 15 16 17 18 19 |
| Pathway ID | Tissue | Disease Stage | Description | Gene Ratio | Bg Ratio | pvalue | p.adjust | qvalue | Count |
| hsa0516620 | Cervix | CC | Human T-cell leukemia virus 1 infection | 61/1267 | 222/8465 | 8.13e-07 | 7.98e-06 | 4.72e-06 | 61 |
| hsa0465718 | Cervix | CC | IL-17 signaling pathway | 31/1267 | 94/8465 | 8.71e-06 | 7.43e-05 | 4.39e-05 | 31 |
| hsa043109 | Cervix | CC | Wnt signaling pathway | 43/1267 | 171/8465 | 3.03e-04 | 1.64e-03 | 9.68e-04 | 43 |
| hsa05166110 | Cervix | CC | Human T-cell leukemia virus 1 infection | 61/1267 | 222/8465 | 8.13e-07 | 7.98e-06 | 4.72e-06 | 61 |
| hsa0465719 | Cervix | CC | IL-17 signaling pathway | 31/1267 | 94/8465 | 8.71e-06 | 7.43e-05 | 4.39e-05 | 31 |
| hsa0431012 | Cervix | CC | Wnt signaling pathway | 43/1267 | 171/8465 | 3.03e-04 | 1.64e-03 | 9.68e-04 | 43 |
| hsa0516626 | Endometrium | AEH | Human T-cell leukemia virus 1 infection | 50/1197 | 222/8465 | 4.30e-04 | 3.11e-03 | 2.27e-03 | 50 |
| hsa0431010 | Endometrium | AEH | Wnt signaling pathway | 37/1197 | 171/8465 | 4.68e-03 | 2.53e-02 | 1.86e-02 | 37 |
| hsa05166111 | Endometrium | AEH | Human T-cell leukemia virus 1 infection | 50/1197 | 222/8465 | 4.30e-04 | 3.11e-03 | 2.27e-03 | 50 |
| hsa0431013 | Endometrium | AEH | Wnt signaling pathway | 37/1197 | 171/8465 | 4.68e-03 | 2.53e-02 | 1.86e-02 | 37 |
| hsa0516627 | Endometrium | EEC | Human T-cell leukemia virus 1 infection | 52/1237 | 222/8465 | 2.73e-04 | 2.36e-03 | 1.76e-03 | 52 |
| hsa0431022 | Endometrium | EEC | Wnt signaling pathway | 40/1237 | 171/8465 | 1.37e-03 | 8.99e-03 | 6.70e-03 | 40 |
| hsa0465720 | Endometrium | EEC | IL-17 signaling pathway | 23/1237 | 94/8465 | 7.61e-03 | 3.63e-02 | 2.71e-02 | 23 |
| hsa0516636 | Endometrium | EEC | Human T-cell leukemia virus 1 infection | 52/1237 | 222/8465 | 2.73e-04 | 2.36e-03 | 1.76e-03 | 52 |
| hsa0431032 | Endometrium | EEC | Wnt signaling pathway | 40/1237 | 171/8465 | 1.37e-03 | 8.99e-03 | 6.70e-03 | 40 |
| hsa04657110 | Endometrium | EEC | IL-17 signaling pathway | 23/1237 | 94/8465 | 7.61e-03 | 3.63e-02 | 2.71e-02 | 23 |
| hsa05166211 | Esophagus | ESCC | Human T-cell leukemia virus 1 infection | 164/4205 | 222/8465 | 8.13e-14 | 2.09e-12 | 1.07e-12 | 164 |
| hsa0465727 | Esophagus | ESCC | IL-17 signaling pathway | 66/4205 | 94/8465 | 3.93e-05 | 1.75e-04 | 8.99e-05 | 66 |
| hsa05166310 | Esophagus | ESCC | Human T-cell leukemia virus 1 infection | 164/4205 | 222/8465 | 8.13e-14 | 2.09e-12 | 1.07e-12 | 164 |
| hsa0465734 | Esophagus | ESCC | IL-17 signaling pathway | 66/4205 | 94/8465 | 3.93e-05 | 1.75e-04 | 8.99e-05 | 66 |
| Page: 1 2 3 |
Top |
Cell-cell communication analysis |
| Identification of potential cell-cell interactions between two cell types and their ligand-receptor pairs for different disease states |
| Ligand | Receptor | LRpair | Pathway | Tissue | Disease Stage |
| Page: 1 |
Top |
Single-cell gene regulatory network inference analysis |
| Find out the significant the regulons (TFs) and the target genes of each regulon across cell types for different disease states |
| TF | Cell Type | Tissue | Disease Stage | Target Gene | RSS | Regulon Activity |
| FOSL1 | STM | Cervix | ADJ | TNFRSF12A,IL32,HLA-G, etc. | 1.64e-01 |  |
| FOSL1 | SMC | Cervix | Healthy | INSIG1,CSF3,PNP, etc. | 8.33e-01 |  |
| FOSL1 | SURF | Endometrium | EEC | PLAUR,SQSTM1,TXNRD1, etc. | 3.71e-01 |  |
| FOSL1 | TREG | Esophagus | ESCC | KPNA1,NEK7,NAPEPLD, etc. | 1.64e-01 |  |
| FOSL1 | MAST | Pancreas | ADJ | MMP24,NRIP3,PPP1R15A, etc. | 1.49e-01 |  |
| FOSL1 | MAST | Pancreas | PDAC | MMP24,NRIP3,PPP1R15A, etc. | 1.96e-01 |  |
| FOSL1 | STM | Prostate | ADJ | HMGA1,EIF4A1,SFN, etc. | 3.28e-01 |  |
| FOSL1 | BAS | Prostate | BPH | HMGA1,EIF4A1,SFN, etc. | 3.23e-01 |  |
| ∗The dot plots of a searched regulon are shown for all cell subpopulations in each disease state of each tissue based on the regulon specific score inferred using pySCENIC and by calculating the average expression. |
| Page: 1 |
Top |
Somatic mutation of malignant transformation related genes |
| Annotation of somatic variants for genes involved in malignant transformation |
| Hugo Symbol | Variant Class | Variant Classification | dbSNP RS | HGVSc | HGVSp | HGVSp Short | SWISSPROT | BIOTYPE | SIFT | PolyPhen | Tumor Sample Barcode | Tissue | Histology | Sex | Age | Stage | Therapy Types | Drugs | Outcome |
| FOSL1 | SNV | Missense_Mutation | novel | c.8N>C | p.Arg3Pro | p.R3P | P15407 | protein_coding | deleterious(0.01) | probably_damaging(0.989) | TCGA-5L-AAT1-01 | Breast | breast invasive carcinoma | Female | <65 | III/IV | Hormone Therapy | letrozol | SD |
| FOSL1 | SNV | Missense_Mutation | rs759636377 | c.478N>T | p.Arg160Cys | p.R160C | P15407 | protein_coding | deleterious(0) | probably_damaging(0.991) | TCGA-AU-6004-01 | Colorectum | colon adenocarcinoma | Female | >=65 | I/II | Unknown | Unknown | SD |
| FOSL1 | SNV | Missense_Mutation | novel | c.188N>T | p.Ser63Ile | p.S63I | P15407 | protein_coding | tolerated(0.18) | benign(0.335) | TCGA-AY-4070-01 | Colorectum | colon adenocarcinoma | Female | <65 | III/IV | Chemotherapy | 5-fu | PD |
| FOSL1 | SNV | Missense_Mutation | rs779143676 | c.281N>A | p.Arg94Gln | p.R94Q | P15407 | protein_coding | deleterious(0) | probably_damaging(0.978) | TCGA-CM-4751-01 | Colorectum | colon adenocarcinoma | Male | <65 | III/IV | Chemotherapy | oxaliplatin | SD |
| FOSL1 | SNV | Missense_Mutation | rs564101721 | c.590G>A | p.Arg197His | p.R197H | P15407 | protein_coding | tolerated(0.1) | benign(0) | TCGA-G4-6586-01 | Colorectum | colon adenocarcinoma | Female | >=65 | I/II | Unknown | Unknown | SD |
| FOSL1 | SNV | Missense_Mutation | rs763454407 | c.766N>A | p.Gly256Arg | p.G256R | P15407 | protein_coding | deleterious(0.01) | probably_damaging(0.999) | TCGA-A5-A0G2-01 | Endometrium | uterine corpus endometrioid carcinoma | Female | <65 | III/IV | Unknown | Unknown | SD |
| FOSL1 | SNV | Missense_Mutation | rs763454407 | c.766N>A | p.Gly256Arg | p.G256R | P15407 | protein_coding | deleterious(0.01) | probably_damaging(0.999) | TCGA-A5-A0VP-01 | Endometrium | uterine corpus endometrioid carcinoma | Female | >=65 | I/II | Unknown | Unknown | SD |
| FOSL1 | SNV | Missense_Mutation | novel | c.592N>A | p.Pro198Thr | p.P198T | P15407 | protein_coding | tolerated(0.08) | benign(0.023) | TCGA-BG-A222-01 | Endometrium | uterine corpus endometrioid carcinoma | Female | <65 | I/II | Unknown | Unknown | SD |
| FOSL1 | SNV | Missense_Mutation | c.745C>T | p.Arg249Cys | p.R249C | P15407 | protein_coding | deleterious(0) | probably_damaging(0.994) | TCGA-BS-A0U8-01 | Endometrium | uterine corpus endometrioid carcinoma | Female | <65 | III/IV | Chemotherapy | doxorubicin | SD | |
| FOSL1 | SNV | Missense_Mutation | novel | c.122N>C | p.Ile41Thr | p.I41T | P15407 | protein_coding | deleterious(0.01) | benign(0.104) | TCGA-BS-A0UV-01 | Endometrium | uterine corpus endometrioid carcinoma | Female | <65 | III/IV | Unknown | Unknown | SD |
| Page: 1 2 |
Top |
Related drugs of malignant transformation related genes |
| Identification of chemicals and drugs interact with genes involved in malignant transfromation |
| (DGIdb 4.0) |
| Entrez ID | Symbol | Category | Interaction Types | Drug Claim Name | Drug Name | PMIDs |
| 8061 | FOSL1 | TRANSCRIPTION FACTOR | TPA | ALTEPLASE | 7761434 |
| Page: 1 |

Copyright 2023-Present -The University of Texas Health Science Center at Houston |