
|
|||||
|
 | |
| |
| |
| |
| |
| |
|
Gene: FOLR2 |
Gene summary for FOLR2 |
| Gene information | Species | Human | Gene symbol | FOLR2 | Gene ID | 2350 |
| Gene name | folate receptor beta | |
| Gene Alias | BETA-HFR | |
| Cytomap | 11q13.4 | |
| Gene Type | protein-coding | GO ID | GO:0000003 | UniProtAcc | P14207 |
Top |
Malignant transformation analysis |
| Identification of the aberrant gene expression in precancerous and cancerous lesions by comparing the gene expression of stem-like cells in diseased tissues with normal stem cells |
| Entrez ID | Symbol | Replicates | Species | Organ | Tissue | Adj P-value | Log2FC | Malignancy |
| 2350 | FOLR2 | HCC1_Meng | Human | Liver | HCC | 2.19e-04 | -4.77e-03 | 0.0246 |
| 2350 | FOLR2 | Pt13.a | Human | Liver | HCC | 9.36e-07 | 3.84e-01 | 0.021 |
| 2350 | FOLR2 | Pt13.c | Human | Liver | HCC | 1.70e-11 | 6.68e-01 | 0.0076 |
| 2350 | FOLR2 | Pt14.d | Human | Liver | HCC | 8.46e-15 | 5.78e-01 | 0.0143 |
| Page: 1 |
| Tissue | Expression Dynamics | Abbreviation |
| Liver | 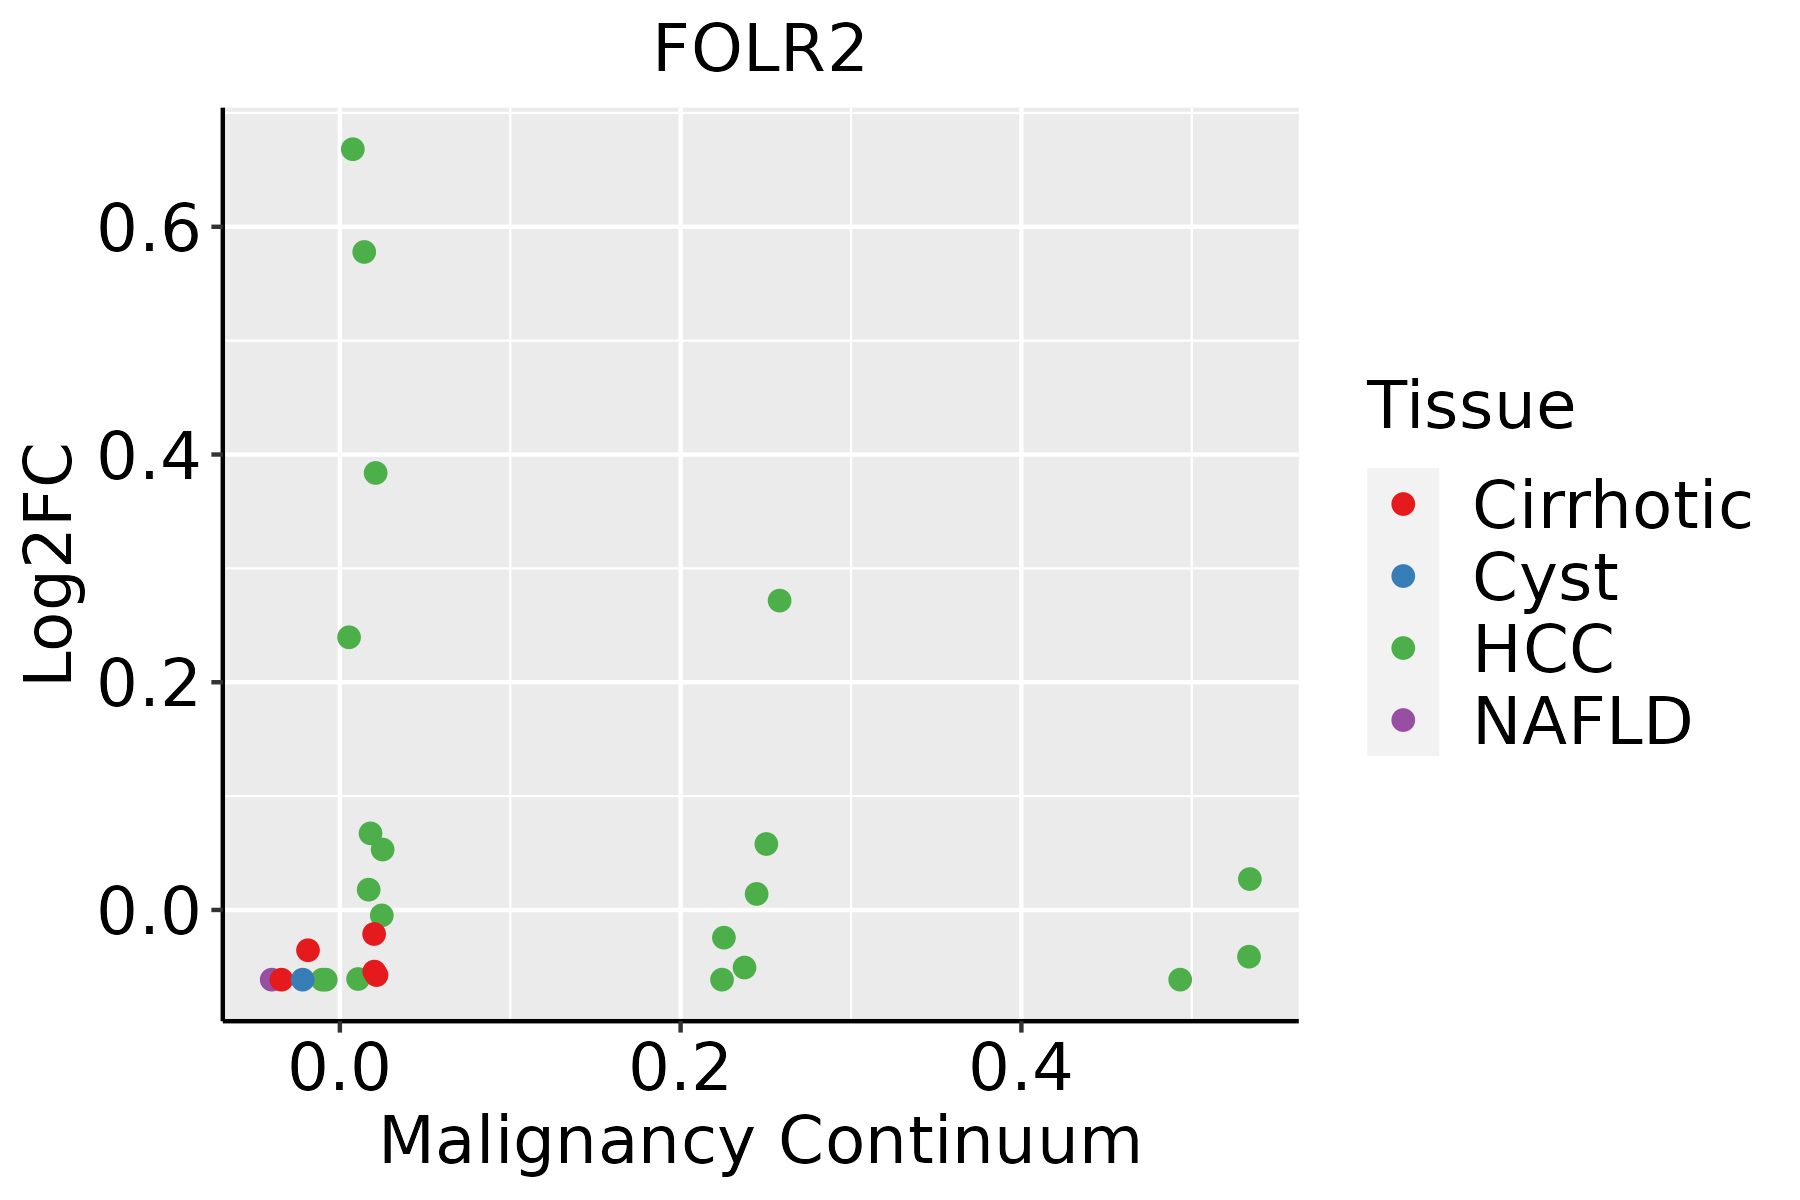 | HCC: Hepatocellular carcinoma |
| NAFLD: Non-alcoholic fatty liver disease |
| ∗log2FC in expression of this searched gene in stem-like cells from each diseased tissue sample relative to stem-like cells in normal samples in each tissue plotted against the malignancy continuum. Samples are colored based on if they are from different disease stage. |
Top |
Malignant transformation related pathway analysis |
| Find out the enriched GO biological processes and KEGG pathways involved in transition from healthy to precancer to cancer |
| Tissue | Disease Stage | Enriched GO biological Processes |
| Colorectum | AD |  |
| Colorectum | SER |  |
| Colorectum | MSS |  |
| Colorectum | MSI-H |  |
| Colorectum | FAP |  |
| ∗Top 15 enriched GO BP terms are showed in the bar plot of each disease state in each tissue. Each row represents a significant GO biological process which is colored according to the -log10(p.adjust). |
| Page: 1 2 3 4 5 6 7 8 9 |
| GO ID | Tissue | Disease Stage | Description | Gene Ratio | Bg Ratio | pvalue | p.adjust | Count |
| GO:003166722 | Liver | HCC | response to nutrient levels | 276/7958 | 474/18723 | 2.30e-12 | 1.08e-10 | 276 |
| GO:007149622 | Liver | HCC | cellular response to external stimulus | 191/7958 | 320/18723 | 3.40e-10 | 1.13e-08 | 191 |
| GO:003166812 | Liver | HCC | cellular response to extracellular stimulus | 149/7958 | 246/18723 | 7.35e-09 | 1.86e-07 | 149 |
| GO:000758421 | Liver | HCC | response to nutrient | 111/7958 | 174/18723 | 1.10e-08 | 2.73e-07 | 111 |
| GO:003166912 | Liver | HCC | cellular response to nutrient levels | 130/7958 | 215/18723 | 7.52e-08 | 1.51e-06 | 130 |
| GO:0061025 | Liver | HCC | membrane fusion | 88/7958 | 163/18723 | 1.98e-03 | 1.00e-02 | 88 |
| GO:0033273 | Liver | HCC | response to vitamin | 52/7958 | 93/18723 | 6.18e-03 | 2.53e-02 | 52 |
| GO:0031670 | Liver | HCC | cellular response to nutrient | 27/7958 | 45/18723 | 1.35e-02 | 4.80e-02 | 27 |
| Page: 1 |
| Pathway ID | Tissue | Disease Stage | Description | Gene Ratio | Bg Ratio | pvalue | p.adjust | qvalue | Count |
| hsa0414422 | Liver | HCC | Endocytosis | 178/4020 | 251/8465 | 2.03e-14 | 5.22e-13 | 2.91e-13 | 178 |
| hsa01523 | Liver | HCC | Antifolate resistance | 21/4020 | 30/8465 | 1.06e-02 | 2.71e-02 | 1.51e-02 | 21 |
| hsa0414432 | Liver | HCC | Endocytosis | 178/4020 | 251/8465 | 2.03e-14 | 5.22e-13 | 2.91e-13 | 178 |
| hsa015231 | Liver | HCC | Antifolate resistance | 21/4020 | 30/8465 | 1.06e-02 | 2.71e-02 | 1.51e-02 | 21 |
| Page: 1 |
Top |
Cell-cell communication analysis |
| Identification of potential cell-cell interactions between two cell types and their ligand-receptor pairs for different disease states |
| Ligand | Receptor | LRpair | Pathway | Tissue | Disease Stage |
| Page: 1 |
Top |
Single-cell gene regulatory network inference analysis |
| Find out the significant the regulons (TFs) and the target genes of each regulon across cell types for different disease states |
| TF | Cell Type | Tissue | Disease Stage | Target Gene | RSS | Regulon Activity |
| ∗The dot plots of a searched regulon are shown for all cell subpopulations in each disease state of each tissue based on the regulon specific score inferred using pySCENIC and by calculating the average expression. |
| Page: 1 |
Top |
Somatic mutation of malignant transformation related genes |
| Annotation of somatic variants for genes involved in malignant transformation |
| Hugo Symbol | Variant Class | Variant Classification | dbSNP RS | HGVSc | HGVSp | HGVSp Short | SWISSPROT | BIOTYPE | SIFT | PolyPhen | Tumor Sample Barcode | Tissue | Histology | Sex | Age | Stage | Therapy Types | Drugs | Outcome |
| FOLR2 | insertion | Frame_Shift_Ins | novel | c.373_374insGCAGTTACTTTACCTCTCTGTGTCTCTGTTTCCTCATCTCT | p.Asp125GlyfsTer119 | p.D125Gfs*119 | P14207 | protein_coding | TCGA-BH-A0BD-01 | Breast | breast invasive carcinoma | Female | <65 | I/II | Chemotherapy | doxorubicin | SD | ||
| FOLR2 | SNV | Missense_Mutation | c.596N>A | p.Gly199Glu | p.G199E | P14207 | protein_coding | deleterious(0) | probably_damaging(0.99) | TCGA-2W-A8YY-01 | Cervix | cervical & endocervical cancer | Female | <65 | I/II | Chemotherapy | cisplatin | CR | |
| FOLR2 | SNV | Missense_Mutation | novel | c.554N>C | p.Gly185Ala | p.G185A | P14207 | protein_coding | tolerated(0.09) | benign(0.403) | TCGA-AY-4070-01 | Colorectum | colon adenocarcinoma | Female | <65 | III/IV | Chemotherapy | 5-fu | PD |
| FOLR2 | SNV | Missense_Mutation | c.77A>C | p.Asp26Ala | p.D26A | P14207 | protein_coding | deleterious(0.04) | benign(0.146) | TCGA-CA-6718-01 | Colorectum | colon adenocarcinoma | Male | <65 | I/II | Unknown | Unknown | PD | |
| FOLR2 | SNV | Missense_Mutation | c.577G>A | p.Val193Ile | p.V193I | P14207 | protein_coding | tolerated(0.1) | benign(0.403) | TCGA-G4-6628-01 | Colorectum | colon adenocarcinoma | Male | >=65 | I/II | Unknown | Unknown | SD | |
| FOLR2 | SNV | Missense_Mutation | novel | c.210N>T | p.Lys70Asn | p.K70N | P14207 | protein_coding | tolerated(0.24) | benign(0.117) | TCGA-AG-3909-01 | Colorectum | rectum adenocarcinoma | Female | >=65 | III/IV | Chemotherapy | folinic | CR |
| FOLR2 | SNV | Missense_Mutation | novel | c.194N>A | p.Ser65Asn | p.S65N | P14207 | protein_coding | deleterious(0) | probably_damaging(1) | TCGA-AP-A1DK-01 | Endometrium | uterine corpus endometrioid carcinoma | Female | <65 | I/II | Unknown | Unknown | SD |
| FOLR2 | SNV | Missense_Mutation | c.602N>A | p.Gly201Asp | p.G201D | P14207 | protein_coding | deleterious(0.02) | probably_damaging(1) | TCGA-AX-A1C5-01 | Endometrium | uterine corpus endometrioid carcinoma | Female | <65 | III/IV | Unspecific | Carboplatin | SD | |
| FOLR2 | SNV | Missense_Mutation | novel | c.19N>T | p.Pro7Ser | p.P7S | P14207 | protein_coding | tolerated(0.8) | benign(0.038) | TCGA-AX-A1CE-01 | Endometrium | uterine corpus endometrioid carcinoma | Female | <65 | I/II | Unspecific | Paclitaxel | SD |
| FOLR2 | SNV | Missense_Mutation | rs752060276 | c.403N>T | p.Arg135Cys | p.R135C | P14207 | protein_coding | deleterious(0.02) | benign(0.022) | TCGA-BK-A6W3-01 | Endometrium | uterine corpus endometrioid carcinoma | Female | <65 | I/II | Unknown | Unknown | SD |
| Page: 1 2 3 |
Top |
Related drugs of malignant transformation related genes |
| Identification of chemicals and drugs interact with genes involved in malignant transfromation |
| (DGIdb 4.0) |
| Entrez ID | Symbol | Category | Interaction Types | Drug Claim Name | Drug Name | PMIDs |
| 2350 | FOLR2 | CELL SURFACE, DRUGGABLE GENOME | FOLIC ACID | FOLIC ACID | 25234128 | |
| 2350 | FOLR2 | CELL SURFACE, DRUGGABLE GENOME | LOMETREXOL | LOMETREXOL | 20085328 |
| Page: 1 |

Copyright 2023-Present -The University of Texas Health Science Center at Houston |