
|
|||||
|
 | |
| |
| |
| |
| |
| |
|
Gene: FOLR1 |
Gene summary for FOLR1 |
| Gene information | Species | Human | Gene symbol | FOLR1 | Gene ID | 2348 |
| Gene name | folate receptor alpha | |
| Gene Alias | FBP | |
| Cytomap | 11q13.4 | |
| Gene Type | protein-coding | GO ID | GO:0000003 | UniProtAcc | A0A024R5H1 |
Top |
Malignant transformation analysis |
| Identification of the aberrant gene expression in precancerous and cancerous lesions by comparing the gene expression of stem-like cells in diseased tissues with normal stem cells |
| Entrez ID | Symbol | Replicates | Species | Organ | Tissue | Adj P-value | Log2FC | Malignancy |
| 2348 | FOLR1 | CA_HPV_1 | Human | Cervix | CC | 8.81e-06 | -1.93e-01 | 0.0264 |
| 2348 | FOLR1 | CA_HPV_2 | Human | Cervix | CC | 9.91e-06 | -1.88e-01 | 0.0391 |
| 2348 | FOLR1 | CA_HPV_3 | Human | Cervix | CC | 3.43e-03 | -1.83e-01 | 0.0414 |
| 2348 | FOLR1 | N_HPV_1 | Human | Cervix | N_HPV | 2.92e-04 | -1.80e-01 | 0.0079 |
| 2348 | FOLR1 | CCII_1 | Human | Cervix | CC | 2.78e-02 | -1.93e-01 | 0.3249 |
| 2348 | FOLR1 | Tumor | Human | Cervix | CC | 1.12e-04 | -1.82e-01 | 0.1241 |
| 2348 | FOLR1 | sample3 | Human | Cervix | CC | 2.55e-03 | -1.92e-01 | 0.1387 |
| 2348 | FOLR1 | H2 | Human | Cervix | HSIL_HPV | 2.24e-03 | 3.02e-01 | 0.0632 |
| 2348 | FOLR1 | L1 | Human | Cervix | CC | 9.03e-03 | -1.93e-01 | 0.0802 |
| 2348 | FOLR1 | T1 | Human | Cervix | CC | 3.54e-02 | -1.74e-01 | 0.0918 |
| 2348 | FOLR1 | T2 | Human | Cervix | CC | 3.97e-14 | 9.06e-01 | 0.0709 |
| 2348 | FOLR1 | T3 | Human | Cervix | CC | 4.13e-06 | -1.93e-01 | 0.1389 |
| 2348 | FOLR1 | EEC-subject1 | Human | Endometrium | EEC | 1.55e-02 | -1.05e-01 | -0.2682 |
| 2348 | FOLR1 | EEC-subject3 | Human | Endometrium | EEC | 3.99e-06 | -1.58e-01 | -0.2525 |
| 2348 | FOLR1 | GSM6177620_NYU_UCEC1_lib1_lib1 | Human | Endometrium | EEC | 1.11e-04 | 4.16e-01 | -0.1869 |
| 2348 | FOLR1 | GSM6177620_NYU_UCEC1_lib3_lib3 | Human | Endometrium | EEC | 2.45e-04 | 3.46e-01 | -0.1883 |
| 2348 | FOLR1 | GSM6177621_NYU_UCEC2_lib1_lib1 | Human | Endometrium | EEC | 3.86e-04 | -1.63e-01 | -0.1934 |
| 2348 | FOLR1 | GSM6177622_NYU_UCEC3_lib1_lib1 | Human | Endometrium | EEC | 1.10e-09 | 4.33e-01 | -0.1917 |
| 2348 | FOLR1 | GSM6177622_NYU_UCEC3_lib2_lib2 | Human | Endometrium | EEC | 8.20e-14 | 5.53e-01 | -0.1916 |
| 2348 | FOLR1 | GSM6177623_NYU_UCEC3_Vis | Human | Endometrium | EEC | 1.04e-11 | 5.40e-01 | -0.1269 |
| Page: 1 2 3 4 5 6 |
| Tissue | Expression Dynamics | Abbreviation |
| Cervix |  | CC: Cervix cancer |
| HSIL_HPV: HPV-infected high-grade squamous intraepithelial lesions | ||
| N_HPV: HPV-infected normal cervix | ||
| Endometrium | 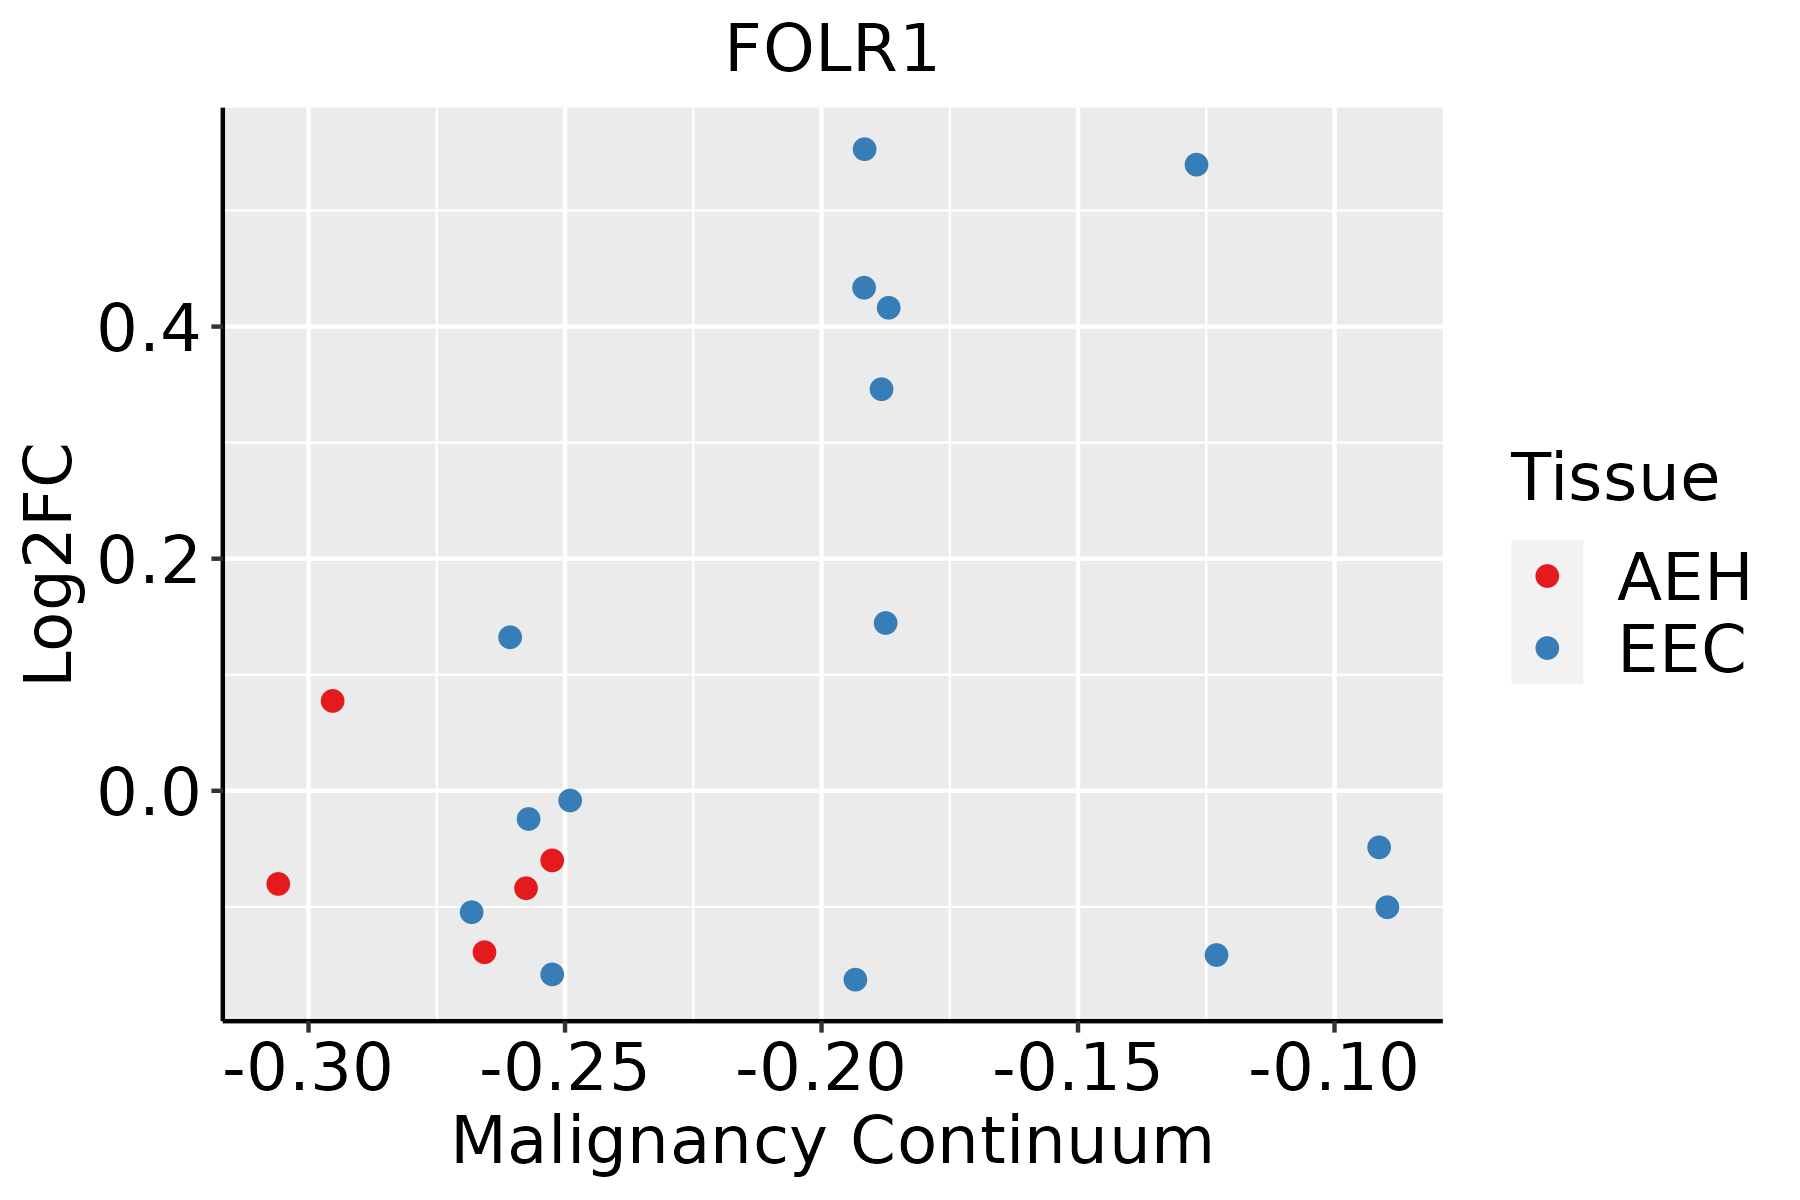 | AEH: Atypical endometrial hyperplasia |
| EEC: Endometrioid Cancer | ||
| Esophagus |  | ESCC: Esophageal squamous cell carcinoma |
| HGIN: High-grade intraepithelial neoplasias | ||
| LGIN: Low-grade intraepithelial neoplasias | ||
| Liver |  | HCC: Hepatocellular carcinoma |
| NAFLD: Non-alcoholic fatty liver disease | ||
| Lung |  | AAH: Atypical adenomatous hyperplasia |
| AIS: Adenocarcinoma in situ | ||
| IAC: Invasive lung adenocarcinoma | ||
| MIA: Minimally invasive adenocarcinoma | ||
| Thyroid | 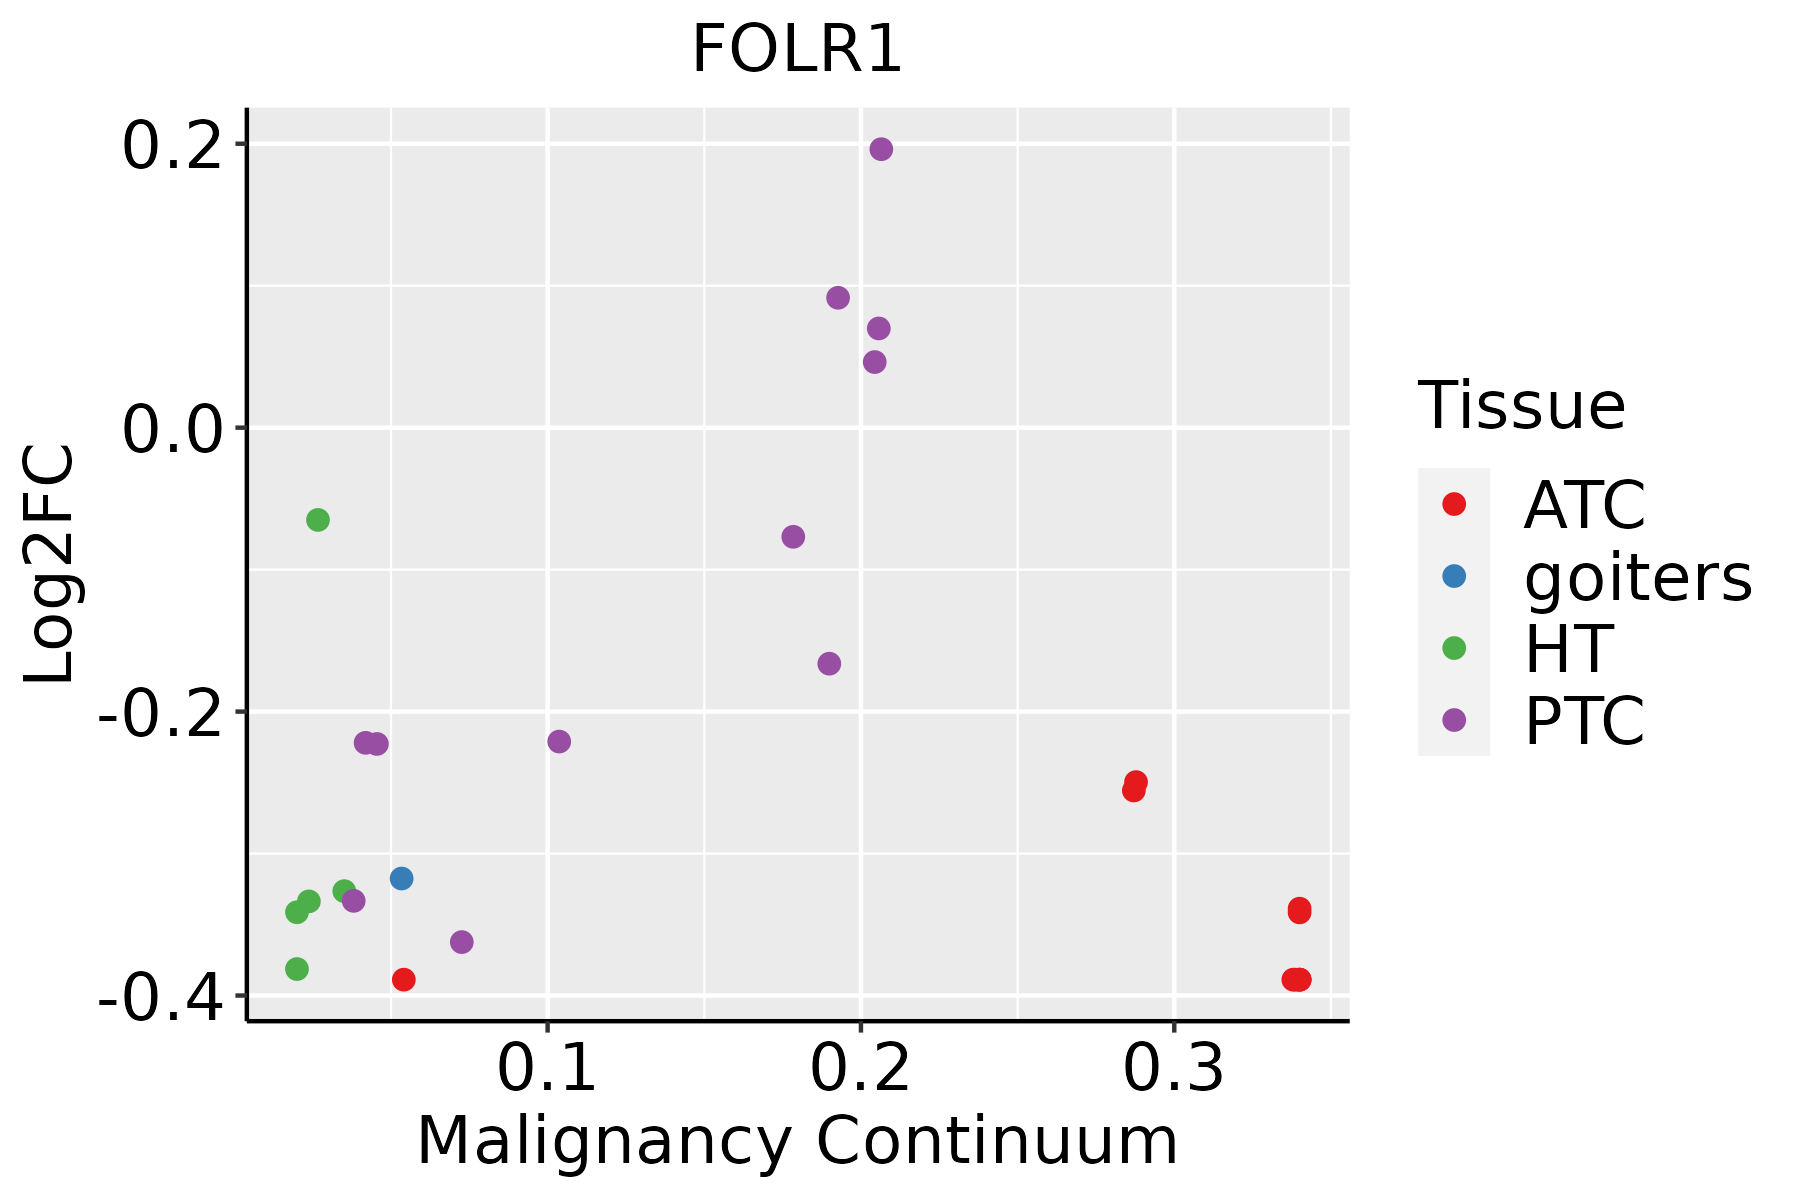 | ATC: Anaplastic thyroid cancer |
| HT: Hashimoto's thyroiditis | ||
| PTC: Papillary thyroid cancer |
| ∗log2FC in expression of this searched gene in stem-like cells from each diseased tissue sample relative to stem-like cells in normal samples in each tissue plotted against the malignancy continuum. Samples are colored based on if they are from different disease stage. |
Top |
Malignant transformation related pathway analysis |
| Find out the enriched GO biological processes and KEGG pathways involved in transition from healthy to precancer to cancer |
| Tissue | Disease Stage | Enriched GO biological Processes |
| Colorectum | AD |  |
| Colorectum | SER |  |
| Colorectum | MSS |  |
| Colorectum | MSI-H |  |
| Colorectum | FAP |  |
| ∗Top 15 enriched GO BP terms are showed in the bar plot of each disease state in each tissue. Each row represents a significant GO biological process which is colored according to the -log10(p.adjust). |
| Page: 1 2 3 4 5 6 7 8 9 |
| GO ID | Tissue | Disease Stage | Description | Gene Ratio | Bg Ratio | pvalue | p.adjust | Count |
| GO:00016679 | Cervix | CC | ameboidal-type cell migration | 110/2311 | 475/18723 | 2.66e-11 | 6.36e-09 | 110 |
| GO:007149610 | Cervix | CC | cellular response to external stimulus | 78/2311 | 320/18723 | 1.82e-09 | 1.98e-07 | 78 |
| GO:00160557 | Cervix | CC | Wnt signaling pathway | 98/2311 | 444/18723 | 4.82e-09 | 4.65e-07 | 98 |
| GO:01987387 | Cervix | CC | cell-cell signaling by wnt | 98/2311 | 446/18723 | 6.16e-09 | 5.58e-07 | 98 |
| GO:00301117 | Cervix | CC | regulation of Wnt signaling pathway | 76/2311 | 328/18723 | 3.05e-08 | 2.08e-06 | 76 |
| GO:00316689 | Cervix | CC | cellular response to extracellular stimulus | 59/2311 | 246/18723 | 3.03e-07 | 1.24e-05 | 59 |
| GO:00608287 | Cervix | CC | regulation of canonical Wnt signaling pathway | 58/2311 | 253/18723 | 1.83e-06 | 5.89e-05 | 58 |
| GO:00600707 | Cervix | CC | canonical Wnt signaling pathway | 66/2311 | 303/18723 | 2.47e-06 | 7.35e-05 | 66 |
| GO:003166710 | Cervix | CC | response to nutrient levels | 92/2311 | 474/18723 | 5.80e-06 | 1.42e-04 | 92 |
| GO:00316698 | Cervix | CC | cellular response to nutrient levels | 49/2311 | 215/18723 | 1.32e-05 | 2.68e-04 | 49 |
| GO:00310996 | Cervix | CC | regeneration | 46/2311 | 198/18723 | 1.43e-05 | 2.84e-04 | 46 |
| GO:00615647 | Cervix | CC | axon development | 89/2311 | 467/18723 | 1.71e-05 | 3.27e-04 | 89 |
| GO:00068987 | Cervix | CC | receptor-mediated endocytosis | 53/2311 | 244/18723 | 2.52e-05 | 4.29e-04 | 53 |
| GO:00488634 | Cervix | CC | stem cell differentiation | 46/2311 | 206/18723 | 4.11e-05 | 6.36e-04 | 46 |
| GO:00071786 | Cervix | CC | transmembrane receptor protein serine/threonine kinase signaling pathway | 67/2311 | 355/18723 | 2.39e-04 | 2.67e-03 | 67 |
| GO:00715595 | Cervix | CC | response to transforming growth factor beta | 50/2311 | 256/18723 | 6.31e-04 | 5.91e-03 | 50 |
| GO:00715605 | Cervix | CC | cellular response to transforming growth factor beta stimulus | 49/2311 | 250/18723 | 6.55e-04 | 6.05e-03 | 49 |
| GO:00351487 | Cervix | CC | tube formation | 31/2311 | 148/18723 | 2.07e-03 | 1.51e-02 | 31 |
| GO:00018417 | Cervix | CC | neural tube formation | 23/2311 | 102/18723 | 2.80e-03 | 1.87e-02 | 23 |
| GO:00071795 | Cervix | CC | transforming growth factor beta receptor signaling pathway | 38/2311 | 198/18723 | 3.62e-03 | 2.31e-02 | 38 |
| Page: 1 2 3 4 5 6 7 8 9 10 11 12 13 14 15 16 17 18 19 |
| Pathway ID | Tissue | Disease Stage | Description | Gene Ratio | Bg Ratio | pvalue | p.adjust | qvalue | Count |
| hsa0414418 | Cervix | CC | Endocytosis | 64/1267 | 251/8465 | 6.97e-06 | 6.10e-05 | 3.61e-05 | 64 |
| hsa0414419 | Cervix | CC | Endocytosis | 64/1267 | 251/8465 | 6.97e-06 | 6.10e-05 | 3.61e-05 | 64 |
| hsa0414424 | Endometrium | EEC | Endocytosis | 57/1237 | 251/8465 | 3.34e-04 | 2.82e-03 | 2.10e-03 | 57 |
| hsa0414434 | Endometrium | EEC | Endocytosis | 57/1237 | 251/8465 | 3.34e-04 | 2.82e-03 | 2.10e-03 | 57 |
| hsa0414429 | Esophagus | HGIN | Endocytosis | 76/1383 | 251/8465 | 1.74e-08 | 3.34e-07 | 2.65e-07 | 76 |
| hsa04144113 | Esophagus | HGIN | Endocytosis | 76/1383 | 251/8465 | 1.74e-08 | 3.34e-07 | 2.65e-07 | 76 |
| hsa04144210 | Esophagus | ESCC | Endocytosis | 186/4205 | 251/8465 | 9.74e-16 | 4.66e-14 | 2.39e-14 | 186 |
| hsa015232 | Esophagus | ESCC | Antifolate resistance | 22/4205 | 30/8465 | 7.23e-03 | 1.76e-02 | 8.99e-03 | 22 |
| hsa0414437 | Esophagus | ESCC | Endocytosis | 186/4205 | 251/8465 | 9.74e-16 | 4.66e-14 | 2.39e-14 | 186 |
| hsa0152311 | Esophagus | ESCC | Antifolate resistance | 22/4205 | 30/8465 | 7.23e-03 | 1.76e-02 | 8.99e-03 | 22 |
| hsa0414422 | Liver | HCC | Endocytosis | 178/4020 | 251/8465 | 2.03e-14 | 5.22e-13 | 2.91e-13 | 178 |
| hsa01523 | Liver | HCC | Antifolate resistance | 21/4020 | 30/8465 | 1.06e-02 | 2.71e-02 | 1.51e-02 | 21 |
| hsa0414432 | Liver | HCC | Endocytosis | 178/4020 | 251/8465 | 2.03e-14 | 5.22e-13 | 2.91e-13 | 178 |
| hsa015231 | Liver | HCC | Antifolate resistance | 21/4020 | 30/8465 | 1.06e-02 | 2.71e-02 | 1.51e-02 | 21 |
| hsa0414414 | Lung | IAC | Endocytosis | 51/1053 | 251/8465 | 2.25e-04 | 2.54e-03 | 1.68e-03 | 51 |
| hsa0414415 | Lung | IAC | Endocytosis | 51/1053 | 251/8465 | 2.25e-04 | 2.54e-03 | 1.68e-03 | 51 |
| hsa0414423 | Lung | AIS | Endocytosis | 52/961 | 251/8465 | 9.74e-06 | 3.04e-04 | 1.95e-04 | 52 |
| hsa0414433 | Lung | AIS | Endocytosis | 52/961 | 251/8465 | 9.74e-06 | 3.04e-04 | 1.95e-04 | 52 |
| Page: 1 |
Top |
Cell-cell communication analysis |
| Identification of potential cell-cell interactions between two cell types and their ligand-receptor pairs for different disease states |
| Ligand | Receptor | LRpair | Pathway | Tissue | Disease Stage |
| Page: 1 |
Top |
Single-cell gene regulatory network inference analysis |
| Find out the significant the regulons (TFs) and the target genes of each regulon across cell types for different disease states |
| TF | Cell Type | Tissue | Disease Stage | Target Gene | RSS | Regulon Activity |
| ∗The dot plots of a searched regulon are shown for all cell subpopulations in each disease state of each tissue based on the regulon specific score inferred using pySCENIC and by calculating the average expression. |
| Page: 1 |
Top |
Somatic mutation of malignant transformation related genes |
| Annotation of somatic variants for genes involved in malignant transformation |
| Hugo Symbol | Variant Class | Variant Classification | dbSNP RS | HGVSc | HGVSp | HGVSp Short | SWISSPROT | BIOTYPE | SIFT | PolyPhen | Tumor Sample Barcode | Tissue | Histology | Sex | Age | Stage | Therapy Types | Drugs | Outcome |
| FOLR1 | SNV | Missense_Mutation | novel | c.699G>C | p.Met233Ile | p.M233I | P15328 | protein_coding | tolerated(0.15) | benign(0.015) | TCGA-A7-A26H-01 | Breast | breast invasive carcinoma | Female | >=65 | I/II | Hormone Therapy | anastrozole | PD |
| FOLR1 | SNV | Missense_Mutation | c.668A>T | p.Glu223Val | p.E223V | P15328 | protein_coding | tolerated(0.51) | benign(0.145) | TCGA-D8-A1JP-01 | Breast | breast invasive carcinoma | Female | >=65 | I/II | Hormone Therapy | tamoxiphen | SD | |
| FOLR1 | insertion | In_Frame_Ins | novel | c.294_295insGCACAATCTCAGCTCACTGCAACCTCCACCTCCCAGGTT | p.Arg98_His99insAlaGlnSerGlnLeuThrAlaThrSerThrSerGlnVal | p.R98_H99insAQSQLTATSTSQV | P15328 | protein_coding | TCGA-BH-A0E2-01 | Breast | breast invasive carcinoma | Female | <65 | III/IV | Chemotherapy | doxorubicin | SD | ||
| FOLR1 | insertion | In_Frame_Ins | novel | c.262_263insTCATGCCACTCAGATGTTCCA | p.His88delinsLeuMetProLeuArgCysSerAsn | p.H88delinsLMPLRCSN | P15328 | protein_coding | TCGA-C8-A3M8-01 | Breast | breast invasive carcinoma | Female | >=65 | I/II | Hormone Therapy | tamoxiphen | CR | ||
| FOLR1 | SNV | Missense_Mutation | rs747612073 | c.633N>C | p.Gln211His | p.Q211H | P15328 | protein_coding | deleterious(0.02) | probably_damaging(1) | TCGA-EK-A2PG-01 | Cervix | cervical & endocervical cancer | Female | >=65 | I/II | Unknown | Unknown | SD |
| FOLR1 | SNV | Missense_Mutation | c.248G>T | p.Arg83Ile | p.R83I | P15328 | protein_coding | deleterious(0) | benign(0.435) | TCGA-A6-6141-01 | Colorectum | colon adenocarcinoma | Male | <65 | I/II | Chemotherapy | 5-fu | SD | |
| FOLR1 | SNV | Missense_Mutation | rs752503322 | c.373C>T | p.Arg125Cys | p.R125C | P15328 | protein_coding | deleterious(0.01) | probably_damaging(0.953) | TCGA-AA-3833-01 | Colorectum | colon adenocarcinoma | Female | <65 | I/II | Unknown | Unknown | SD |
| FOLR1 | SNV | Missense_Mutation | c.548C>A | p.Pro183His | p.P183H | P15328 | protein_coding | deleterious(0.03) | probably_damaging(0.996) | TCGA-AA-3864-01 | Colorectum | colon adenocarcinoma | Male | >=65 | I/II | Unknown | Unknown | SD | |
| FOLR1 | SNV | Missense_Mutation | novel | c.43N>C | p.Trp15Arg | p.W15R | P15328 | protein_coding | deleterious(0.01) | benign(0.11) | TCGA-AA-3984-01 | Colorectum | colon adenocarcinoma | Female | <65 | I/II | Unknown | Unknown | SD |
| FOLR1 | SNV | Missense_Mutation | c.706G>A | p.Ala236Thr | p.A236T | P15328 | protein_coding | tolerated(0.12) | benign(0.005) | TCGA-G4-6586-01 | Colorectum | colon adenocarcinoma | Female | >=65 | I/II | Unknown | Unknown | SD |
| Page: 1 2 3 |
Top |
Related drugs of malignant transformation related genes |
| Identification of chemicals and drugs interact with genes involved in malignant transfromation |
| (DGIdb 4.0) |
| Entrez ID | Symbol | Category | Interaction Types | Drug Claim Name | Drug Name | PMIDs |
| 2348 | FOLR1 | CELL SURFACE, TRANSPORTER, DRUGGABLE GENOME | FARLETUZUMAB | FARLETUZUMAB | ||
| 2348 | FOLR1 | CELL SURFACE, TRANSPORTER, DRUGGABLE GENOME | ANTIESTROGENS | 12782587 | ||
| 2348 | FOLR1 | CELL SURFACE, TRANSPORTER, DRUGGABLE GENOME | EC0489 | |||
| 2348 | FOLR1 | CELL SURFACE, TRANSPORTER, DRUGGABLE GENOME | inhibitor | CHEMBL1743016 | FARLETUZUMAB | |
| 2348 | FOLR1 | CELL SURFACE, TRANSPORTER, DRUGGABLE GENOME | FolateImmune | |||
| 2348 | FOLR1 | CELL SURFACE, TRANSPORTER, DRUGGABLE GENOME | IMGN-853 | MIRVETUXIMAB SORAVTANSINE | ||
| 2348 | FOLR1 | CELL SURFACE, TRANSPORTER, DRUGGABLE GENOME | Mirvetuximab soravtansine | |||
| 2348 | FOLR1 | CELL SURFACE, TRANSPORTER, DRUGGABLE GENOME | Farletuzumab | FARLETUZUMAB | ||
| 2348 | FOLR1 | CELL SURFACE, TRANSPORTER, DRUGGABLE GENOME | Tetrahydrofolic acid | |||
| 2348 | FOLR1 | CELL SURFACE, TRANSPORTER, DRUGGABLE GENOME | EC-145 | VINTAFOLIDE | 23242435 |
| Page: 1 2 3 |

Copyright 2023-Present -The University of Texas Health Science Center at Houston |