
|
|||||
|
 | |
| |
| |
| |
| |
| |
|
Gene: FOCAD |
Gene summary for FOCAD |
| Gene information | Species | Human | Gene symbol | FOCAD | Gene ID | 54914 |
| Gene name | focadhesin | |
| Gene Alias | KIAA1797 | |
| Cytomap | 9p21.3 | |
| Gene Type | protein-coding | GO ID | GO:0005575 | UniProtAcc | B3KNV9 |
Top |
Malignant transformation analysis |
| Identification of the aberrant gene expression in precancerous and cancerous lesions by comparing the gene expression of stem-like cells in diseased tissues with normal stem cells |
| Entrez ID | Symbol | Replicates | Species | Organ | Tissue | Adj P-value | Log2FC | Malignancy |
| 54914 | FOCAD | CCI_1 | Human | Cervix | CC | 3.38e-02 | 5.13e-01 | 0.528 |
| 54914 | FOCAD | CCI_2 | Human | Cervix | CC | 1.22e-12 | 1.11e+00 | 0.5249 |
| 54914 | FOCAD | CCI_3 | Human | Cervix | CC | 9.79e-17 | 7.83e-01 | 0.516 |
| 54914 | FOCAD | HTA11_3410_2000001011 | Human | Colorectum | AD | 1.49e-09 | -4.37e-01 | 0.0155 |
| 54914 | FOCAD | HTA11_696_2000001011 | Human | Colorectum | AD | 3.62e-06 | -3.12e-01 | -0.1464 |
| 54914 | FOCAD | HTA11_5212_2000001011 | Human | Colorectum | AD | 1.87e-02 | -6.62e-01 | -0.2061 |
| 54914 | FOCAD | HTA11_866_3004761011 | Human | Colorectum | AD | 4.75e-03 | -3.61e-01 | 0.096 |
| 54914 | FOCAD | HTA11_99999971662_82457 | Human | Colorectum | MSS | 4.99e-03 | -2.93e-01 | 0.3859 |
| 54914 | FOCAD | HTA11_99999974143_84620 | Human | Colorectum | MSS | 7.29e-23 | -5.99e-01 | 0.3005 |
| 54914 | FOCAD | A002-C-010 | Human | Colorectum | FAP | 3.74e-02 | 1.69e-01 | 0.242 |
| 54914 | FOCAD | A015-C-203 | Human | Colorectum | FAP | 1.87e-28 | -3.70e-01 | -0.1294 |
| 54914 | FOCAD | A015-C-204 | Human | Colorectum | FAP | 2.49e-03 | -2.22e-01 | -0.0228 |
| 54914 | FOCAD | A014-C-040 | Human | Colorectum | FAP | 1.69e-02 | -2.24e-01 | -0.1184 |
| 54914 | FOCAD | A002-C-201 | Human | Colorectum | FAP | 6.43e-09 | -2.88e-01 | 0.0324 |
| 54914 | FOCAD | A001-C-119 | Human | Colorectum | FAP | 6.22e-06 | -4.26e-01 | -0.1557 |
| 54914 | FOCAD | A001-C-108 | Human | Colorectum | FAP | 9.09e-18 | -2.16e-01 | -0.0272 |
| 54914 | FOCAD | A002-C-205 | Human | Colorectum | FAP | 3.33e-20 | -4.10e-01 | -0.1236 |
| 54914 | FOCAD | A015-C-005 | Human | Colorectum | FAP | 2.62e-02 | -2.89e-01 | -0.0336 |
| 54914 | FOCAD | A015-C-006 | Human | Colorectum | FAP | 1.81e-16 | -5.51e-01 | -0.0994 |
| 54914 | FOCAD | A015-C-106 | Human | Colorectum | FAP | 5.13e-11 | -2.42e-01 | -0.0511 |
| Page: 1 2 3 4 |
| Tissue | Expression Dynamics | Abbreviation |
| Cervix | 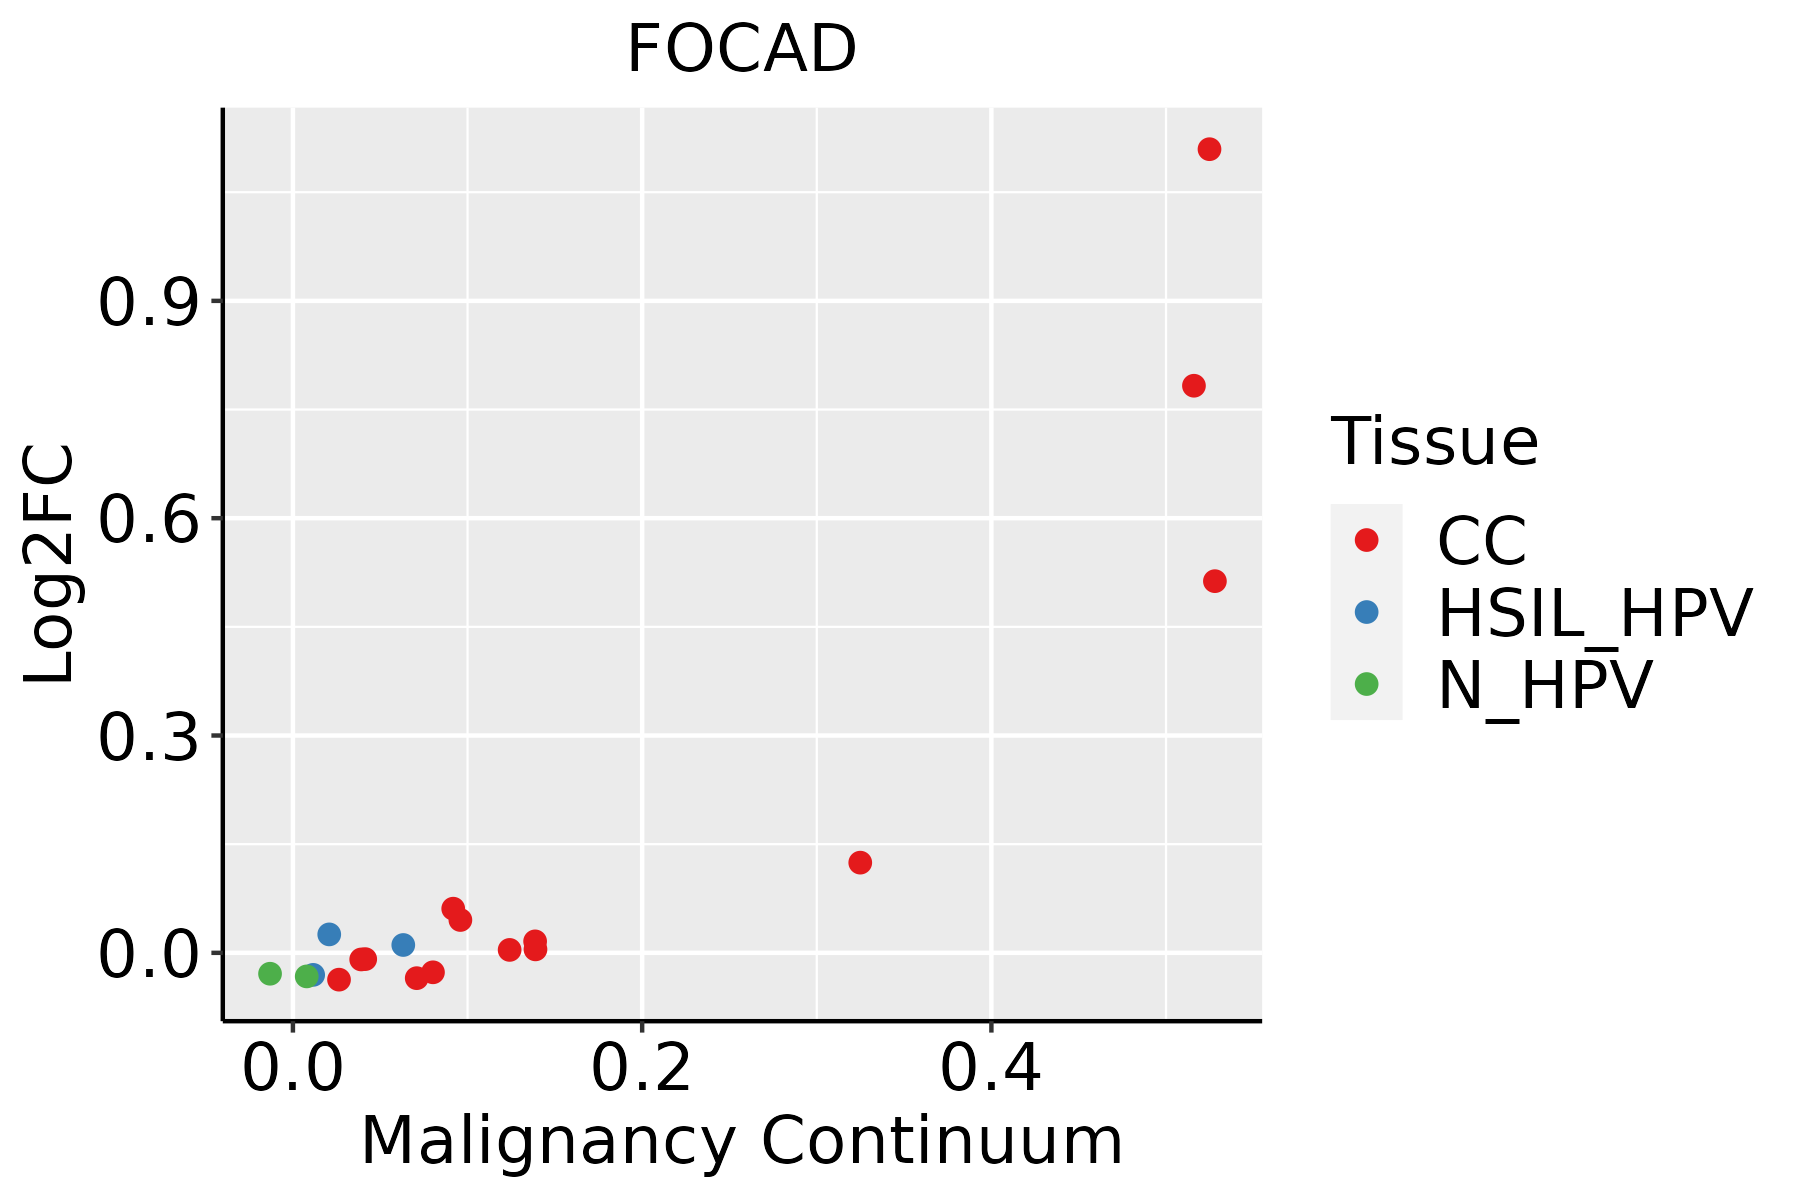 | CC: Cervix cancer |
| HSIL_HPV: HPV-infected high-grade squamous intraepithelial lesions | ||
| N_HPV: HPV-infected normal cervix | ||
| Colorectum (GSE201348) |  | FAP: Familial adenomatous polyposis |
| CRC: Colorectal cancer | ||
| Colorectum (HTA11) |  | AD: Adenomas |
| SER: Sessile serrated lesions | ||
| MSI-H: Microsatellite-high colorectal cancer | ||
| MSS: Microsatellite stable colorectal cancer | ||
| Endometrium |  | AEH: Atypical endometrial hyperplasia |
| EEC: Endometrioid Cancer | ||
| Lung | 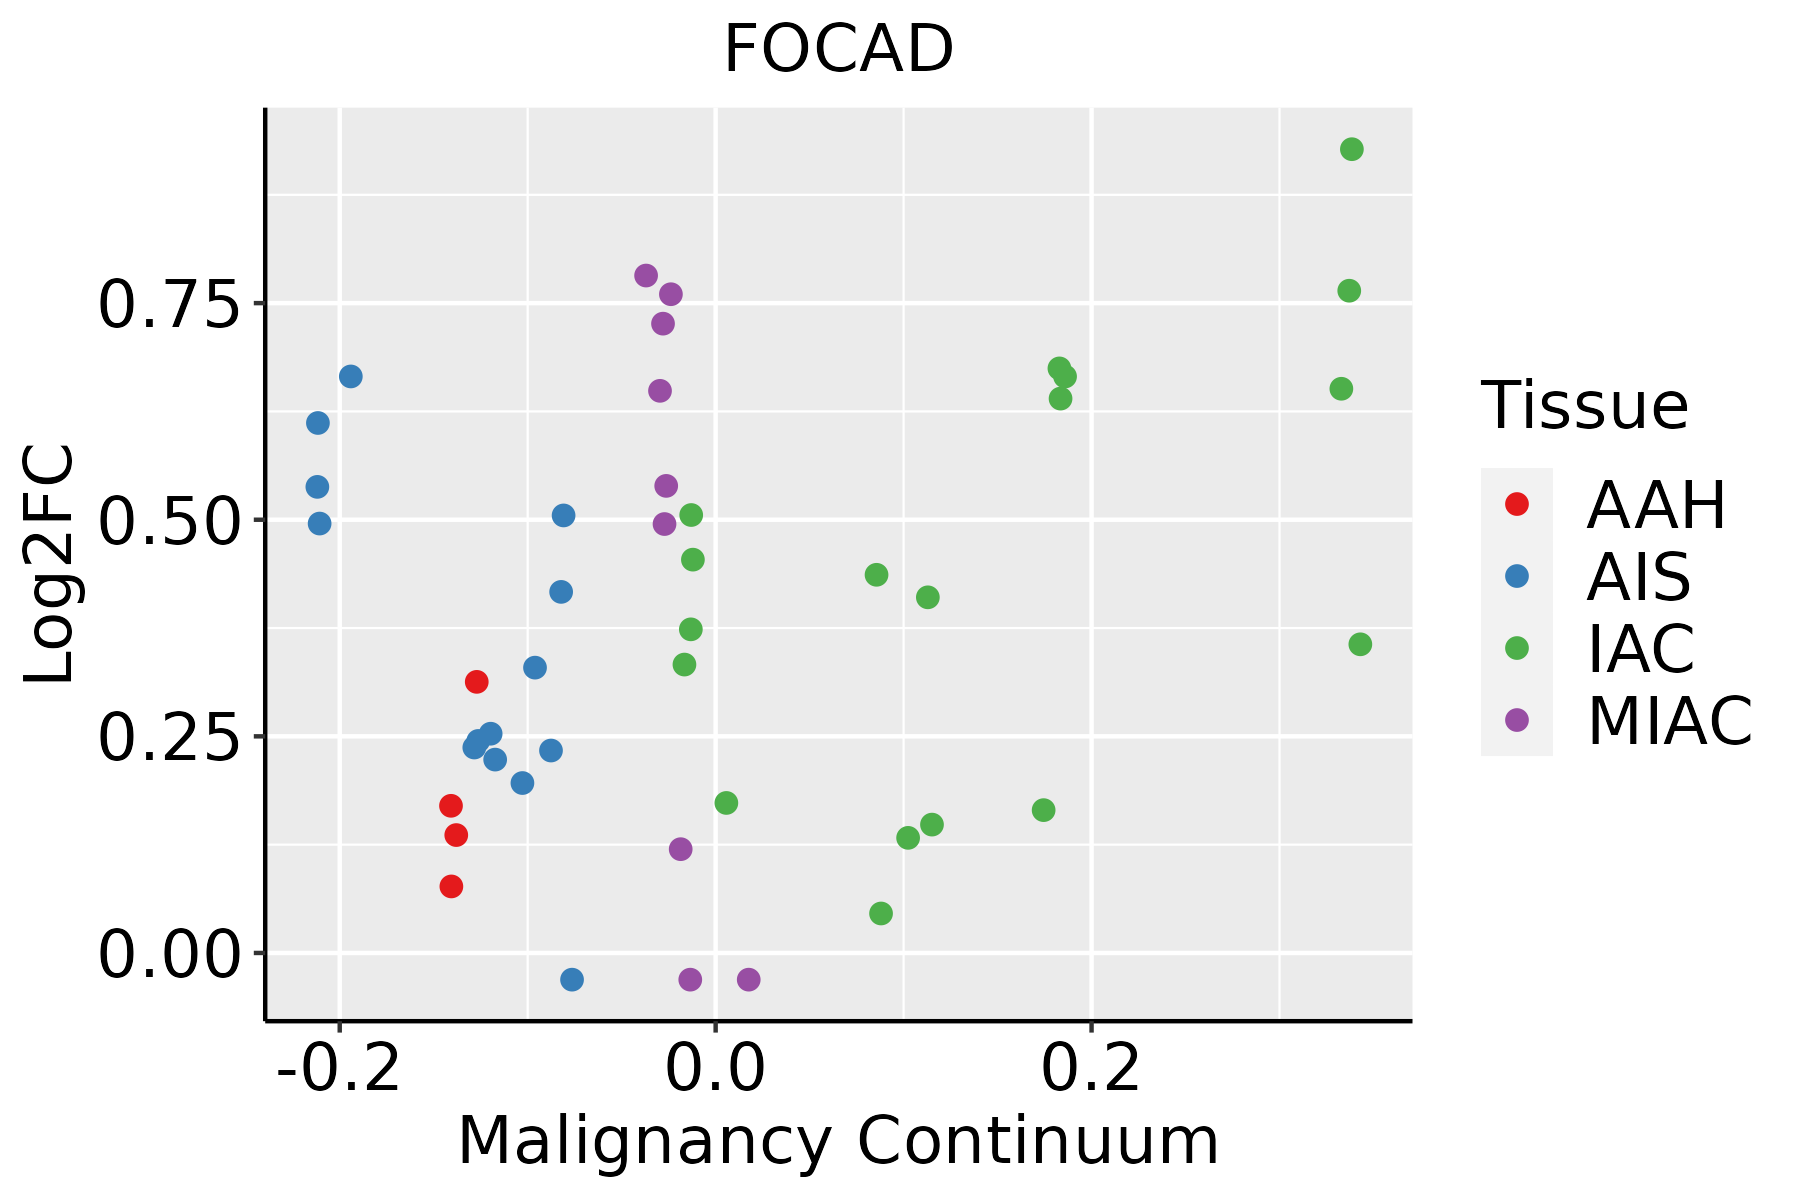 | AAH: Atypical adenomatous hyperplasia |
| AIS: Adenocarcinoma in situ | ||
| IAC: Invasive lung adenocarcinoma | ||
| MIA: Minimally invasive adenocarcinoma |
| ∗log2FC in expression of this searched gene in stem-like cells from each diseased tissue sample relative to stem-like cells in normal samples in each tissue plotted against the malignancy continuum. Samples are colored based on if they are from different disease stage. |
Top |
Malignant transformation related pathway analysis |
| Find out the enriched GO biological processes and KEGG pathways involved in transition from healthy to precancer to cancer |
| Tissue | Disease Stage | Enriched GO biological Processes |
| Colorectum | AD |  |
| Colorectum | SER |  |
| Colorectum | MSS |  |
| Colorectum | MSI-H |  |
| Colorectum | FAP |  |
| ∗Top 15 enriched GO BP terms are showed in the bar plot of each disease state in each tissue. Each row represents a significant GO biological process which is colored according to the -log10(p.adjust). |
| Page: 1 2 3 4 5 6 7 8 9 |
| GO ID | Tissue | Disease Stage | Description | Gene Ratio | Bg Ratio | pvalue | p.adjust | Count |
| Page: 1 |
| Pathway ID | Tissue | Disease Stage | Description | Gene Ratio | Bg Ratio | pvalue | p.adjust | qvalue | Count |
| Page: 1 |
Top |
Cell-cell communication analysis |
| Identification of potential cell-cell interactions between two cell types and their ligand-receptor pairs for different disease states |
| Ligand | Receptor | LRpair | Pathway | Tissue | Disease Stage |
| Page: 1 |
Top |
Single-cell gene regulatory network inference analysis |
| Find out the significant the regulons (TFs) and the target genes of each regulon across cell types for different disease states |
| TF | Cell Type | Tissue | Disease Stage | Target Gene | RSS | Regulon Activity |
| ∗The dot plots of a searched regulon are shown for all cell subpopulations in each disease state of each tissue based on the regulon specific score inferred using pySCENIC and by calculating the average expression. |
| Page: 1 |
Top |
Somatic mutation of malignant transformation related genes |
| Annotation of somatic variants for genes involved in malignant transformation |
| Hugo Symbol | Variant Class | Variant Classification | dbSNP RS | HGVSc | HGVSp | HGVSp Short | SWISSPROT | BIOTYPE | SIFT | PolyPhen | Tumor Sample Barcode | Tissue | Histology | Sex | Age | Stage | Therapy Types | Drugs | Outcome |
| FOCAD | SNV | Missense_Mutation | c.15N>G | p.Ile5Met | p.I5M | Q5VW36 | protein_coding | deleterious(0.04) | probably_damaging(0.996) | TCGA-A2-A0CL-01 | Breast | breast invasive carcinoma | Female | <65 | III/IV | Chemotherapy | cytoxan | SD | |
| FOCAD | SNV | Missense_Mutation | novel | c.1297N>C | p.Asp433His | p.D433H | Q5VW36 | protein_coding | tolerated(0.26) | probably_damaging(0.945) | TCGA-A2-A3XT-01 | Breast | breast invasive carcinoma | Female | <65 | I/II | Chemotherapy | cyclophosphamide | PR |
| FOCAD | SNV | Missense_Mutation | c.793N>T | p.Leu265Phe | p.L265F | Q5VW36 | protein_coding | deleterious(0.01) | probably_damaging(0.998) | TCGA-A8-A09I-01 | Breast | breast invasive carcinoma | Female | >=65 | I/II | Hormone Therapy | anastrozole | SD | |
| FOCAD | SNV | Missense_Mutation | rs552730221 | c.3130G>A | p.Ala1044Thr | p.A1044T | Q5VW36 | protein_coding | deleterious(0.03) | probably_damaging(0.997) | TCGA-A8-A09Z-01 | Breast | breast invasive carcinoma | Female | >=65 | I/II | Unknown | Unknown | SD |
| FOCAD | SNV | Missense_Mutation | c.3473N>G | p.Ser1158Cys | p.S1158C | Q5VW36 | protein_coding | deleterious(0) | probably_damaging(0.998) | TCGA-AC-A23H-01 | Breast | breast invasive carcinoma | Female | >=65 | I/II | Unknown | Unknown | PD | |
| FOCAD | SNV | Missense_Mutation | rs537746068 | c.1349N>T | p.Ala450Val | p.A450V | Q5VW36 | protein_coding | tolerated(0.42) | benign(0) | TCGA-AN-A0FL-01 | Breast | breast invasive carcinoma | Female | <65 | I/II | Unknown | Unknown | SD |
| FOCAD | SNV | Missense_Mutation | rs377733434 | c.2017N>G | p.Leu673Val | p.L673V | Q5VW36 | protein_coding | deleterious(0) | probably_damaging(0.994) | TCGA-BH-A0BP-01 | Breast | breast invasive carcinoma | Female | >=65 | I/II | Unknown | Unknown | SD |
| FOCAD | SNV | Missense_Mutation | c.4661N>A | p.Ile1554Asn | p.I1554N | Q5VW36 | protein_coding | deleterious(0) | possibly_damaging(0.826) | TCGA-BH-A18G-01 | Breast | breast invasive carcinoma | Female | >=65 | I/II | Unknown | Unknown | SD | |
| FOCAD | SNV | Missense_Mutation | rs772465371 | c.4551N>T | p.Met1517Ile | p.M1517I | Q5VW36 | protein_coding | deleterious(0.01) | possibly_damaging(0.491) | TCGA-D8-A1JA-01 | Breast | breast invasive carcinoma | Female | <65 | III/IV | Chemotherapy | adriamycin | PD |
| FOCAD | SNV | Missense_Mutation | c.5164N>T | p.His1722Tyr | p.H1722Y | Q5VW36 | protein_coding | deleterious(0.05) | possibly_damaging(0.684) | TCGA-D8-A1JA-01 | Breast | breast invasive carcinoma | Female | <65 | III/IV | Chemotherapy | adriamycin | PD |
| Page: 1 2 3 4 5 6 7 8 9 10 11 12 13 14 15 16 17 18 |
Top |
Related drugs of malignant transformation related genes |
| Identification of chemicals and drugs interact with genes involved in malignant transfromation |
| (DGIdb 4.0) |
| Entrez ID | Symbol | Category | Interaction Types | Drug Claim Name | Drug Name | PMIDs |
| Page: 1 |

Copyright 2023-Present -The University of Texas Health Science Center at Houston |