
|
|||||
|
 | |
| |
| |
| |
| |
| |
|
Gene: FNTB |
Gene summary for FNTB |
| Gene information | Species | Human | Gene symbol | FNTB | Gene ID | 2342 |
| Gene name | farnesyltransferase, CAAX box, beta | |
| Gene Alias | FPTB | |
| Cytomap | 14q23.3 | |
| Gene Type | protein-coding | GO ID | GO:0006464 | UniProtAcc | P49356 |
Top |
Malignant transformation analysis |
| Identification of the aberrant gene expression in precancerous and cancerous lesions by comparing the gene expression of stem-like cells in diseased tissues with normal stem cells |
| Entrez ID | Symbol | Replicates | Species | Organ | Tissue | Adj P-value | Log2FC | Malignancy |
| 2342 | FNTB | LZE4T | Human | Esophagus | ESCC | 4.16e-02 | 1.49e-01 | 0.0811 |
| 2342 | FNTB | LZE20T | Human | Esophagus | ESCC | 2.64e-05 | 2.37e-01 | 0.0662 |
| 2342 | FNTB | LZE24T | Human | Esophagus | ESCC | 6.37e-05 | 1.92e-01 | 0.0596 |
| 2342 | FNTB | P1T-E | Human | Esophagus | ESCC | 2.82e-02 | 1.71e-01 | 0.0875 |
| 2342 | FNTB | P2T-E | Human | Esophagus | ESCC | 4.69e-12 | 2.61e-01 | 0.1177 |
| 2342 | FNTB | P4T-E | Human | Esophagus | ESCC | 5.20e-11 | 2.66e-01 | 0.1323 |
| 2342 | FNTB | P5T-E | Human | Esophagus | ESCC | 1.17e-04 | 9.99e-02 | 0.1327 |
| 2342 | FNTB | P8T-E | Human | Esophagus | ESCC | 2.48e-05 | 1.46e-01 | 0.0889 |
| 2342 | FNTB | P9T-E | Human | Esophagus | ESCC | 2.04e-04 | 1.55e-01 | 0.1131 |
| 2342 | FNTB | P10T-E | Human | Esophagus | ESCC | 1.89e-17 | 3.33e-01 | 0.116 |
| 2342 | FNTB | P11T-E | Human | Esophagus | ESCC | 4.42e-08 | 3.49e-01 | 0.1426 |
| 2342 | FNTB | P12T-E | Human | Esophagus | ESCC | 1.58e-25 | 5.36e-01 | 0.1122 |
| 2342 | FNTB | P15T-E | Human | Esophagus | ESCC | 1.55e-16 | 3.82e-01 | 0.1149 |
| 2342 | FNTB | P16T-E | Human | Esophagus | ESCC | 2.28e-07 | 2.03e-01 | 0.1153 |
| 2342 | FNTB | P17T-E | Human | Esophagus | ESCC | 5.91e-03 | 1.93e-01 | 0.1278 |
| 2342 | FNTB | P20T-E | Human | Esophagus | ESCC | 1.00e-05 | 1.70e-01 | 0.1124 |
| 2342 | FNTB | P21T-E | Human | Esophagus | ESCC | 6.41e-03 | 1.45e-01 | 0.1617 |
| 2342 | FNTB | P22T-E | Human | Esophagus | ESCC | 2.87e-05 | 1.39e-01 | 0.1236 |
| 2342 | FNTB | P23T-E | Human | Esophagus | ESCC | 5.74e-03 | 1.57e-01 | 0.108 |
| 2342 | FNTB | P24T-E | Human | Esophagus | ESCC | 3.62e-06 | 2.10e-01 | 0.1287 |
| Page: 1 2 3 |
| Tissue | Expression Dynamics | Abbreviation |
| Esophagus | 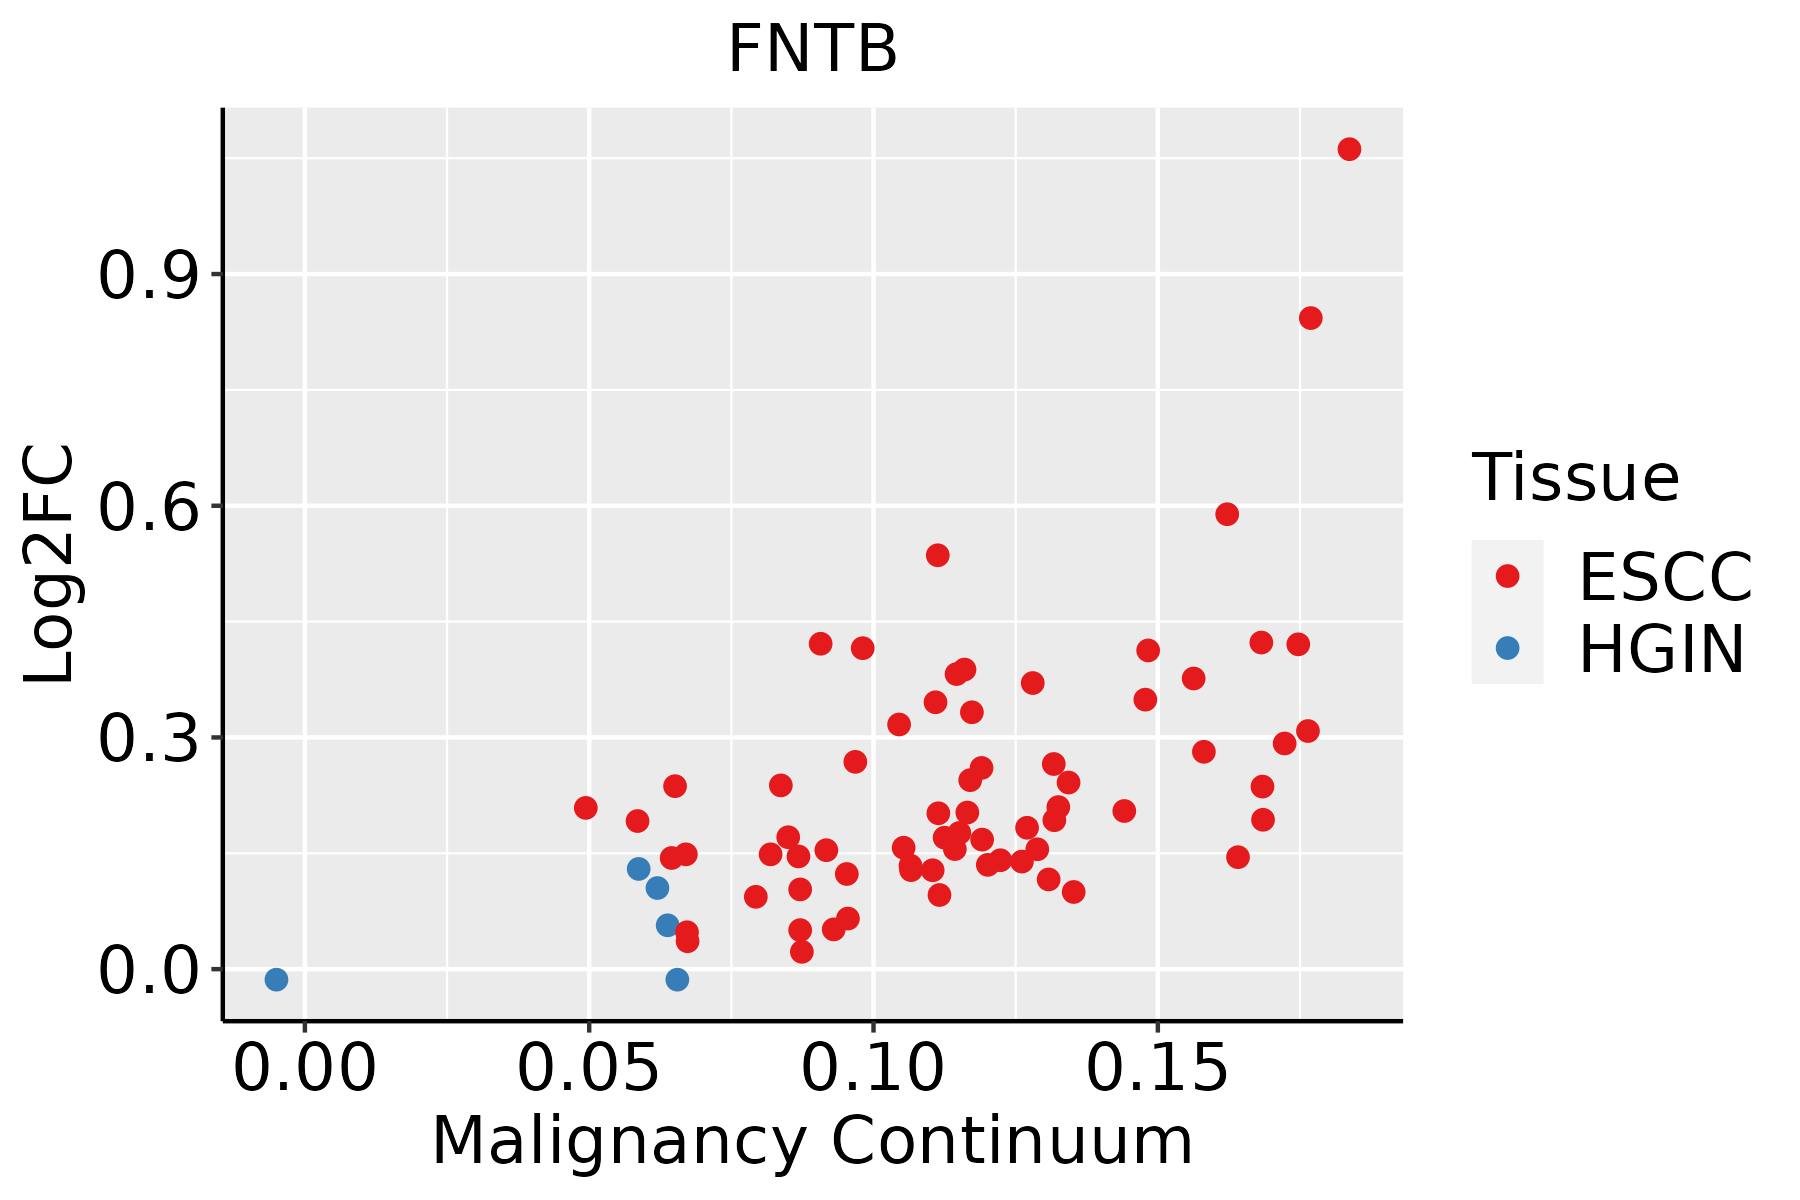 | ESCC: Esophageal squamous cell carcinoma |
| HGIN: High-grade intraepithelial neoplasias | ||
| LGIN: Low-grade intraepithelial neoplasias |
| ∗log2FC in expression of this searched gene in stem-like cells from each diseased tissue sample relative to stem-like cells in normal samples in each tissue plotted against the malignancy continuum. Samples are colored based on if they are from different disease stage. |
Top |
Malignant transformation related pathway analysis |
| Find out the enriched GO biological processes and KEGG pathways involved in transition from healthy to precancer to cancer |
| Tissue | Disease Stage | Enriched GO biological Processes |
| Colorectum | AD |  |
| Colorectum | SER |  |
| Colorectum | MSS |  |
| Colorectum | MSI-H |  |
| Colorectum | FAP |  |
| ∗Top 15 enriched GO BP terms are showed in the bar plot of each disease state in each tissue. Each row represents a significant GO biological process which is colored according to the -log10(p.adjust). |
| Page: 1 2 3 4 5 6 7 8 9 |
| GO ID | Tissue | Disease Stage | Description | Gene Ratio | Bg Ratio | pvalue | p.adjust | Count |
| Page: 1 |
| Pathway ID | Tissue | Disease Stage | Description | Gene Ratio | Bg Ratio | pvalue | p.adjust | qvalue | Count |
| hsa009005 | Esophagus | ESCC | Terpenoid backbone biosynthesis | 20/4205 | 23/8465 | 2.14e-04 | 7.87e-04 | 4.03e-04 | 20 |
| hsa0090012 | Esophagus | ESCC | Terpenoid backbone biosynthesis | 20/4205 | 23/8465 | 2.14e-04 | 7.87e-04 | 4.03e-04 | 20 |
| Page: 1 |
Top |
Cell-cell communication analysis |
| Identification of potential cell-cell interactions between two cell types and their ligand-receptor pairs for different disease states |
| Ligand | Receptor | LRpair | Pathway | Tissue | Disease Stage |
| Page: 1 |
Top |
Single-cell gene regulatory network inference analysis |
| Find out the significant the regulons (TFs) and the target genes of each regulon across cell types for different disease states |
| TF | Cell Type | Tissue | Disease Stage | Target Gene | RSS | Regulon Activity |
| ∗The dot plots of a searched regulon are shown for all cell subpopulations in each disease state of each tissue based on the regulon specific score inferred using pySCENIC and by calculating the average expression. |
| Page: 1 |
Top |
Somatic mutation of malignant transformation related genes |
| Annotation of somatic variants for genes involved in malignant transformation |
| Hugo Symbol | Variant Class | Variant Classification | dbSNP RS | HGVSc | HGVSp | HGVSp Short | SWISSPROT | BIOTYPE | SIFT | PolyPhen | Tumor Sample Barcode | Tissue | Histology | Sex | Age | Stage | Therapy Types | Drugs | Outcome |
| FNTB | SNV | Missense_Mutation | novel | c.725N>G | p.Val242Gly | p.V242G | P49356 | protein_coding | tolerated(0.34) | benign(0.309) | TCGA-A2-A0CS-01 | Breast | breast invasive carcinoma | Female | >=65 | III/IV | Hormone Therapy | anastrozole | SD |
| FNTB | SNV | Missense_Mutation | rs778887316 | c.17N>T | p.Ser6Phe | p.S6F | P49356 | protein_coding | deleterious_low_confidence(0) | probably_damaging(0.962) | TCGA-AC-A8OQ-01 | Breast | breast invasive carcinoma | Female | >=65 | I/II | Unknown | Unknown | SD |
| FNTB | SNV | Missense_Mutation | c.731N>A | p.Gly244Glu | p.G244E | P49356 | protein_coding | deleterious(0.02) | benign(0.383) | TCGA-AN-A0AT-01 | Breast | breast invasive carcinoma | Female | <65 | I/II | Unknown | Unknown | SD | |
| FNTB | SNV | Missense_Mutation | c.574N>T | p.Leu192Phe | p.L192F | P49356 | protein_coding | tolerated(0.7) | benign(0.161) | TCGA-BH-A0HF-01 | Breast | breast invasive carcinoma | Female | >=65 | I/II | Hormone Therapy | arimidex | SD | |
| FNTB | SNV | Missense_Mutation | c.95N>C | p.Arg32Pro | p.R32P | P49356 | protein_coding | deleterious(0.05) | benign(0.136) | TCGA-D8-A1JA-01 | Breast | breast invasive carcinoma | Female | <65 | III/IV | Chemotherapy | adriamycin | PD | |
| FNTB | SNV | Missense_Mutation | c.373G>C | p.Asp125His | p.D125H | P49356 | protein_coding | tolerated(0.09) | benign(0.222) | TCGA-E2-A1LG-01 | Breast | breast invasive carcinoma | Female | <65 | I/II | Chemotherapy | doxorubicin | SD | |
| FNTB | deletion | Frame_Shift_Del | novel | c.1001delN | p.Leu335CysfsTer6 | p.L335Cfs*6 | P49356 | protein_coding | TCGA-VS-A94Z-01 | Cervix | cervical & endocervical cancer | Female | <65 | I/II | Chemotherapy | cisplatin | CR | ||
| FNTB | SNV | Missense_Mutation | novel | c.76N>G | p.Leu26Val | p.L26V | P49356 | protein_coding | tolerated_low_confidence(0.2) | benign(0) | TCGA-AM-5820-01 | Colorectum | colon adenocarcinoma | Female | <65 | I/II | Unknown | Unknown | SD |
| FNTB | SNV | Missense_Mutation | rs773699138 | c.946C>T | p.His316Tyr | p.H316Y | P49356 | protein_coding | tolerated(1) | benign(0) | TCGA-AZ-4313-01 | Colorectum | colon adenocarcinoma | Female | <65 | I/II | Unknown | Unknown | SD |
| FNTB | SNV | Missense_Mutation | novel | c.625T>G | p.Ser209Ala | p.S209A | P49356 | protein_coding | tolerated(0.17) | benign(0.05) | TCGA-CA-6717-01 | Colorectum | colon adenocarcinoma | Male | <65 | I/II | Chemotherapy | oxaliplatin | CR |
| Page: 1 2 3 4 5 |
Top |
Related drugs of malignant transformation related genes |
| Identification of chemicals and drugs interact with genes involved in malignant transfromation |
| (DGIdb 4.0) |
| Entrez ID | Symbol | Category | Interaction Types | Drug Claim Name | Drug Name | PMIDs |
| 2342 | FNTB | DRUGGABLE GENOME, ENZYME, CLINICALLY ACTIONABLE | lonafarnib | LONAFARNIB | 26033044 | |
| 2342 | FNTB | DRUGGABLE GENOME, ENZYME, CLINICALLY ACTIONABLE | inhibitor | 249565706 | BMS-214662 | |
| 2342 | FNTB | DRUGGABLE GENOME, ENZYME, CLINICALLY ACTIONABLE | inhibitor | 249565705 | TIPIFARNIB | |
| 2342 | FNTB | DRUGGABLE GENOME, ENZYME, CLINICALLY ACTIONABLE | inhibitor | CHEMBL289228 | TIPIFARNIB | |
| 2342 | FNTB | DRUGGABLE GENOME, ENZYME, CLINICALLY ACTIONABLE | TIPIFARNIB | TIPIFARNIB | ||
| 2342 | FNTB | DRUGGABLE GENOME, ENZYME, CLINICALLY ACTIONABLE | inhibitor | 249565708 | ||
| 2342 | FNTB | DRUGGABLE GENOME, ENZYME, CLINICALLY ACTIONABLE | carboplatin | CARBOPLATIN | 26033044 | |
| 2342 | FNTB | DRUGGABLE GENOME, ENZYME, CLINICALLY ACTIONABLE | CP-609,754 | |||
| 2342 | FNTB | DRUGGABLE GENOME, ENZYME, CLINICALLY ACTIONABLE | paclitaxel | PACLITAXEL | 26033044 | |
| 2342 | FNTB | DRUGGABLE GENOME, ENZYME, CLINICALLY ACTIONABLE | inhibitor | 178103145 |
| Page: 1 2 |

Copyright 2023-Present -The University of Texas Health Science Center at Houston |