
|
|||||
|
 | |
| |
| |
| |
| |
| |
|
Gene: FNIP2 |
Gene summary for FNIP2 |
| Gene information | Species | Human | Gene symbol | FNIP2 | Gene ID | 57600 |
| Gene name | folliculin interacting protein 2 | |
| Gene Alias | FNIPL | |
| Cytomap | 4q32.1 | |
| Gene Type | protein-coding | GO ID | GO:0000122 | UniProtAcc | Q9P278 |
Top |
Malignant transformation analysis |
| Identification of the aberrant gene expression in precancerous and cancerous lesions by comparing the gene expression of stem-like cells in diseased tissues with normal stem cells |
| Entrez ID | Symbol | Replicates | Species | Organ | Tissue | Adj P-value | Log2FC | Malignancy |
| 57600 | FNIP2 | HTA11_3410_2000001011 | Human | Colorectum | AD | 7.15e-23 | -6.34e-01 | 0.0155 |
| 57600 | FNIP2 | HTA11_411_2000001011 | Human | Colorectum | SER | 9.49e-03 | 7.93e-01 | -0.2602 |
| 57600 | FNIP2 | HTA11_696_2000001011 | Human | Colorectum | AD | 8.02e-04 | -3.09e-01 | -0.1464 |
| 57600 | FNIP2 | HTA11_866_3004761011 | Human | Colorectum | AD | 2.21e-06 | -4.27e-01 | 0.096 |
| 57600 | FNIP2 | HTA11_9408_2000001011 | Human | Colorectum | AD | 2.54e-02 | -7.40e-01 | 0.0451 |
| 57600 | FNIP2 | HTA11_8622_2000001021 | Human | Colorectum | SER | 1.44e-03 | -4.20e-01 | 0.0528 |
| 57600 | FNIP2 | HTA11_10711_2000001011 | Human | Colorectum | AD | 1.51e-11 | -6.49e-01 | 0.0338 |
| 57600 | FNIP2 | HTA11_7696_3000711011 | Human | Colorectum | AD | 4.33e-16 | -5.24e-01 | 0.0674 |
| 57600 | FNIP2 | HTA11_6818_2000001011 | Human | Colorectum | AD | 2.90e-05 | -5.31e-01 | 0.0112 |
| 57600 | FNIP2 | HTA11_6818_2000001021 | Human | Colorectum | AD | 8.02e-07 | -4.68e-01 | 0.0588 |
| 57600 | FNIP2 | HTA11_99999974143_84620 | Human | Colorectum | MSS | 2.49e-21 | -5.94e-01 | 0.3005 |
| 57600 | FNIP2 | F007 | Human | Colorectum | FAP | 1.48e-03 | -2.82e-01 | 0.1176 |
| 57600 | FNIP2 | A002-C-010 | Human | Colorectum | FAP | 5.87e-04 | -2.99e-01 | 0.242 |
| 57600 | FNIP2 | A001-C-207 | Human | Colorectum | FAP | 4.98e-03 | -1.21e-01 | 0.1278 |
| 57600 | FNIP2 | A015-C-203 | Human | Colorectum | FAP | 1.44e-34 | -4.75e-01 | -0.1294 |
| 57600 | FNIP2 | A015-C-204 | Human | Colorectum | FAP | 2.72e-07 | -3.16e-01 | -0.0228 |
| 57600 | FNIP2 | A014-C-040 | Human | Colorectum | FAP | 1.72e-04 | -4.55e-01 | -0.1184 |
| 57600 | FNIP2 | A002-C-201 | Human | Colorectum | FAP | 2.23e-21 | -4.89e-01 | 0.0324 |
| 57600 | FNIP2 | A002-C-203 | Human | Colorectum | FAP | 2.08e-10 | -2.56e-01 | 0.2786 |
| 57600 | FNIP2 | A001-C-119 | Human | Colorectum | FAP | 2.30e-10 | -4.49e-01 | -0.1557 |
| Page: 1 2 3 4 5 6 |
| Tissue | Expression Dynamics | Abbreviation |
| Colorectum (GSE201348) |  | FAP: Familial adenomatous polyposis |
| CRC: Colorectal cancer | ||
| Colorectum (HTA11) |  | AD: Adenomas |
| SER: Sessile serrated lesions | ||
| MSI-H: Microsatellite-high colorectal cancer | ||
| MSS: Microsatellite stable colorectal cancer | ||
| Liver | 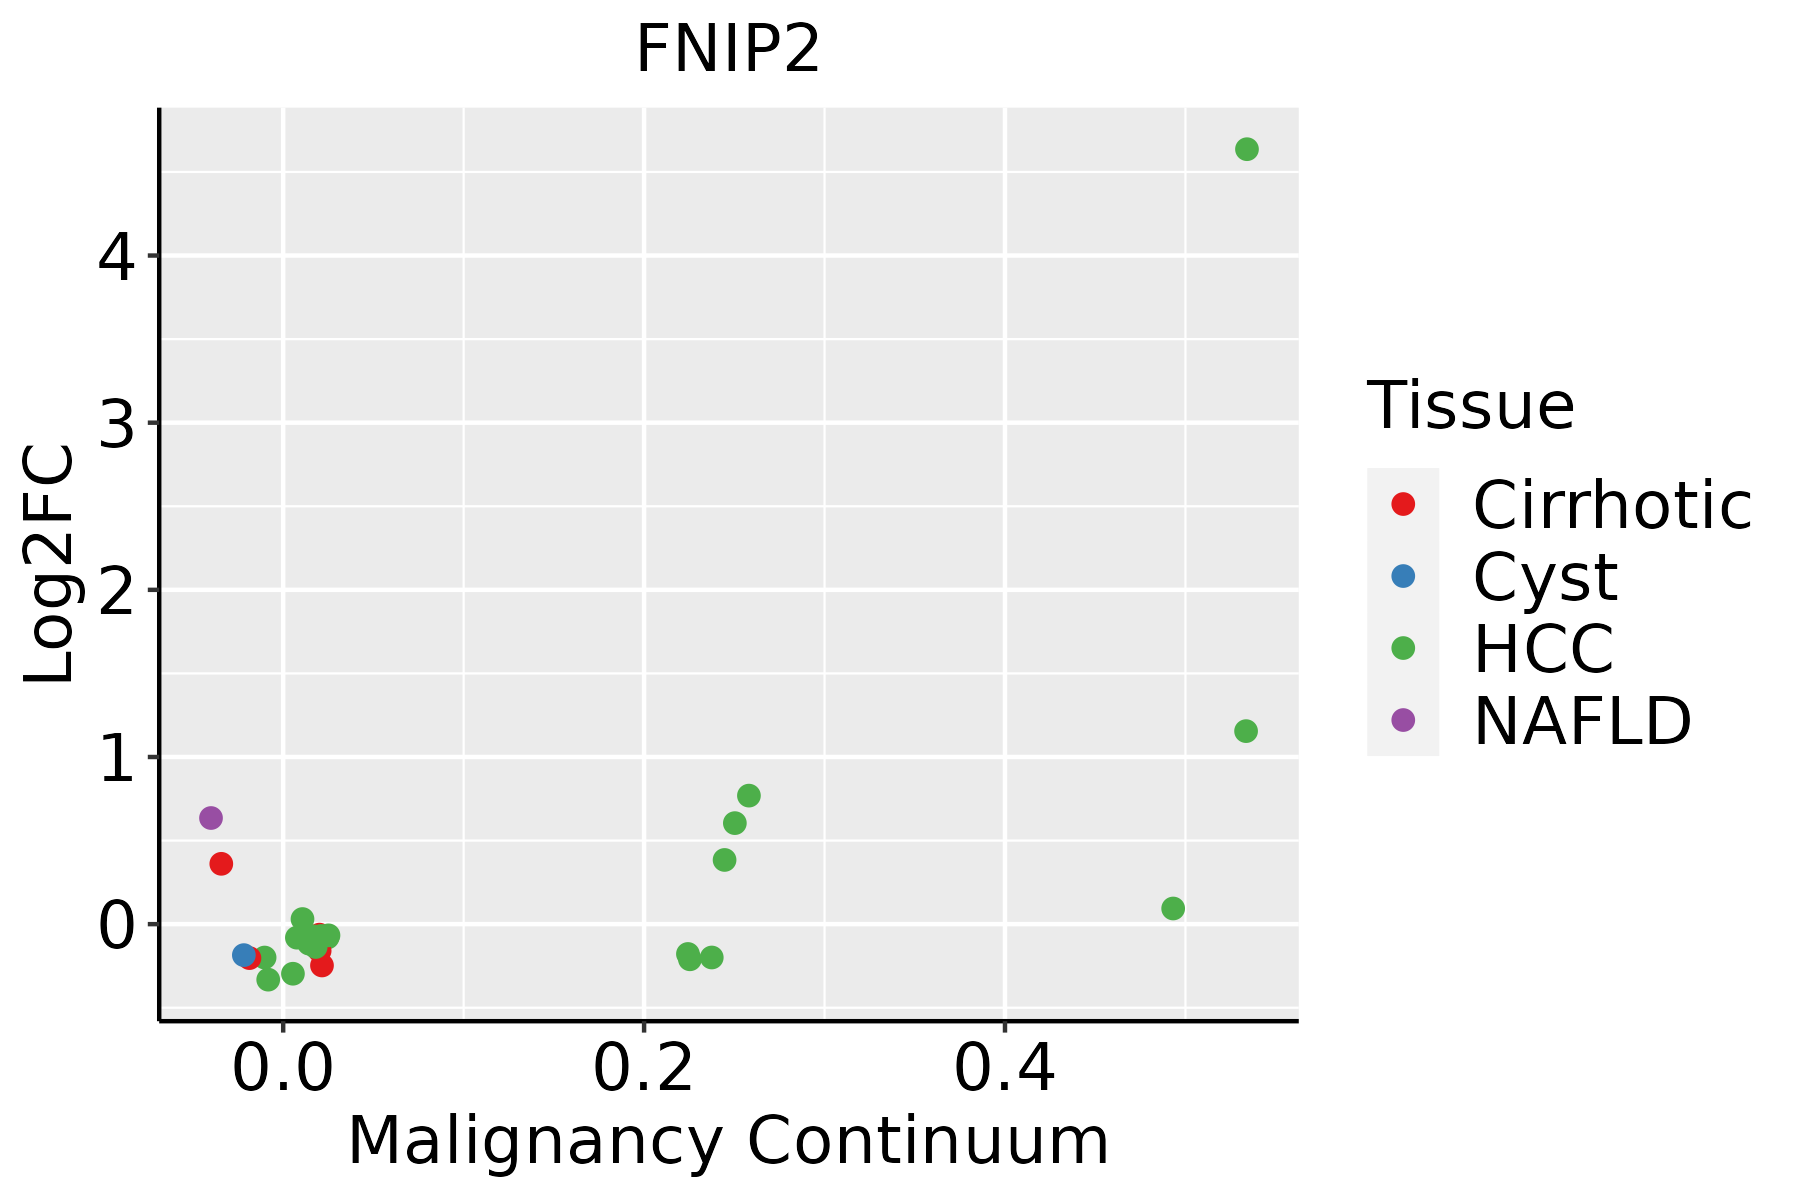 | HCC: Hepatocellular carcinoma |
| NAFLD: Non-alcoholic fatty liver disease | ||
| Lung | 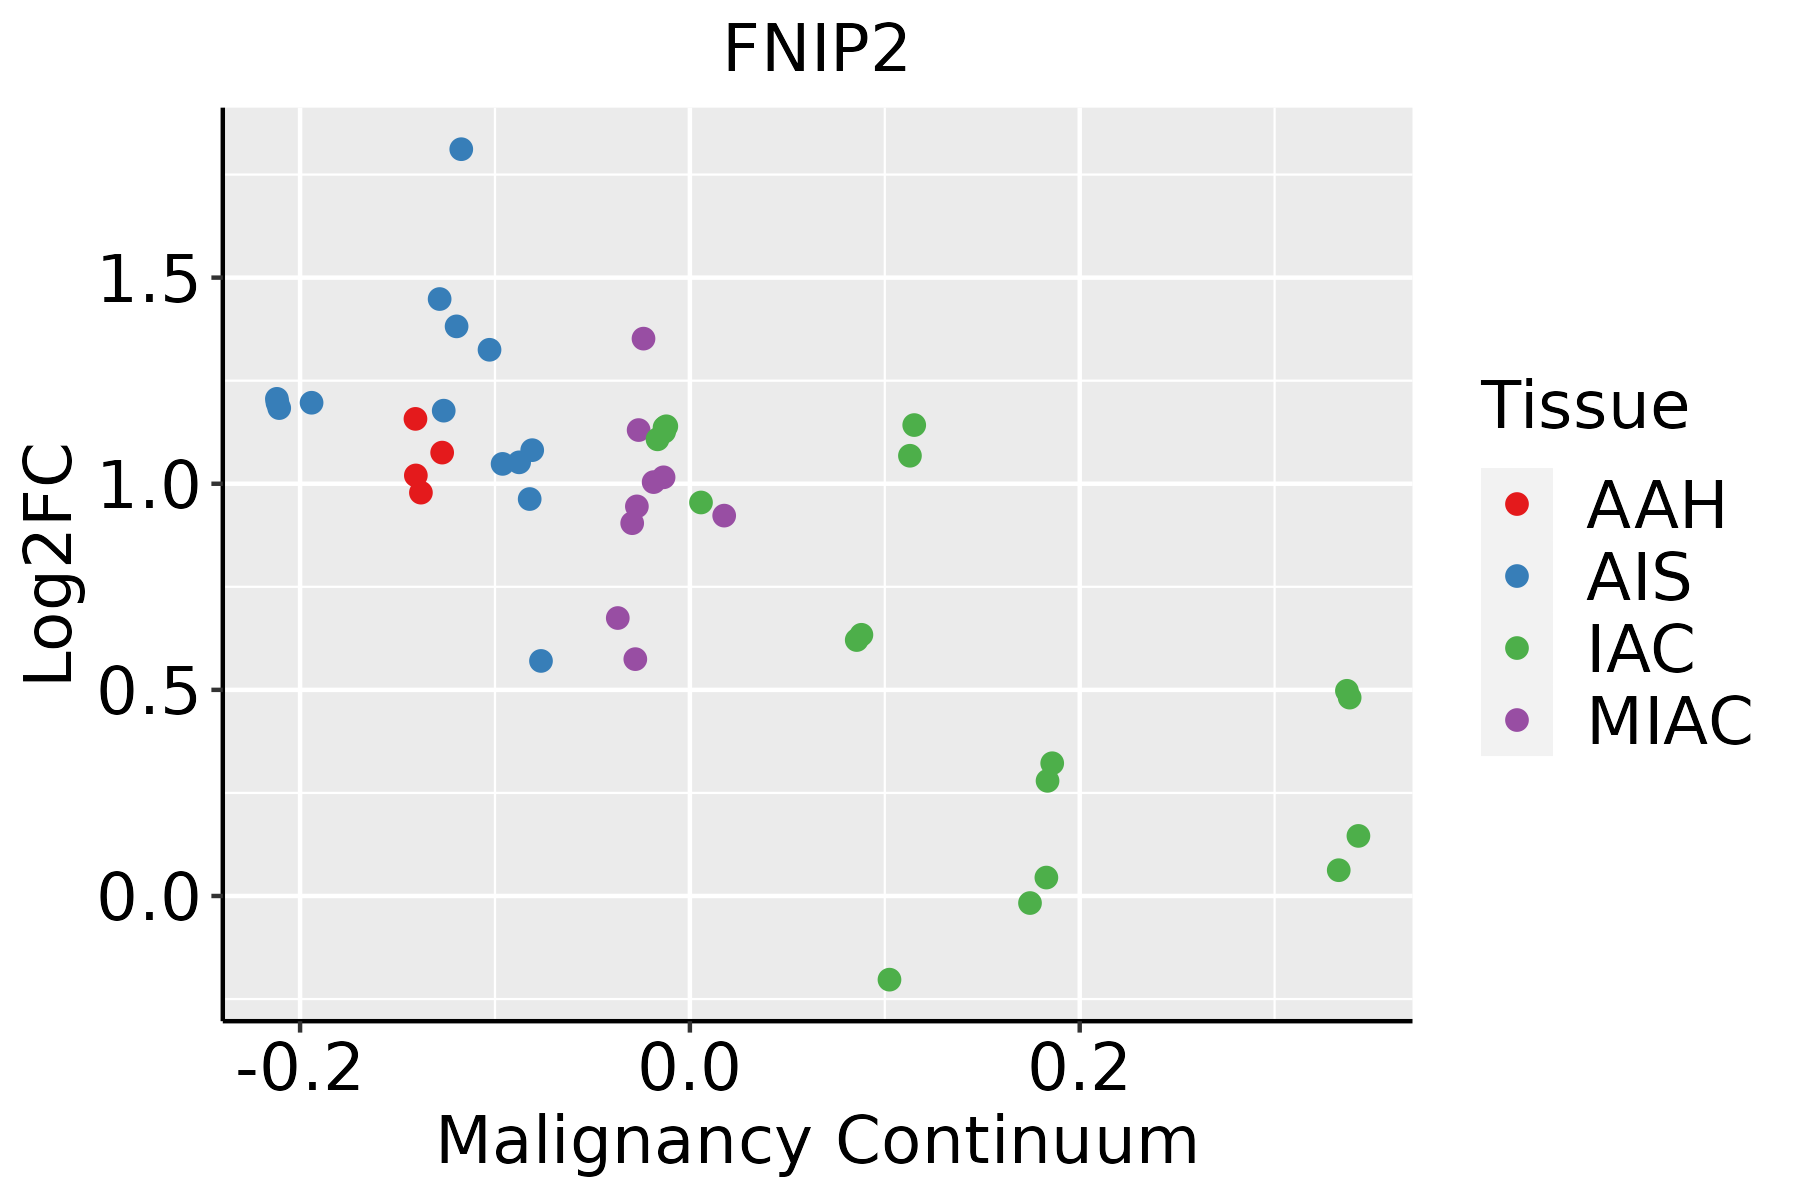 | AAH: Atypical adenomatous hyperplasia |
| AIS: Adenocarcinoma in situ | ||
| IAC: Invasive lung adenocarcinoma | ||
| MIA: Minimally invasive adenocarcinoma | ||
| Oral Cavity |  | EOLP: Erosive Oral lichen planus |
| LP: leukoplakia | ||
| NEOLP: Non-erosive oral lichen planus | ||
| OSCC: Oral squamous cell carcinoma | ||
| Prostate | 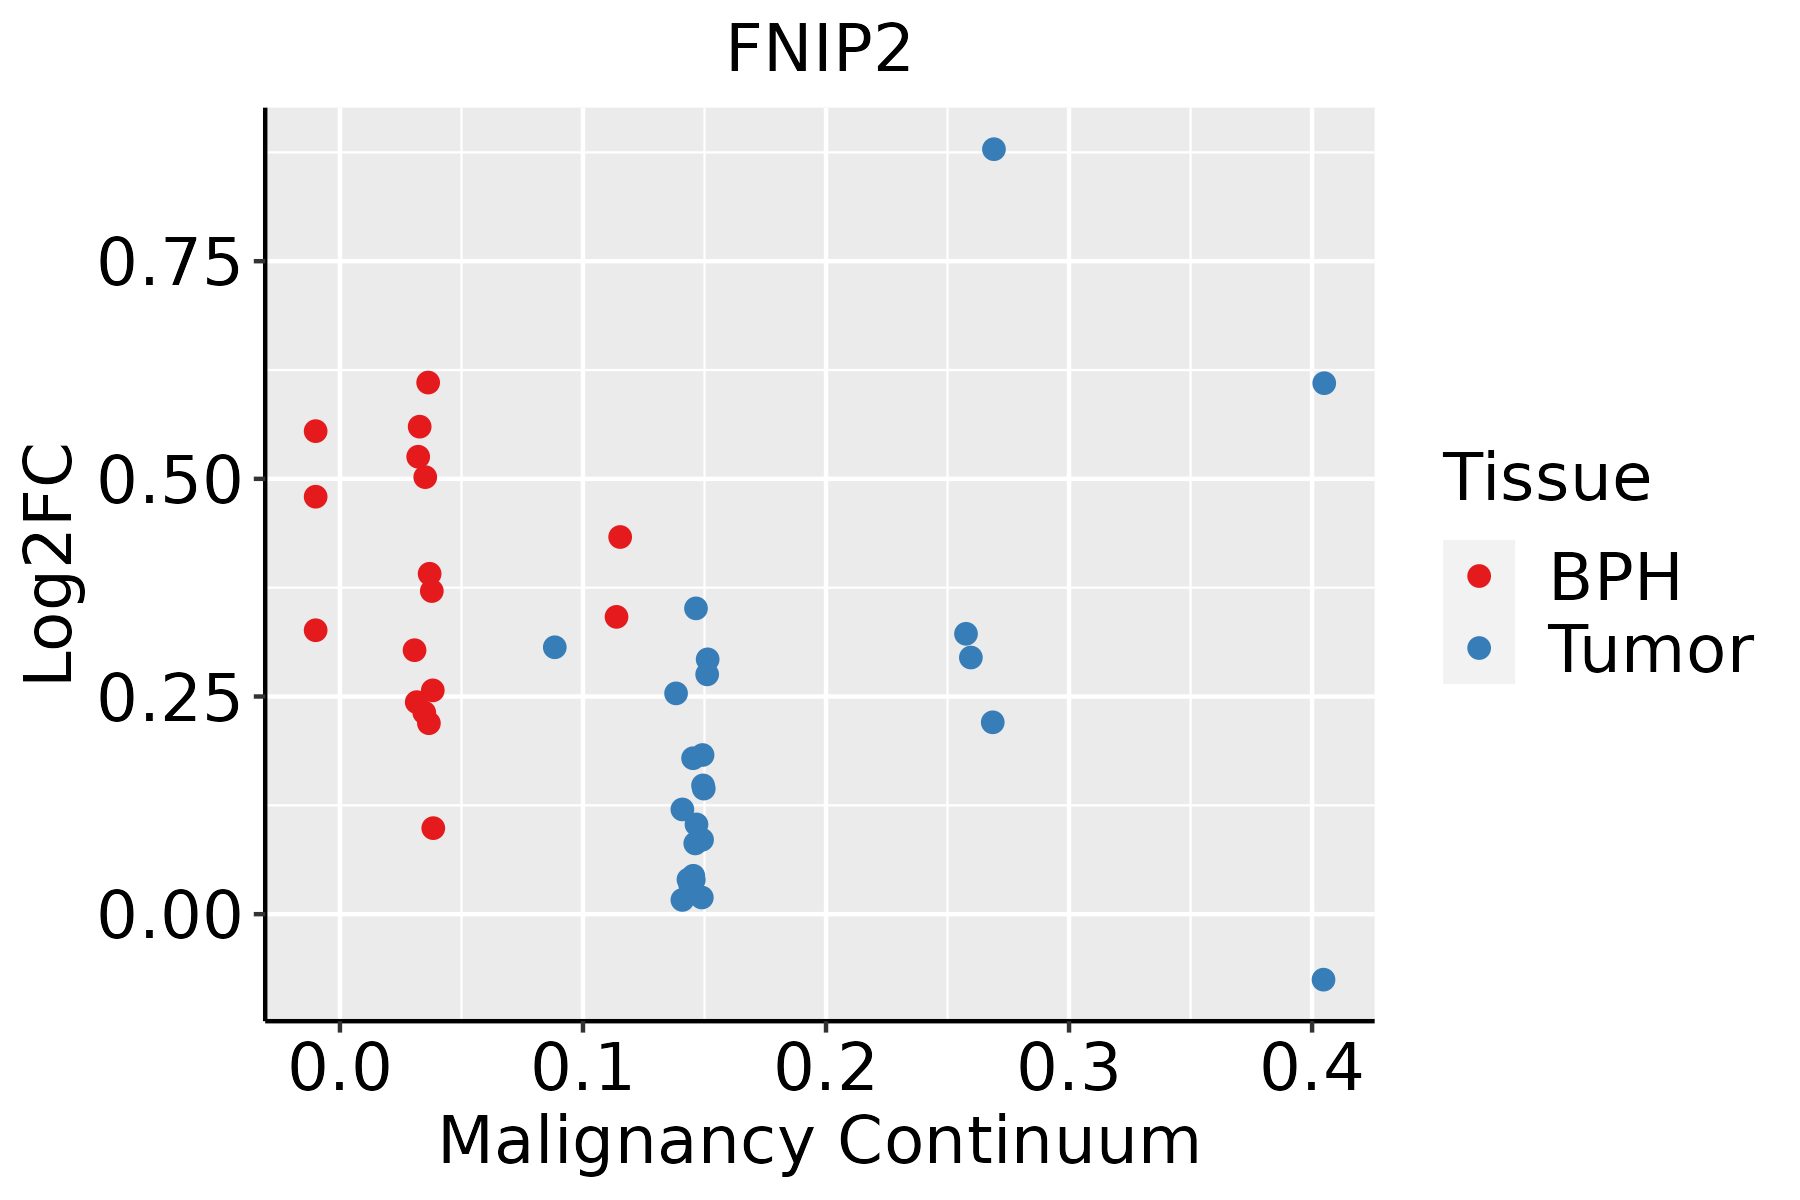 | BPH: Benign Prostatic Hyperplasia |
| Thyroid |  | ATC: Anaplastic thyroid cancer |
| HT: Hashimoto's thyroiditis | ||
| PTC: Papillary thyroid cancer |
| ∗log2FC in expression of this searched gene in stem-like cells from each diseased tissue sample relative to stem-like cells in normal samples in each tissue plotted against the malignancy continuum. Samples are colored based on if they are from different disease stage. |
Top |
Malignant transformation related pathway analysis |
| Find out the enriched GO biological processes and KEGG pathways involved in transition from healthy to precancer to cancer |
| Tissue | Disease Stage | Enriched GO biological Processes |
| Colorectum | AD |  |
| Colorectum | SER |  |
| Colorectum | MSS |  |
| Colorectum | MSI-H |  |
| Colorectum | FAP |  |
| ∗Top 15 enriched GO BP terms are showed in the bar plot of each disease state in each tissue. Each row represents a significant GO biological process which is colored according to the -log10(p.adjust). |
| Page: 1 2 3 4 5 6 7 8 9 |
| GO ID | Tissue | Disease Stage | Description | Gene Ratio | Bg Ratio | pvalue | p.adjust | Count |
| GO:0043254 | Colorectum | AD | regulation of protein-containing complex assembly | 148/3918 | 428/18723 | 2.64e-11 | 3.18e-09 | 148 |
| GO:0097193 | Colorectum | AD | intrinsic apoptotic signaling pathway | 108/3918 | 288/18723 | 6.25e-11 | 6.41e-09 | 108 |
| GO:0031334 | Colorectum | AD | positive regulation of protein-containing complex assembly | 91/3918 | 237/18723 | 4.78e-10 | 3.99e-08 | 91 |
| GO:0018105 | Colorectum | AD | peptidyl-serine phosphorylation | 88/3918 | 315/18723 | 1.73e-03 | 1.43e-02 | 88 |
| GO:0008630 | Colorectum | AD | intrinsic apoptotic signaling pathway in response to DNA damage | 33/3918 | 99/18723 | 2.71e-03 | 2.05e-02 | 33 |
| GO:0018209 | Colorectum | AD | peptidyl-serine modification | 92/3918 | 338/18723 | 3.19e-03 | 2.36e-02 | 92 |
| GO:00432541 | Colorectum | SER | regulation of protein-containing complex assembly | 119/2897 | 428/18723 | 3.34e-11 | 5.86e-09 | 119 |
| GO:00971931 | Colorectum | SER | intrinsic apoptotic signaling pathway | 87/2897 | 288/18723 | 1.67e-10 | 2.32e-08 | 87 |
| GO:00313341 | Colorectum | SER | positive regulation of protein-containing complex assembly | 73/2897 | 237/18723 | 1.89e-09 | 1.84e-07 | 73 |
| GO:00181051 | Colorectum | SER | peptidyl-serine phosphorylation | 66/2897 | 315/18723 | 5.47e-03 | 4.06e-02 | 66 |
| GO:00971932 | Colorectum | MSS | intrinsic apoptotic signaling pathway | 102/3467 | 288/18723 | 6.06e-12 | 9.82e-10 | 102 |
| GO:00432542 | Colorectum | MSS | regulation of protein-containing complex assembly | 130/3467 | 428/18723 | 1.38e-09 | 1.03e-07 | 130 |
| GO:00313342 | Colorectum | MSS | positive regulation of protein-containing complex assembly | 82/3467 | 237/18723 | 2.49e-09 | 1.75e-07 | 82 |
| GO:00181052 | Colorectum | MSS | peptidyl-serine phosphorylation | 81/3467 | 315/18723 | 8.92e-04 | 9.12e-03 | 81 |
| GO:00182091 | Colorectum | MSS | peptidyl-serine modification | 84/3467 | 338/18723 | 2.12e-03 | 1.79e-02 | 84 |
| GO:00432544 | Colorectum | FAP | regulation of protein-containing complex assembly | 101/2622 | 428/18723 | 5.18e-08 | 4.07e-06 | 101 |
| GO:00313344 | Colorectum | FAP | positive regulation of protein-containing complex assembly | 62/2622 | 237/18723 | 5.03e-07 | 2.61e-05 | 62 |
| GO:00181053 | Colorectum | FAP | peptidyl-serine phosphorylation | 71/2622 | 315/18723 | 2.51e-05 | 5.82e-04 | 71 |
| GO:00971934 | Colorectum | FAP | intrinsic apoptotic signaling pathway | 66/2622 | 288/18723 | 2.76e-05 | 6.33e-04 | 66 |
| GO:00182092 | Colorectum | FAP | peptidyl-serine modification | 73/2622 | 338/18723 | 8.47e-05 | 1.51e-03 | 73 |
| Page: 1 2 3 4 5 6 |
| Pathway ID | Tissue | Disease Stage | Description | Gene Ratio | Bg Ratio | pvalue | p.adjust | qvalue | Count |
| hsa04150 | Colorectum | MSS | mTOR signaling pathway | 47/1875 | 156/8465 | 1.19e-02 | 3.99e-02 | 2.44e-02 | 47 |
| hsa041501 | Colorectum | MSS | mTOR signaling pathway | 47/1875 | 156/8465 | 1.19e-02 | 3.99e-02 | 2.44e-02 | 47 |
| hsa041502 | Liver | HCC | mTOR signaling pathway | 95/4020 | 156/8465 | 4.70e-04 | 1.99e-03 | 1.11e-03 | 95 |
| hsa0415011 | Liver | HCC | mTOR signaling pathway | 95/4020 | 156/8465 | 4.70e-04 | 1.99e-03 | 1.11e-03 | 95 |
| hsa041504 | Oral cavity | OSCC | mTOR signaling pathway | 90/3704 | 156/8465 | 2.87e-04 | 9.15e-04 | 4.66e-04 | 90 |
| hsa0415012 | Oral cavity | OSCC | mTOR signaling pathway | 90/3704 | 156/8465 | 2.87e-04 | 9.15e-04 | 4.66e-04 | 90 |
| hsa0415021 | Oral cavity | EOLP | mTOR signaling pathway | 34/1218 | 156/8465 | 7.59e-03 | 2.17e-02 | 1.28e-02 | 34 |
| hsa041503 | Oral cavity | EOLP | mTOR signaling pathway | 34/1218 | 156/8465 | 7.59e-03 | 2.17e-02 | 1.28e-02 | 34 |
| Page: 1 |
Top |
Cell-cell communication analysis |
| Identification of potential cell-cell interactions between two cell types and their ligand-receptor pairs for different disease states |
| Ligand | Receptor | LRpair | Pathway | Tissue | Disease Stage |
| Page: 1 |
Top |
Single-cell gene regulatory network inference analysis |
| Find out the significant the regulons (TFs) and the target genes of each regulon across cell types for different disease states |
| TF | Cell Type | Tissue | Disease Stage | Target Gene | RSS | Regulon Activity |
| ∗The dot plots of a searched regulon are shown for all cell subpopulations in each disease state of each tissue based on the regulon specific score inferred using pySCENIC and by calculating the average expression. |
| Page: 1 |
Top |
Somatic mutation of malignant transformation related genes |
| Annotation of somatic variants for genes involved in malignant transformation |
| Hugo Symbol | Variant Class | Variant Classification | dbSNP RS | HGVSc | HGVSp | HGVSp Short | SWISSPROT | BIOTYPE | SIFT | PolyPhen | Tumor Sample Barcode | Tissue | Histology | Sex | Age | Stage | Therapy Types | Drugs | Outcome |
| FNIP2 | SNV | Missense_Mutation | rs763748801 | c.2678N>T | p.Ser893Leu | p.S893L | Q9P278 | protein_coding | tolerated(0.07) | benign(0.009) | TCGA-A8-A082-01 | Breast | breast invasive carcinoma | Female | <65 | I/II | Chemotherapy | 5-fluorouracil | CR |
| FNIP2 | SNV | Missense_Mutation | rs763748801 | c.2678N>T | p.Ser893Leu | p.S893L | Q9P278 | protein_coding | tolerated(0.07) | benign(0.009) | TCGA-A8-A08G-01 | Breast | breast invasive carcinoma | Female | <65 | I/II | Chemotherapy | 5-fluorouracil | CR |
| FNIP2 | SNV | Missense_Mutation | c.700N>C | p.Asp234His | p.D234H | Q9P278 | protein_coding | deleterious(0) | probably_damaging(0.999) | TCGA-A8-A09M-01 | Breast | breast invasive carcinoma | Female | >=65 | III/IV | Chemotherapy | paclitaxel | CR | |
| FNIP2 | insertion | Frame_Shift_Ins | novel | c.2673_2674insATAAAACCTTC | p.Ser892IlefsTer23 | p.S892Ifs*23 | Q9P278 | protein_coding | TCGA-A8-A09E-01 | Breast | breast invasive carcinoma | Female | >=65 | III/IV | Hormone Therapy | anastrozole | SD | ||
| FNIP2 | insertion | In_Frame_Ins | novel | c.180_181insTGTGTCTTATTT | p.Arg60_Gln61insCysValLeuPhe | p.R60_Q61insCVLF | Q9P278 | protein_coding | TCGA-A8-A0A4-01 | Breast | breast invasive carcinoma | Female | >=65 | I/II | Hormone Therapy | tamoxiphen | CR | ||
| FNIP2 | insertion | In_Frame_Ins | novel | c.182_183insTTTATATCATCTCCT | p.Gln61delinsHisLeuTyrHisLeuLeu | p.Q61delinsHLYHLL | Q9P278 | protein_coding | TCGA-A8-A0A4-01 | Breast | breast invasive carcinoma | Female | >=65 | I/II | Hormone Therapy | tamoxiphen | CR | ||
| FNIP2 | deletion | Frame_Shift_Del | c.697delN | p.Glu233LysfsTer13 | p.E233Kfs*13 | Q9P278 | protein_coding | TCGA-AC-A23H-01 | Breast | breast invasive carcinoma | Female | >=65 | I/II | Unknown | Unknown | PD | |||
| FNIP2 | insertion | Frame_Shift_Ins | novel | c.2333_2334insCCCTGACAGACATCTCCGGGAGAAACCT | p.Gln780AspfsTer18 | p.Q780Dfs*18 | Q9P278 | protein_coding | TCGA-AN-A049-01 | Breast | breast invasive carcinoma | Female | <65 | I/II | Unknown | Unknown | SD | ||
| FNIP2 | insertion | In_Frame_Ins | novel | c.2258_2259insGGCTGCTGATGT | p.Ala755_Ala758dup | p.A755_A758dup | Q9P278 | protein_coding | TCGA-EW-A1OX-01 | Breast | breast invasive carcinoma | Female | <65 | I/II | Chemotherapy | taxotere | SD | ||
| FNIP2 | SNV | Missense_Mutation | rs186888808 | c.2495G>A | p.Arg832Lys | p.R832K | Q9P278 | protein_coding | tolerated(1) | benign(0) | TCGA-2W-A8YY-01 | Cervix | cervical & endocervical cancer | Female | <65 | I/II | Chemotherapy | cisplatin | CR |
| Page: 1 2 3 4 5 6 7 8 9 10 11 12 |
Top |
Related drugs of malignant transformation related genes |
| Identification of chemicals and drugs interact with genes involved in malignant transfromation |
| (DGIdb 4.0) |
| Entrez ID | Symbol | Category | Interaction Types | Drug Claim Name | Drug Name | PMIDs |
| Page: 1 |

Copyright 2023-Present -The University of Texas Health Science Center at Houston |