
|
|||||
|
 | |
| |
| |
| |
| |
| |
|
Gene: FNDC4 |
Gene summary for FNDC4 |
| Gene information | Species | Human | Gene symbol | FNDC4 | Gene ID | 64838 |
| Gene name | fibronectin type III domain containing 4 | |
| Gene Alias | FRCP1 | |
| Cytomap | 2p23.3 | |
| Gene Type | protein-coding | GO ID | GO:0006950 | UniProtAcc | Q9H6D8 |
Top |
Malignant transformation analysis |
| Identification of the aberrant gene expression in precancerous and cancerous lesions by comparing the gene expression of stem-like cells in diseased tissues with normal stem cells |
| Entrez ID | Symbol | Replicates | Species | Organ | Tissue | Adj P-value | Log2FC | Malignancy |
| 64838 | FNDC4 | P2T-E | Human | Esophagus | ESCC | 4.57e-08 | 1.28e-01 | 0.1177 |
| 64838 | FNDC4 | P10T-E | Human | Esophagus | ESCC | 9.02e-11 | 1.92e-01 | 0.116 |
| 64838 | FNDC4 | P12T-E | Human | Esophagus | ESCC | 2.54e-14 | 2.76e-01 | 0.1122 |
| 64838 | FNDC4 | P16T-E | Human | Esophagus | ESCC | 5.93e-15 | 2.88e-01 | 0.1153 |
| 64838 | FNDC4 | P22T-E | Human | Esophagus | ESCC | 2.55e-03 | 7.20e-02 | 0.1236 |
| 64838 | FNDC4 | P26T-E | Human | Esophagus | ESCC | 4.04e-04 | 6.22e-02 | 0.1276 |
| 64838 | FNDC4 | P28T-E | Human | Esophagus | ESCC | 1.15e-02 | 7.52e-02 | 0.1149 |
| 64838 | FNDC4 | P37T-E | Human | Esophagus | ESCC | 1.94e-05 | 1.25e-01 | 0.1371 |
| 64838 | FNDC4 | P38T-E | Human | Esophagus | ESCC | 3.98e-04 | 2.26e-01 | 0.127 |
| 64838 | FNDC4 | P49T-E | Human | Esophagus | ESCC | 3.92e-06 | 6.89e-01 | 0.1768 |
| 64838 | FNDC4 | P56T-E | Human | Esophagus | ESCC | 1.05e-06 | 5.94e-01 | 0.1613 |
| 64838 | FNDC4 | P74T-E | Human | Esophagus | ESCC | 6.29e-05 | 1.41e-01 | 0.1479 |
| 64838 | FNDC4 | P76T-E | Human | Esophagus | ESCC | 2.51e-03 | 1.00e-01 | 0.1207 |
| 64838 | FNDC4 | P130T-E | Human | Esophagus | ESCC | 2.10e-47 | 1.03e+00 | 0.1676 |
| 64838 | FNDC4 | HCC1_Meng | Human | Liver | HCC | 2.26e-03 | -6.81e-02 | 0.0246 |
| 64838 | FNDC4 | S027 | Human | Liver | HCC | 2.14e-23 | 1.80e+00 | 0.2446 |
| 64838 | FNDC4 | S028 | Human | Liver | HCC | 8.48e-40 | 1.69e+00 | 0.2503 |
| 64838 | FNDC4 | S029 | Human | Liver | HCC | 6.05e-34 | 1.74e+00 | 0.2581 |
| 64838 | FNDC4 | male-WTA | Human | Thyroid | PTC | 2.61e-10 | 1.63e-01 | 0.1037 |
| 64838 | FNDC4 | PTC01 | Human | Thyroid | PTC | 5.85e-06 | 1.65e-01 | 0.1899 |
| Page: 1 2 |
| Tissue | Expression Dynamics | Abbreviation |
| Esophagus | 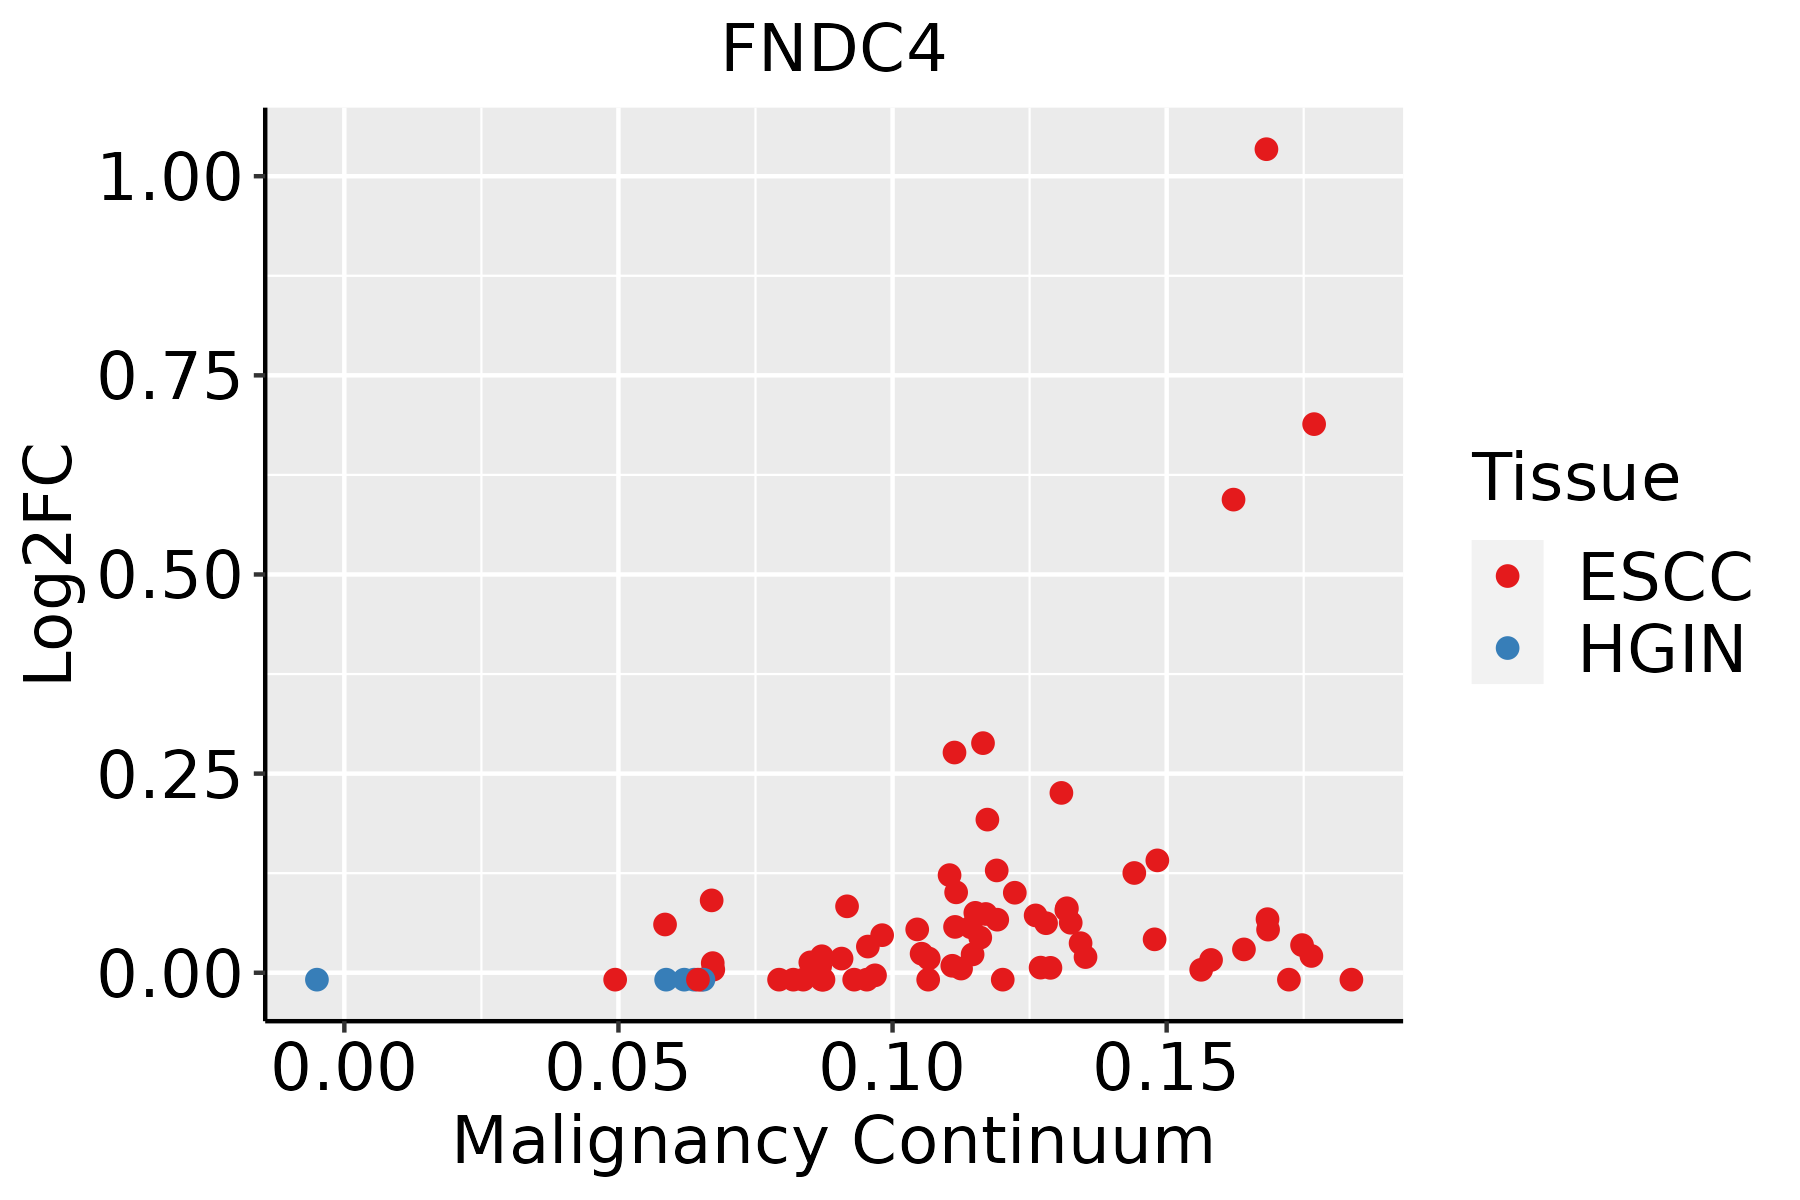 | ESCC: Esophageal squamous cell carcinoma |
| HGIN: High-grade intraepithelial neoplasias | ||
| LGIN: Low-grade intraepithelial neoplasias | ||
| Liver | 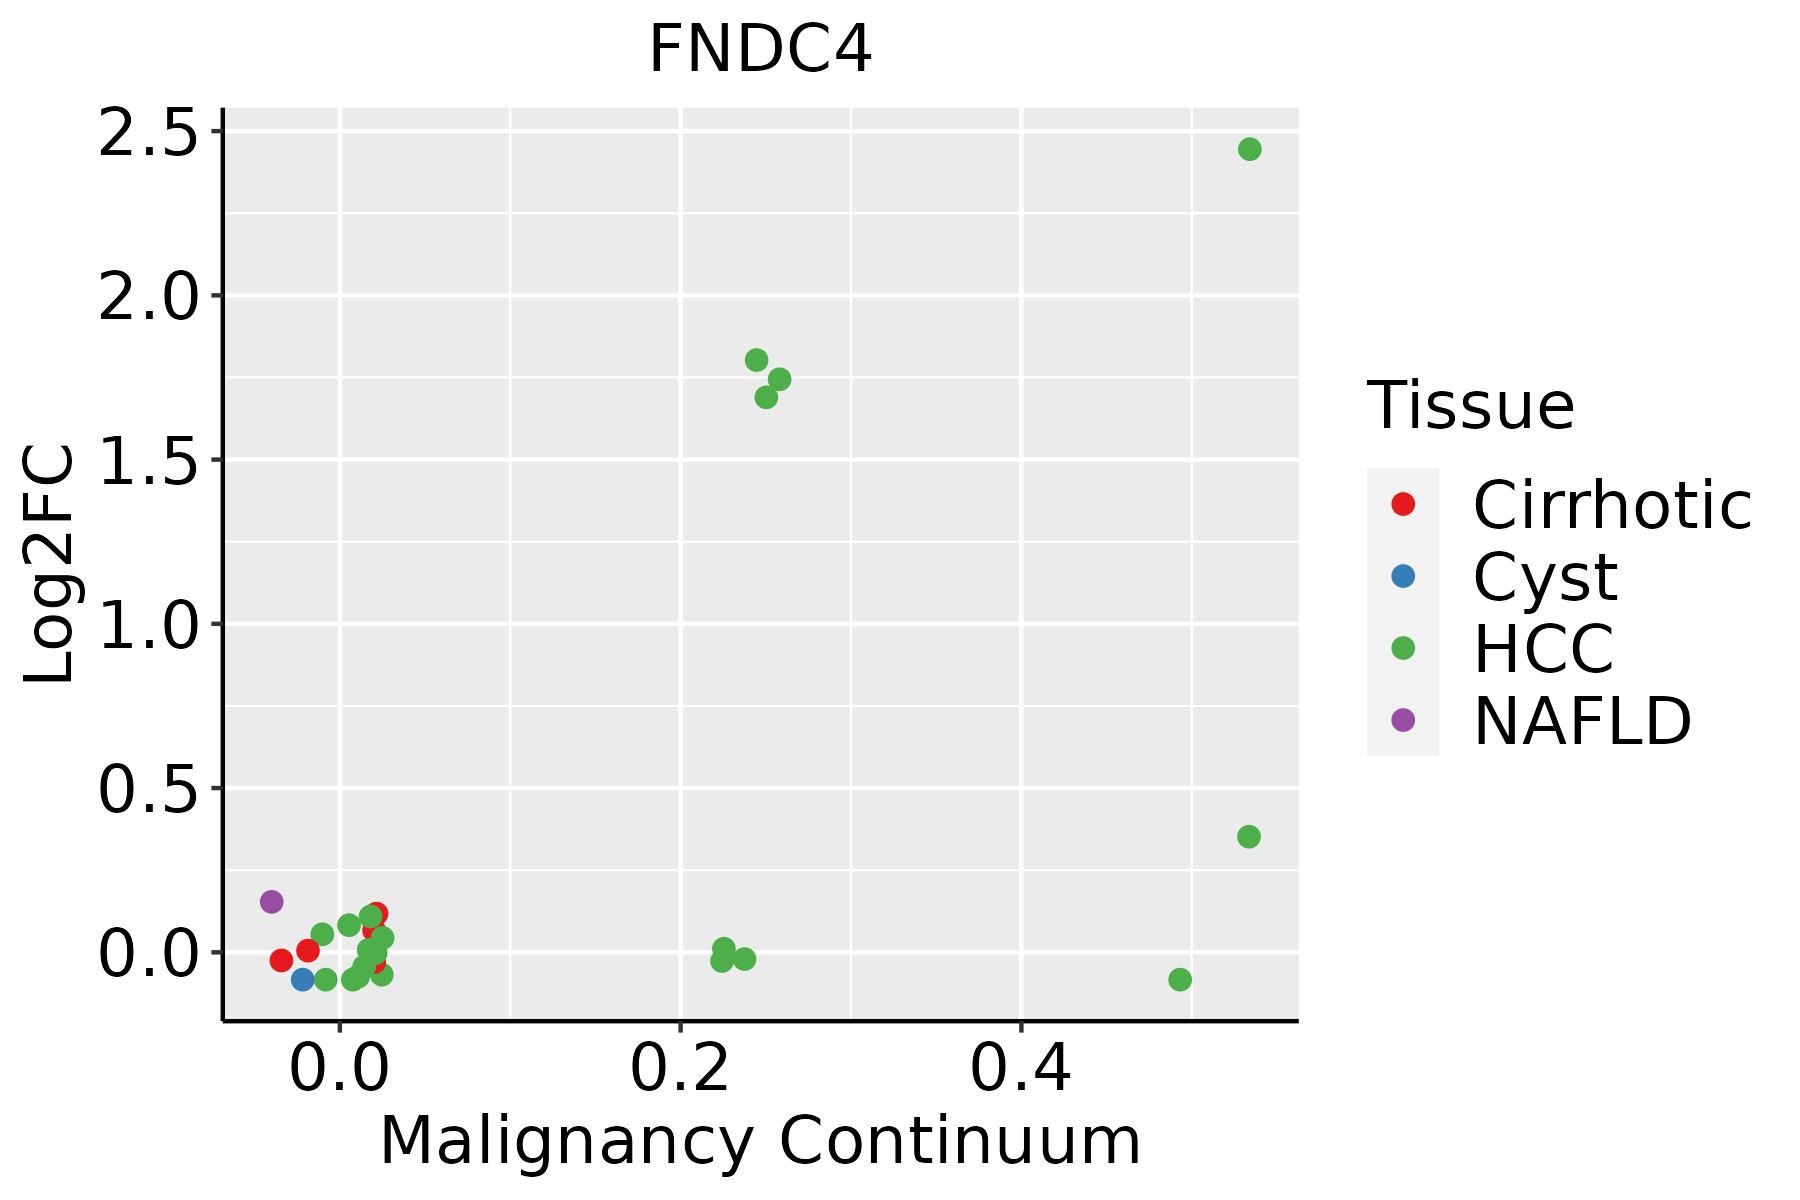 | HCC: Hepatocellular carcinoma |
| NAFLD: Non-alcoholic fatty liver disease | ||
| Thyroid | 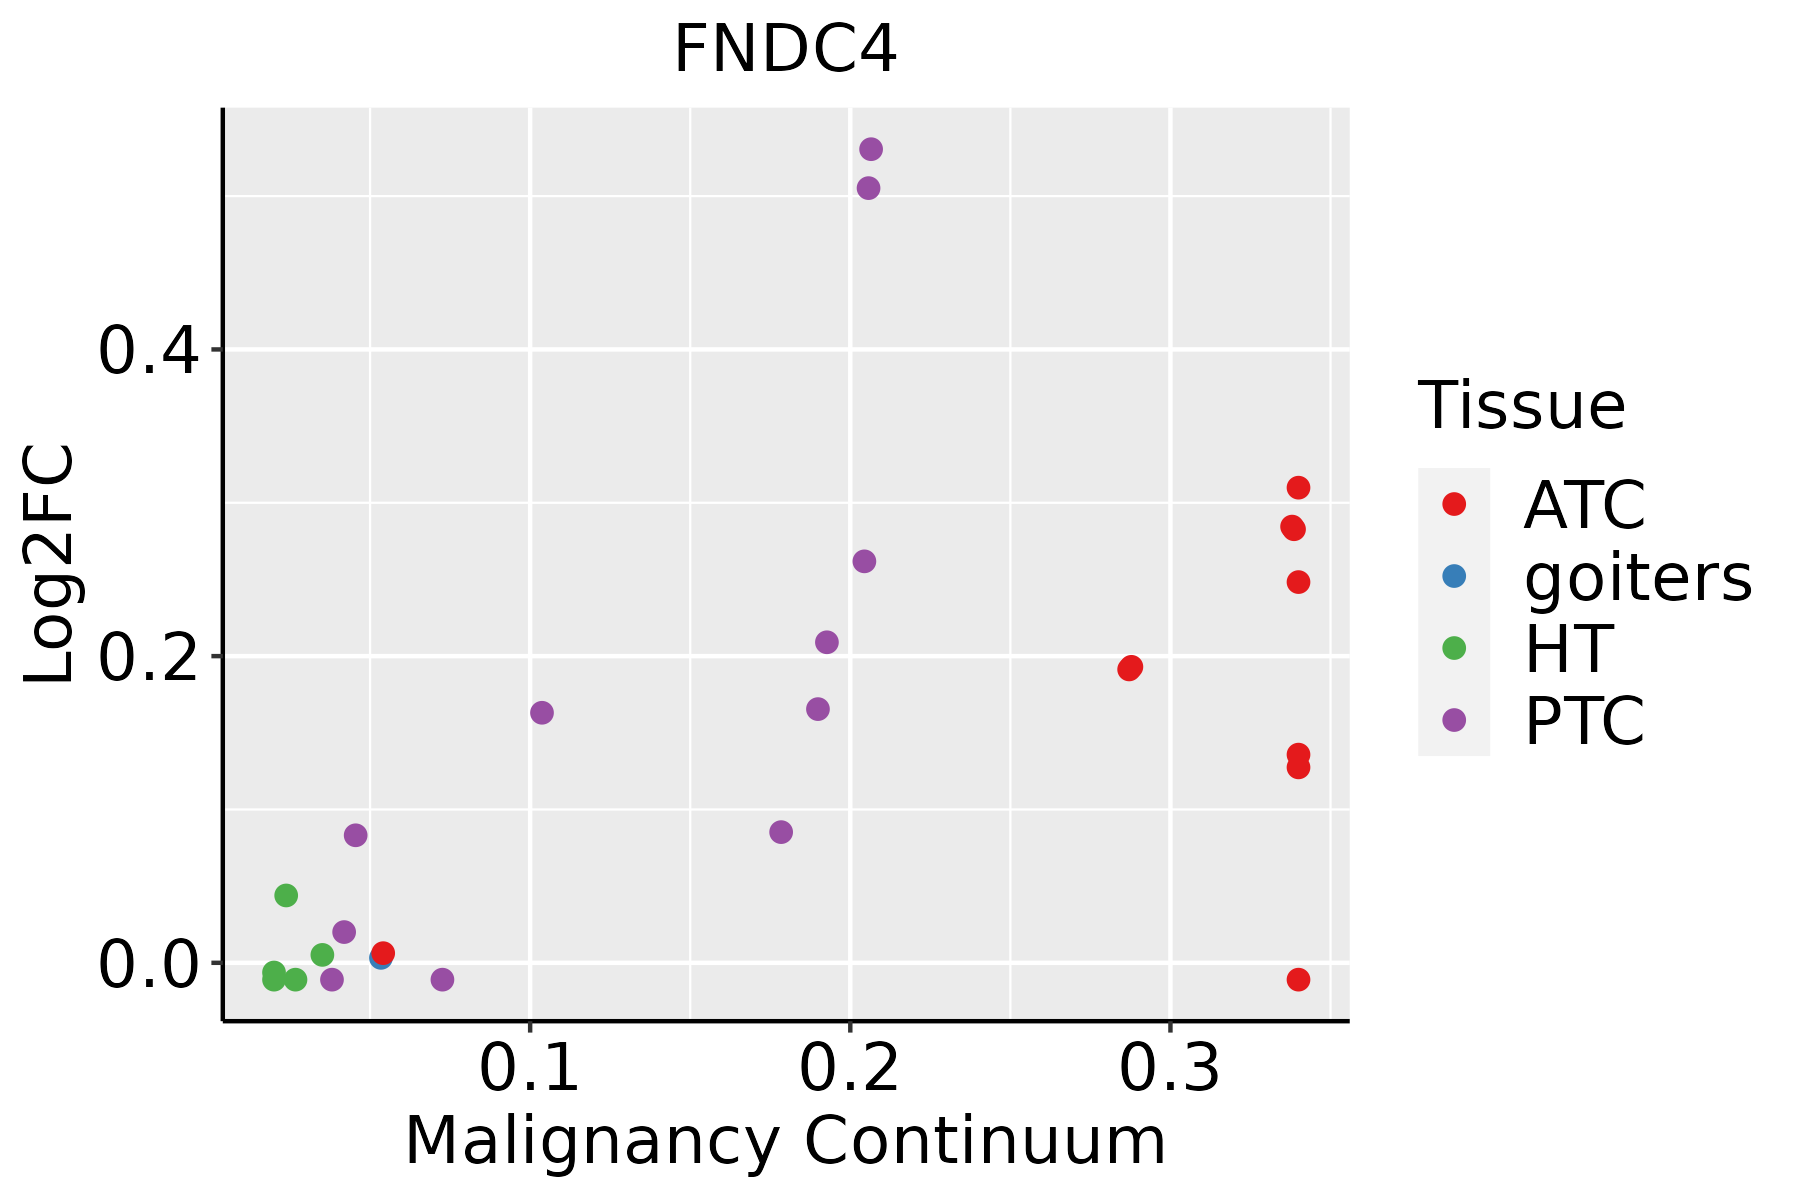 | ATC: Anaplastic thyroid cancer |
| HT: Hashimoto's thyroiditis | ||
| PTC: Papillary thyroid cancer |
| ∗log2FC in expression of this searched gene in stem-like cells from each diseased tissue sample relative to stem-like cells in normal samples in each tissue plotted against the malignancy continuum. Samples are colored based on if they are from different disease stage. |
Top |
Malignant transformation related pathway analysis |
| Find out the enriched GO biological processes and KEGG pathways involved in transition from healthy to precancer to cancer |
| Tissue | Disease Stage | Enriched GO biological Processes |
| Colorectum | AD |  |
| Colorectum | SER |  |
| Colorectum | MSS |  |
| Colorectum | MSI-H |  |
| Colorectum | FAP |  |
| ∗Top 15 enriched GO BP terms are showed in the bar plot of each disease state in each tissue. Each row represents a significant GO biological process which is colored according to the -log10(p.adjust). |
| Page: 1 2 3 4 5 6 7 8 9 |
| GO ID | Tissue | Disease Stage | Description | Gene Ratio | Bg Ratio | pvalue | p.adjust | Count |
| GO:00715599 | Esophagus | ESCC | response to transforming growth factor beta | 157/8552 | 256/18723 | 2.95e-07 | 4.23e-06 | 157 |
| GO:007155921 | Liver | HCC | response to transforming growth factor beta | 141/7958 | 256/18723 | 3.08e-05 | 3.16e-04 | 141 |
| GO:007155919 | Thyroid | PTC | response to transforming growth factor beta | 131/5968 | 256/18723 | 9.20e-11 | 3.17e-09 | 131 |
| GO:007155925 | Thyroid | ATC | response to transforming growth factor beta | 142/6293 | 256/18723 | 4.30e-13 | 1.94e-11 | 142 |
| Page: 1 |
| Pathway ID | Tissue | Disease Stage | Description | Gene Ratio | Bg Ratio | pvalue | p.adjust | qvalue | Count |
| Page: 1 |
Top |
Cell-cell communication analysis |
| Identification of potential cell-cell interactions between two cell types and their ligand-receptor pairs for different disease states |
| Ligand | Receptor | LRpair | Pathway | Tissue | Disease Stage |
| Page: 1 |
Top |
Single-cell gene regulatory network inference analysis |
| Find out the significant the regulons (TFs) and the target genes of each regulon across cell types for different disease states |
| TF | Cell Type | Tissue | Disease Stage | Target Gene | RSS | Regulon Activity |
| ∗The dot plots of a searched regulon are shown for all cell subpopulations in each disease state of each tissue based on the regulon specific score inferred using pySCENIC and by calculating the average expression. |
| Page: 1 |
Top |
Somatic mutation of malignant transformation related genes |
| Annotation of somatic variants for genes involved in malignant transformation |
| Hugo Symbol | Variant Class | Variant Classification | dbSNP RS | HGVSc | HGVSp | HGVSp Short | SWISSPROT | BIOTYPE | SIFT | PolyPhen | Tumor Sample Barcode | Tissue | Histology | Sex | Age | Stage | Therapy Types | Drugs | Outcome |
| FNDC4 | SNV | Missense_Mutation | novel | c.448N>G | p.Ser150Gly | p.S150G | Q9H6D8 | protein_coding | tolerated(0.19) | benign(0) | TCGA-AC-A8OP-01 | Breast | breast invasive carcinoma | Female | >=65 | I/II | Unknown | Unknown | SD |
| FNDC4 | insertion | Nonsense_Mutation | novel | c.91_92insGTGCACTTCCGAACTCTCAAGGGTTCTGACCGGC | p.Val31GlyfsTer10 | p.V31Gfs*10 | Q9H6D8 | protein_coding | TCGA-AO-A0J7-01 | Breast | breast invasive carcinoma | Female | >=65 | I/II | Chemotherapy | doxorubicin | SD | ||
| FNDC4 | deletion | Frame_Shift_Del | novel | c.340delT | p.Tyr114ThrfsTer70 | p.Y114Tfs*70 | Q9H6D8 | protein_coding | TCGA-D8-A27V-01 | Breast | breast invasive carcinoma | Female | <65 | I/II | Hormone Therapy | tamoxiphen | SD | ||
| FNDC4 | SNV | Missense_Mutation | novel | c.250C>T | p.Arg84Trp | p.R84W | Q9H6D8 | protein_coding | deleterious(0) | probably_damaging(0.977) | TCGA-2W-A8YY-01 | Cervix | cervical & endocervical cancer | Female | <65 | I/II | Chemotherapy | cisplatin | CR |
| FNDC4 | SNV | Missense_Mutation | c.56N>T | p.Ser19Leu | p.S19L | Q9H6D8 | protein_coding | tolerated_low_confidence(0.43) | benign(0.007) | TCGA-JW-A5VL-01 | Cervix | cervical & endocervical cancer | Female | <65 | I/II | Unknown | Unknown | SD | |
| FNDC4 | SNV | Missense_Mutation | c.89N>T | p.Thr30Met | p.T30M | Q9H6D8 | protein_coding | tolerated(0.06) | possibly_damaging(0.749) | TCGA-A6-5661-01 | Colorectum | colon adenocarcinoma | Female | >=65 | I/II | Unknown | Unknown | SD | |
| FNDC4 | SNV | Missense_Mutation | c.245A>G | p.Gln82Arg | p.Q82R | Q9H6D8 | protein_coding | deleterious(0) | benign(0.305) | TCGA-AA-3864-01 | Colorectum | colon adenocarcinoma | Male | >=65 | I/II | Unknown | Unknown | SD | |
| FNDC4 | SNV | Missense_Mutation | c.56C>T | p.Ser19Leu | p.S19L | Q9H6D8 | protein_coding | tolerated_low_confidence(0.43) | benign(0.007) | TCGA-AA-3984-01 | Colorectum | colon adenocarcinoma | Female | <65 | I/II | Unknown | Unknown | SD | |
| FNDC4 | SNV | Missense_Mutation | c.318N>T | p.Trp106Cys | p.W106C | Q9H6D8 | protein_coding | deleterious(0) | probably_damaging(0.999) | TCGA-CK-6746-01 | Colorectum | colon adenocarcinoma | Female | >=65 | I/II | Unknown | Unknown | SD | |
| FNDC4 | SNV | Missense_Mutation | c.565N>T | p.Arg189Cys | p.R189C | Q9H6D8 | protein_coding | deleterious(0) | possibly_damaging(0.609) | TCGA-D5-6923-01 | Colorectum | colon adenocarcinoma | Male | <65 | I/II | Unknown | Unknown | SD |
| Page: 1 2 3 4 |
Top |
Related drugs of malignant transformation related genes |
| Identification of chemicals and drugs interact with genes involved in malignant transfromation |
| (DGIdb 4.0) |
| Entrez ID | Symbol | Category | Interaction Types | Drug Claim Name | Drug Name | PMIDs |
| Page: 1 |

Copyright 2023-Present -The University of Texas Health Science Center at Houston |