
|
|||||
|
 | |
| |
| |
| |
| |
| |
|
Gene: FNDC3B |
Gene summary for FNDC3B |
| Gene information | Species | Human | Gene symbol | FNDC3B | Gene ID | 64778 |
| Gene name | fibronectin type III domain containing 3B | |
| Gene Alias | FAD104 | |
| Cytomap | 3q26.31 | |
| Gene Type | protein-coding | GO ID | GO:0005575 | UniProtAcc | Q53EP0 |
Top |
Malignant transformation analysis |
| Identification of the aberrant gene expression in precancerous and cancerous lesions by comparing the gene expression of stem-like cells in diseased tissues with normal stem cells |
| Entrez ID | Symbol | Replicates | Species | Organ | Tissue | Adj P-value | Log2FC | Malignancy |
| 64778 | FNDC3B | CA_HPV_2 | Human | Cervix | CC | 3.04e-07 | 3.93e-01 | 0.0391 |
| 64778 | FNDC3B | CCI_1 | Human | Cervix | CC | 2.96e-13 | 1.60e+00 | 0.528 |
| 64778 | FNDC3B | CCI_2 | Human | Cervix | CC | 3.41e-22 | 3.21e+00 | 0.5249 |
| 64778 | FNDC3B | CCI_3 | Human | Cervix | CC | 1.24e-39 | 2.52e+00 | 0.516 |
| 64778 | FNDC3B | CCII_1 | Human | Cervix | CC | 7.30e-08 | 5.57e-01 | 0.3249 |
| 64778 | FNDC3B | sample3 | Human | Cervix | CC | 4.63e-04 | 2.09e-01 | 0.1387 |
| 64778 | FNDC3B | T3 | Human | Cervix | CC | 4.24e-06 | 1.69e-01 | 0.1389 |
| 64778 | FNDC3B | HTA11_3410_2000001011 | Human | Colorectum | AD | 4.48e-33 | -7.08e-01 | 0.0155 |
| 64778 | FNDC3B | HTA11_2951_2000001011 | Human | Colorectum | AD | 8.27e-07 | -7.34e-01 | 0.0216 |
| 64778 | FNDC3B | HTA11_347_2000001011 | Human | Colorectum | AD | 6.12e-04 | 4.49e-01 | -0.1954 |
| 64778 | FNDC3B | HTA11_411_2000001011 | Human | Colorectum | SER | 5.03e-03 | 5.09e-01 | -0.2602 |
| 64778 | FNDC3B | HTA11_3361_2000001011 | Human | Colorectum | AD | 1.95e-05 | -6.04e-01 | -0.1207 |
| 64778 | FNDC3B | HTA11_696_2000001011 | Human | Colorectum | AD | 4.25e-03 | -3.21e-01 | -0.1464 |
| 64778 | FNDC3B | HTA11_1391_2000001011 | Human | Colorectum | AD | 1.31e-02 | 4.02e-01 | -0.059 |
| 64778 | FNDC3B | HTA11_5216_2000001011 | Human | Colorectum | SER | 2.25e-07 | -5.09e-01 | -0.1462 |
| 64778 | FNDC3B | HTA11_9341_2000001011 | Human | Colorectum | SER | 2.34e-05 | -5.63e-01 | -0.00410000000000005 |
| 64778 | FNDC3B | HTA11_7862_2000001011 | Human | Colorectum | AD | 1.58e-04 | -4.70e-01 | -0.0179 |
| 64778 | FNDC3B | HTA11_866_3004761011 | Human | Colorectum | AD | 2.41e-11 | -5.21e-01 | 0.096 |
| 64778 | FNDC3B | HTA11_4255_2000001011 | Human | Colorectum | SER | 1.51e-06 | -5.26e-01 | 0.0446 |
| 64778 | FNDC3B | HTA11_8622_2000001021 | Human | Colorectum | SER | 1.50e-12 | -7.89e-01 | 0.0528 |
| Page: 1 2 3 4 5 6 7 8 9 10 11 12 13 14 |
| Tissue | Expression Dynamics | Abbreviation |
| Cervix | 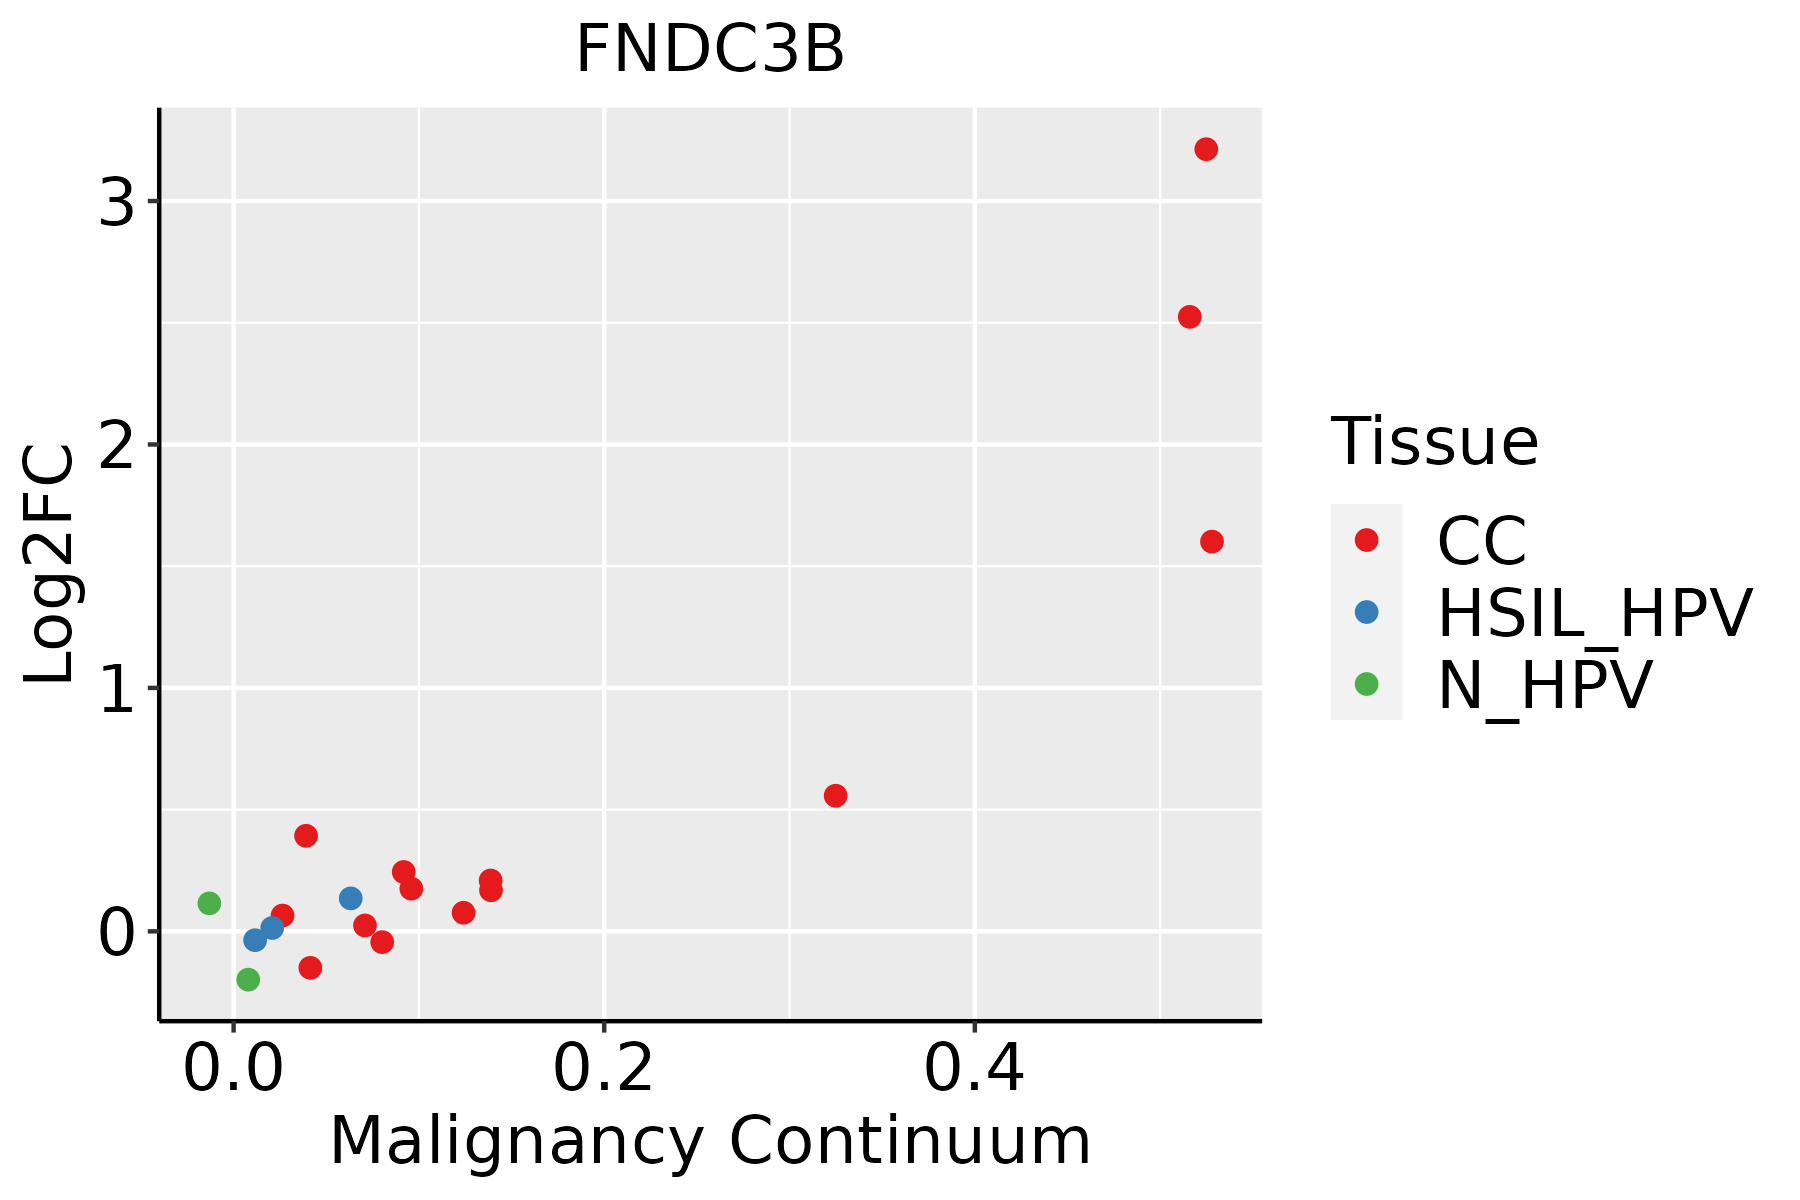 | CC: Cervix cancer |
| HSIL_HPV: HPV-infected high-grade squamous intraepithelial lesions | ||
| N_HPV: HPV-infected normal cervix | ||
| Colorectum (GSE201348) |  | FAP: Familial adenomatous polyposis |
| CRC: Colorectal cancer | ||
| Colorectum (HTA11) |  | AD: Adenomas |
| SER: Sessile serrated lesions | ||
| MSI-H: Microsatellite-high colorectal cancer | ||
| MSS: Microsatellite stable colorectal cancer | ||
| Endometrium | 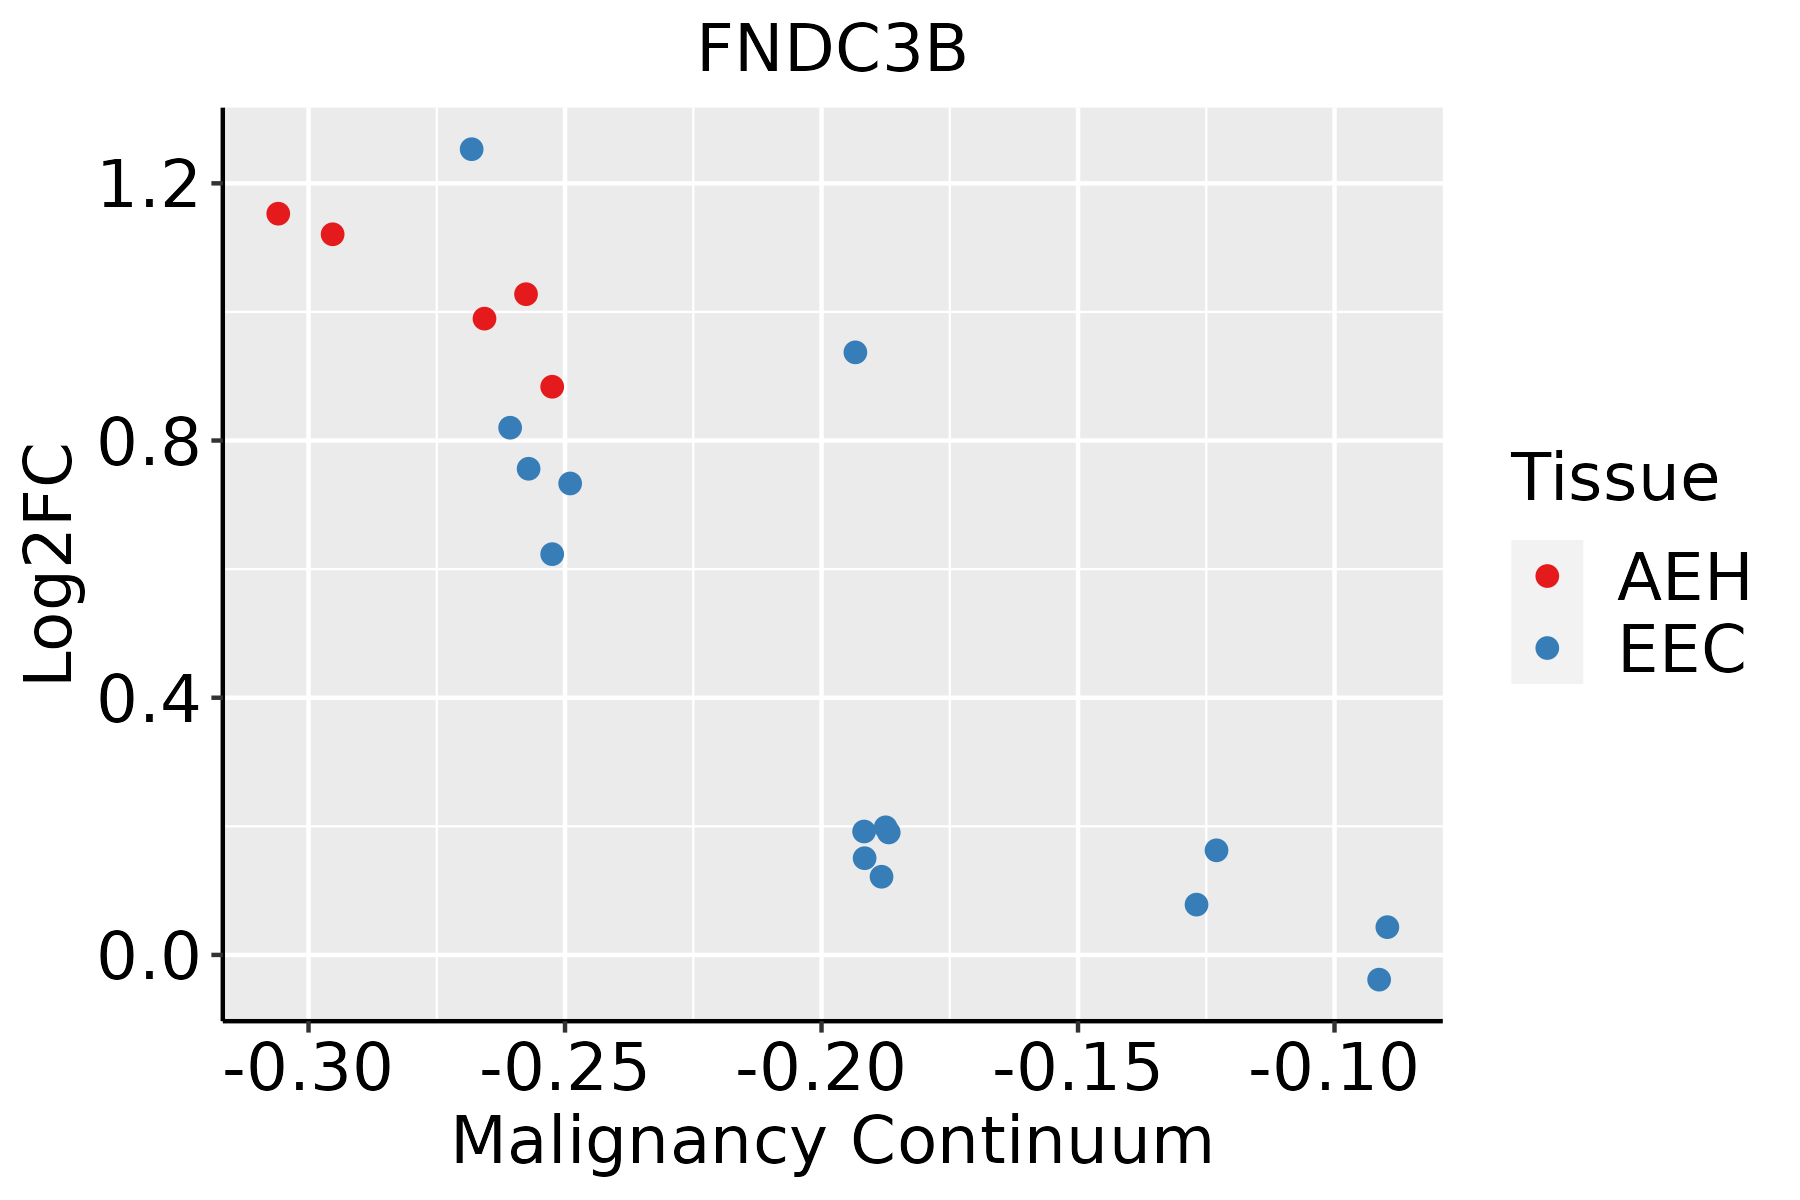 | AEH: Atypical endometrial hyperplasia |
| EEC: Endometrioid Cancer | ||
| Esophagus | 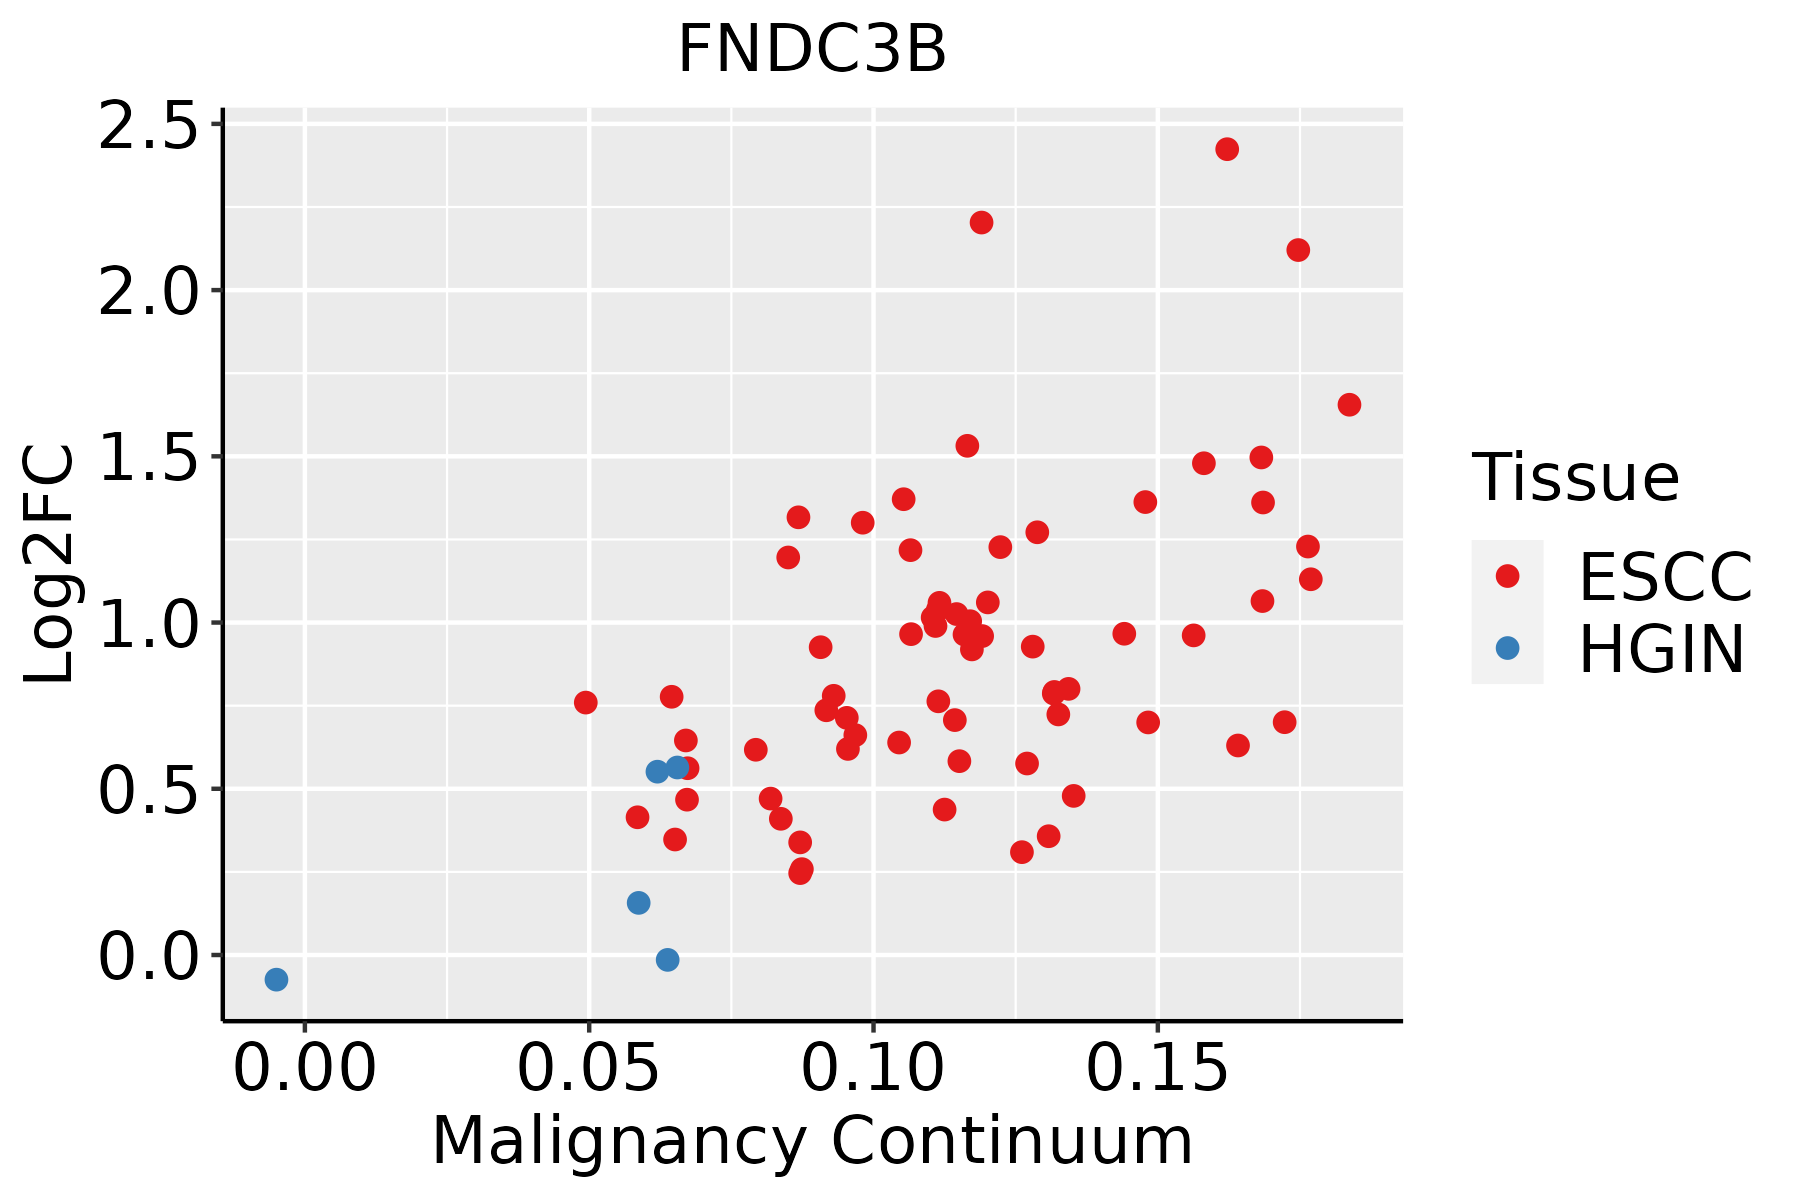 | ESCC: Esophageal squamous cell carcinoma |
| HGIN: High-grade intraepithelial neoplasias | ||
| LGIN: Low-grade intraepithelial neoplasias | ||
| GC |  | CAG: Chronic atrophic gastritis |
| CAG with IM: Chronic atrophic gastritis with intestinal metaplasia | ||
| CSG: Chronic superficial gastritis | ||
| GC: Gastric cancer | ||
| SIM: Severe intestinal metaplasia | ||
| WIM: Wild intestinal metaplasia | ||
| Liver | 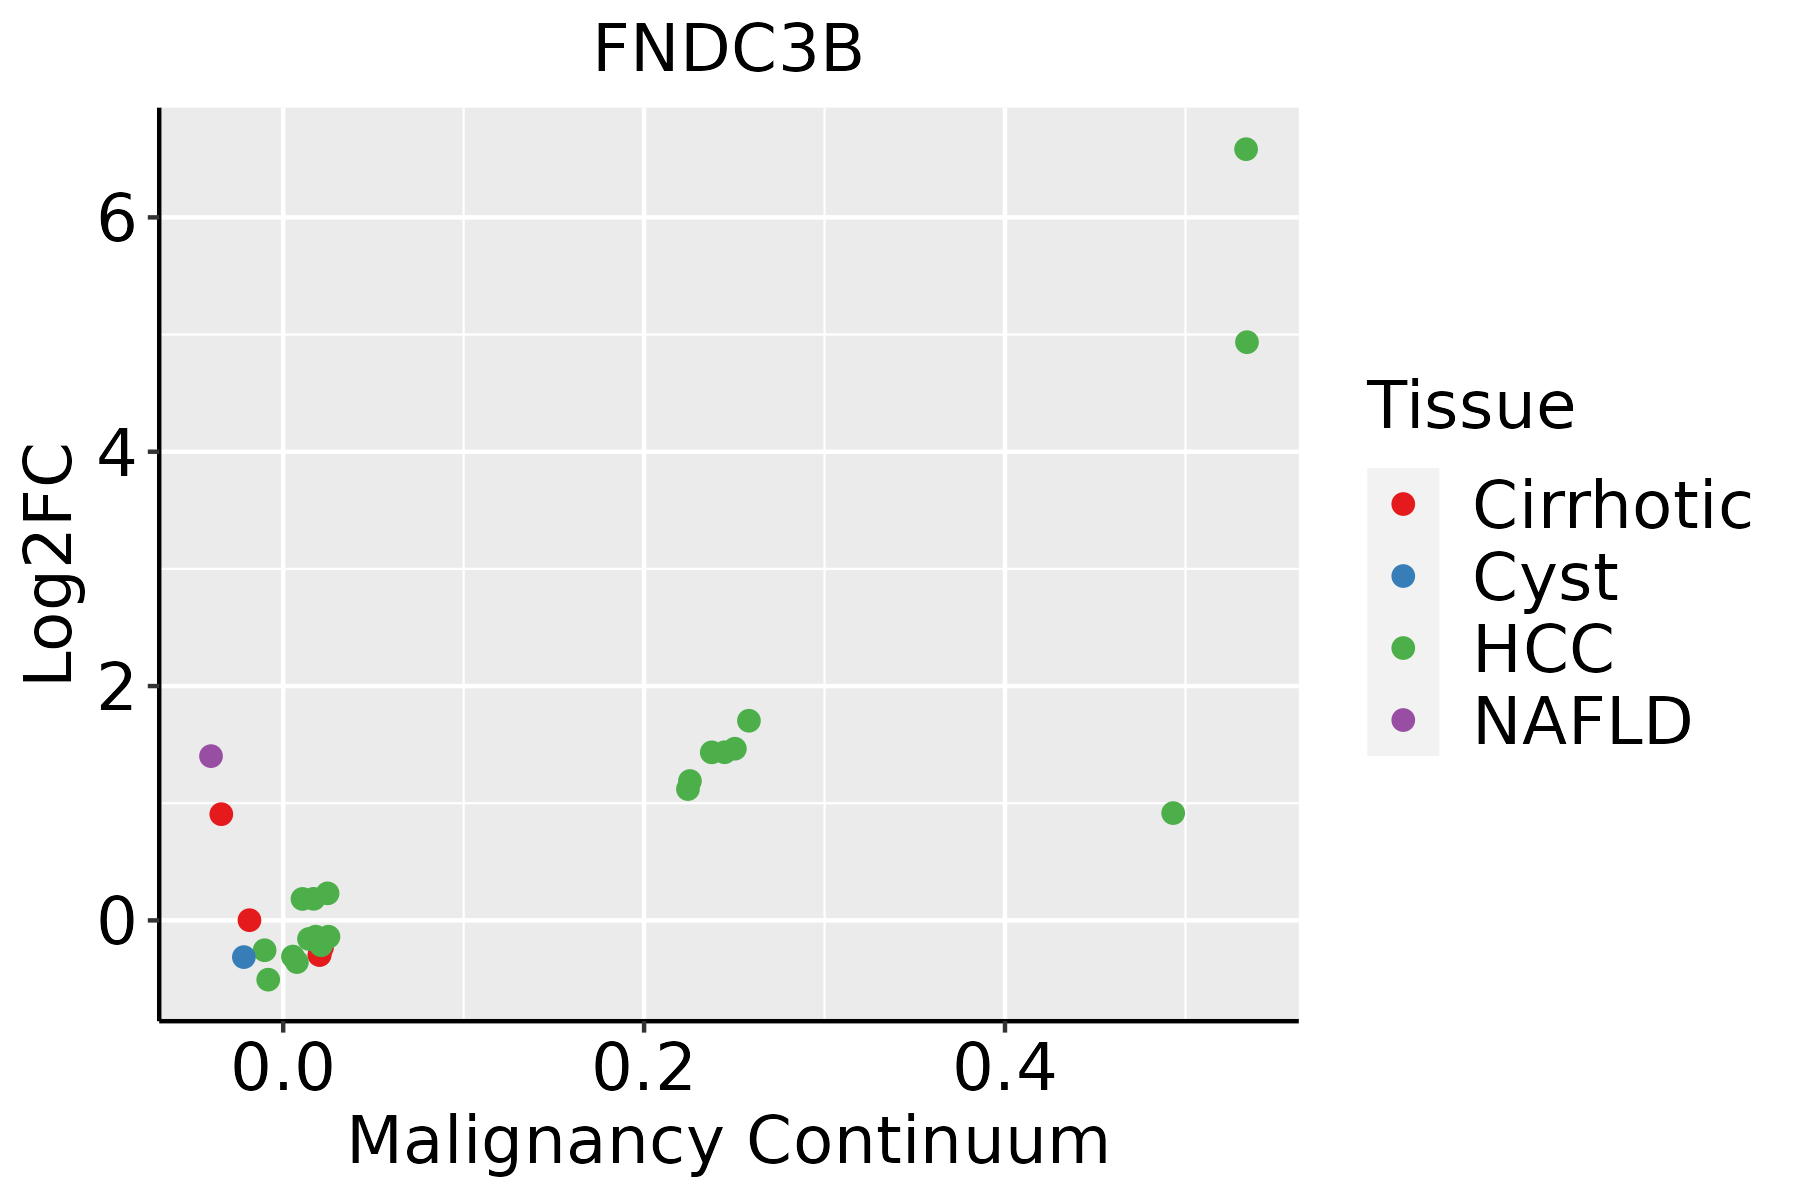 | HCC: Hepatocellular carcinoma |
| NAFLD: Non-alcoholic fatty liver disease | ||
| Lung | 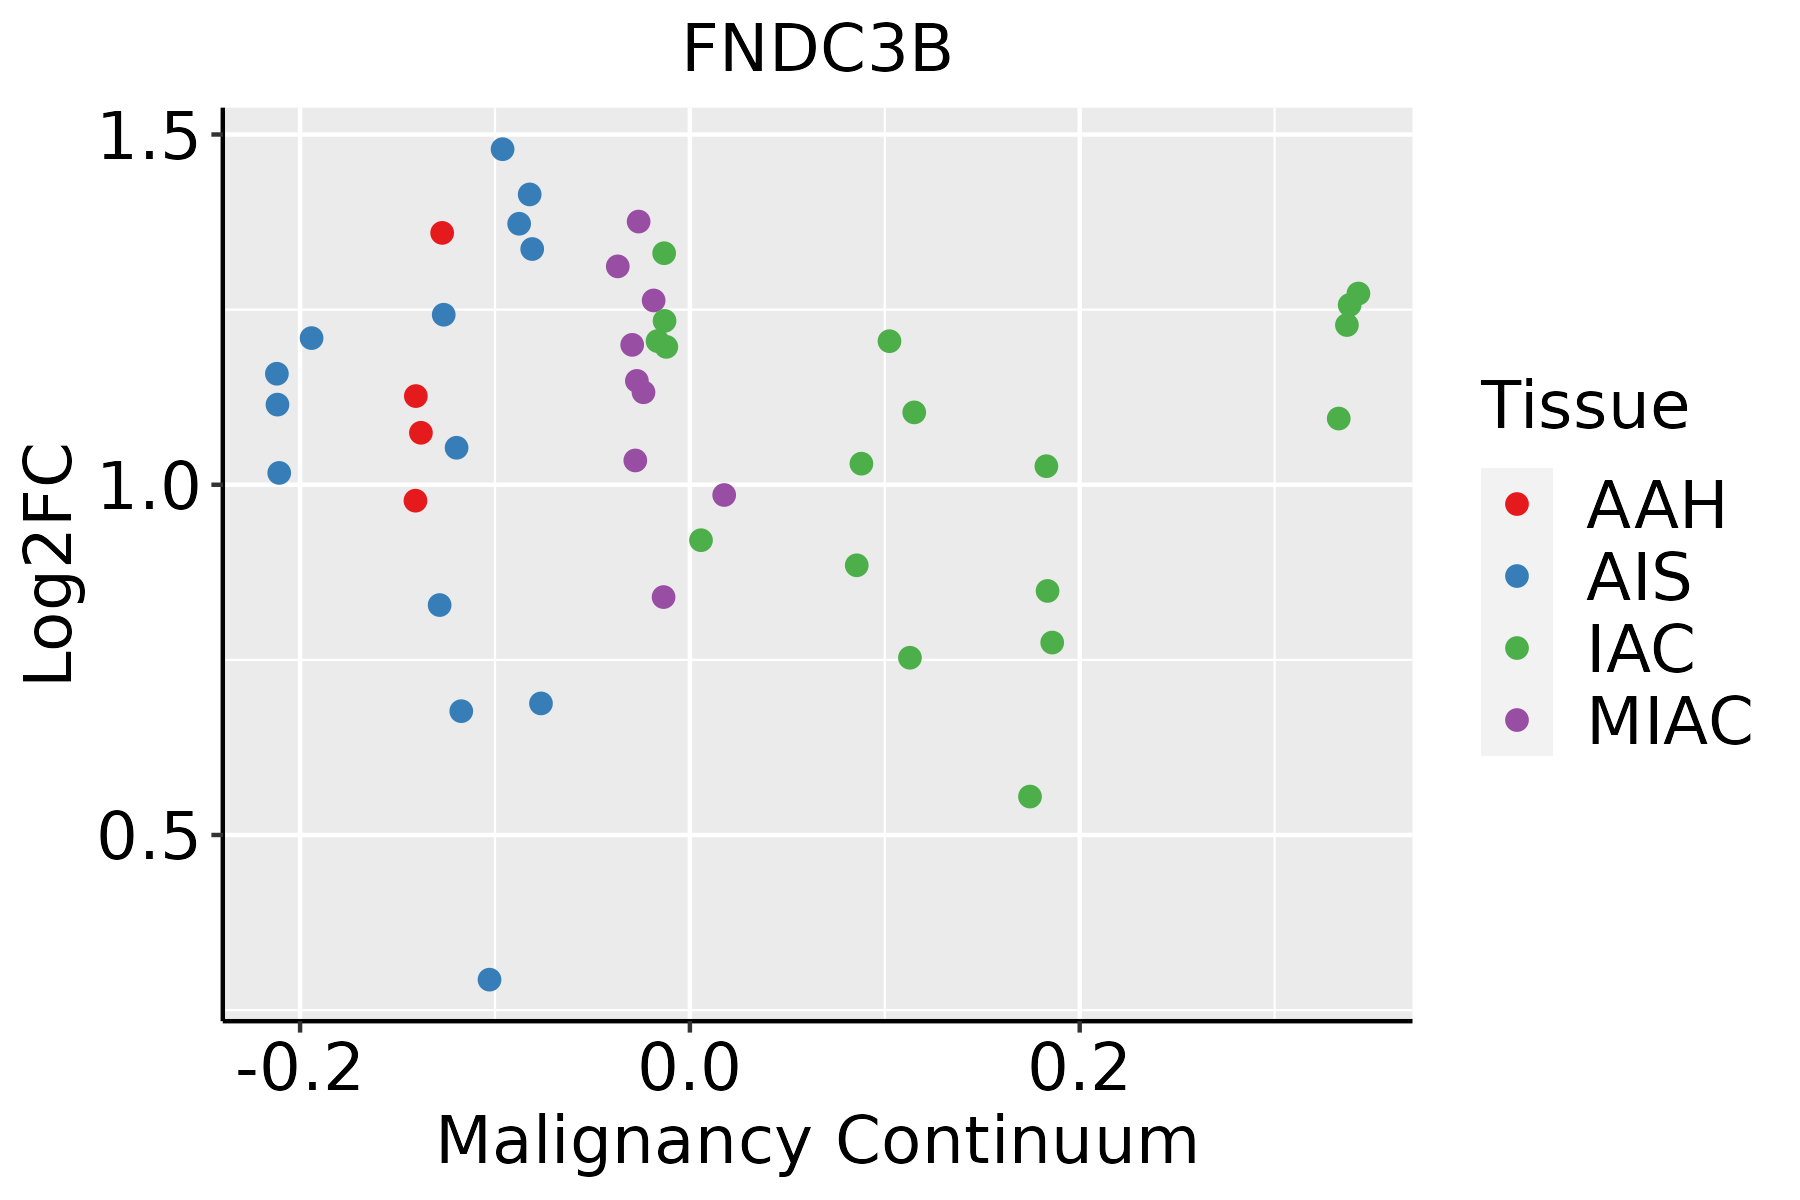 | AAH: Atypical adenomatous hyperplasia |
| AIS: Adenocarcinoma in situ | ||
| IAC: Invasive lung adenocarcinoma | ||
| MIA: Minimally invasive adenocarcinoma | ||
| Oral Cavity | 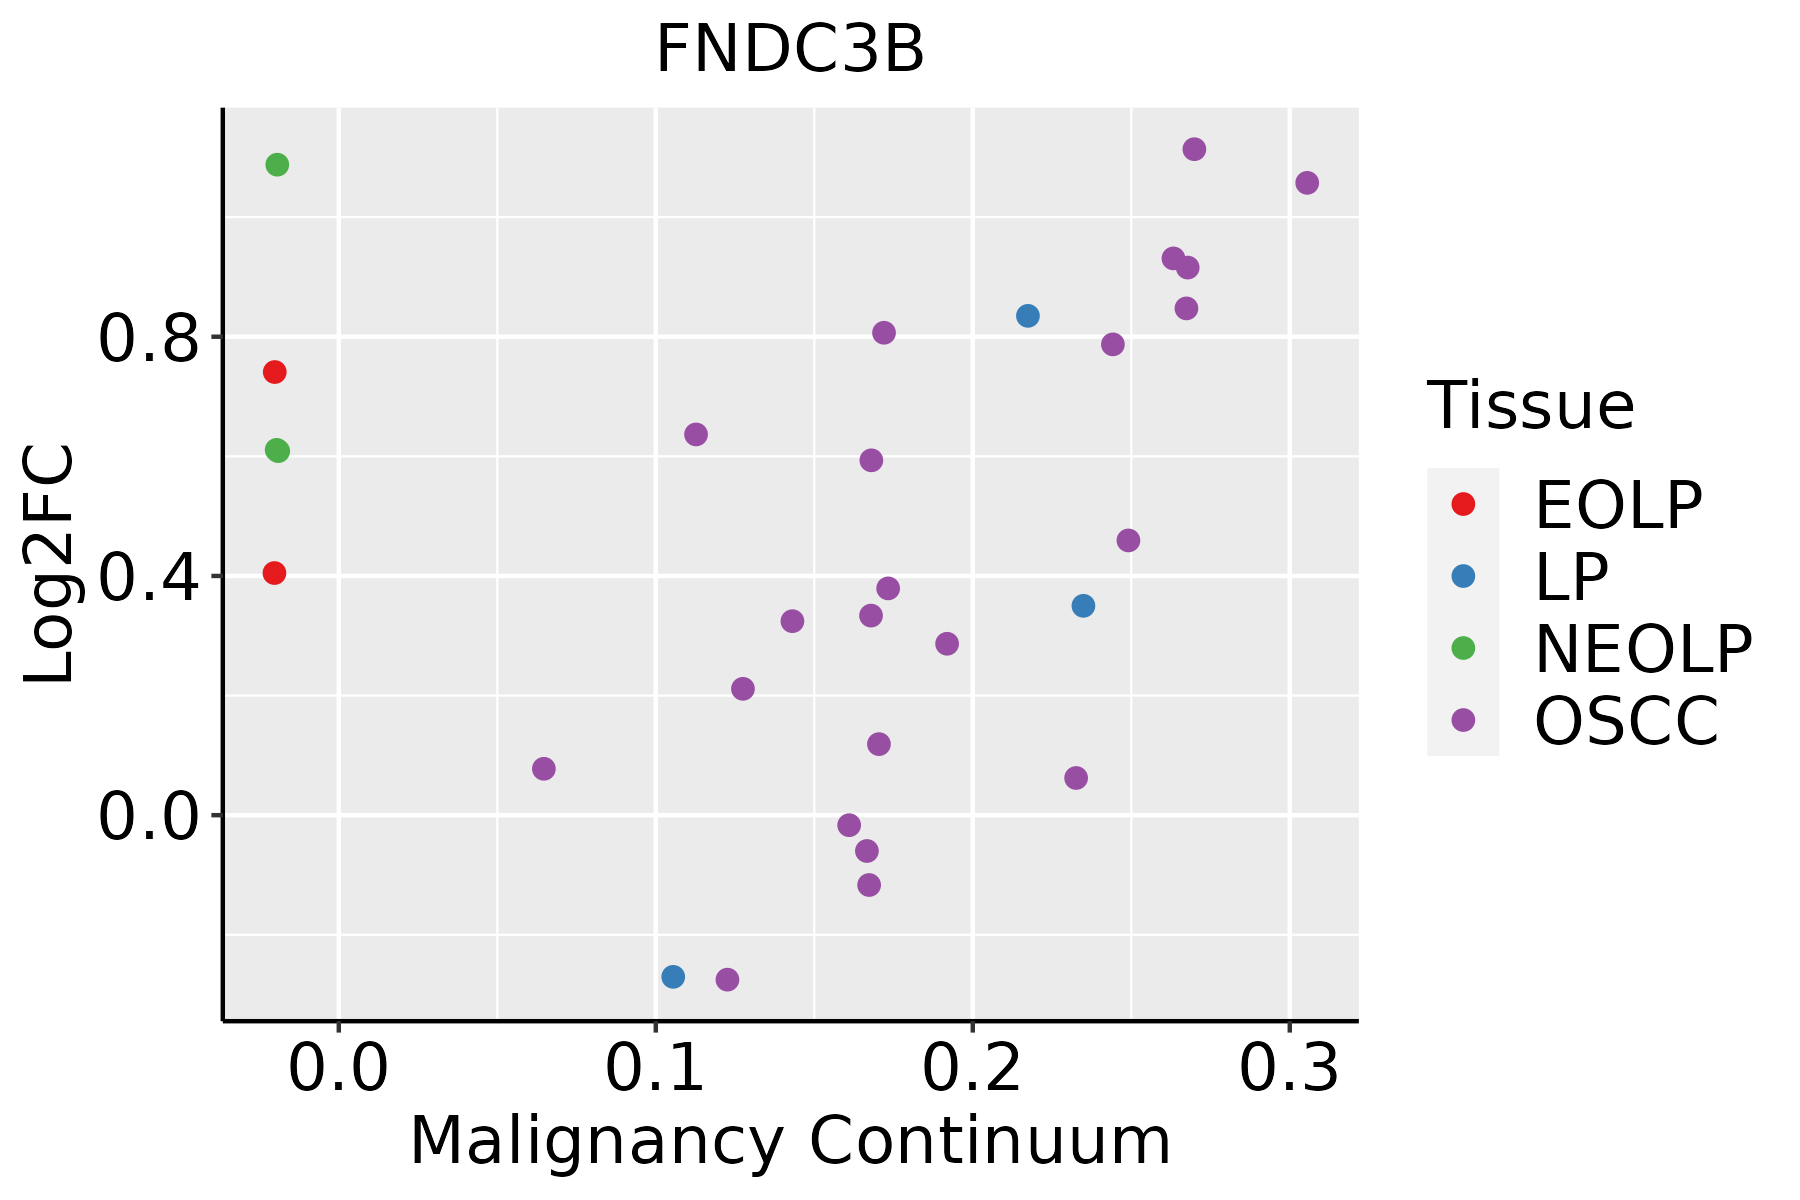 | EOLP: Erosive Oral lichen planus |
| LP: leukoplakia | ||
| NEOLP: Non-erosive oral lichen planus | ||
| OSCC: Oral squamous cell carcinoma | ||
| Prostate | 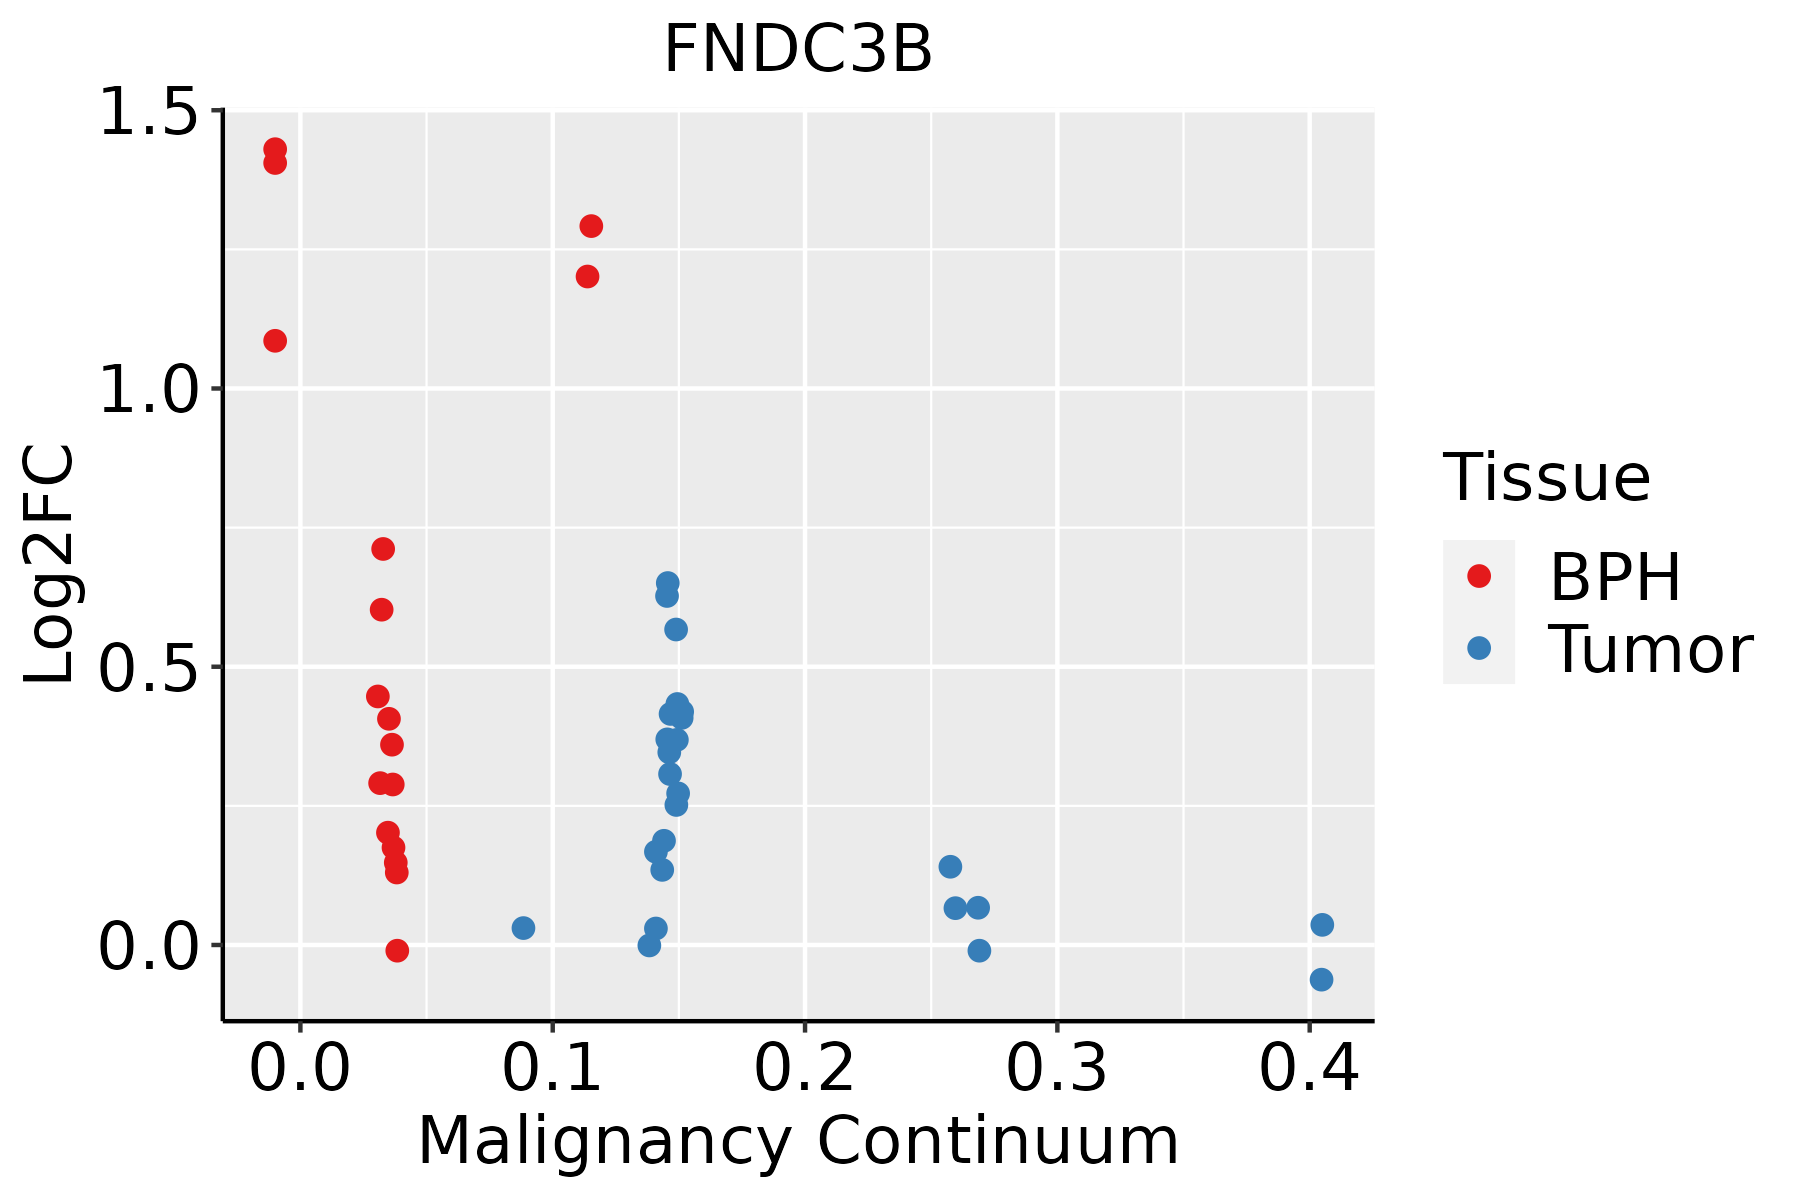 | BPH: Benign Prostatic Hyperplasia |
| Skin |  | AK: Actinic keratosis |
| cSCC: Cutaneous squamous cell carcinoma | ||
| SCCIS:squamous cell carcinoma in situ | ||
| Thyroid | 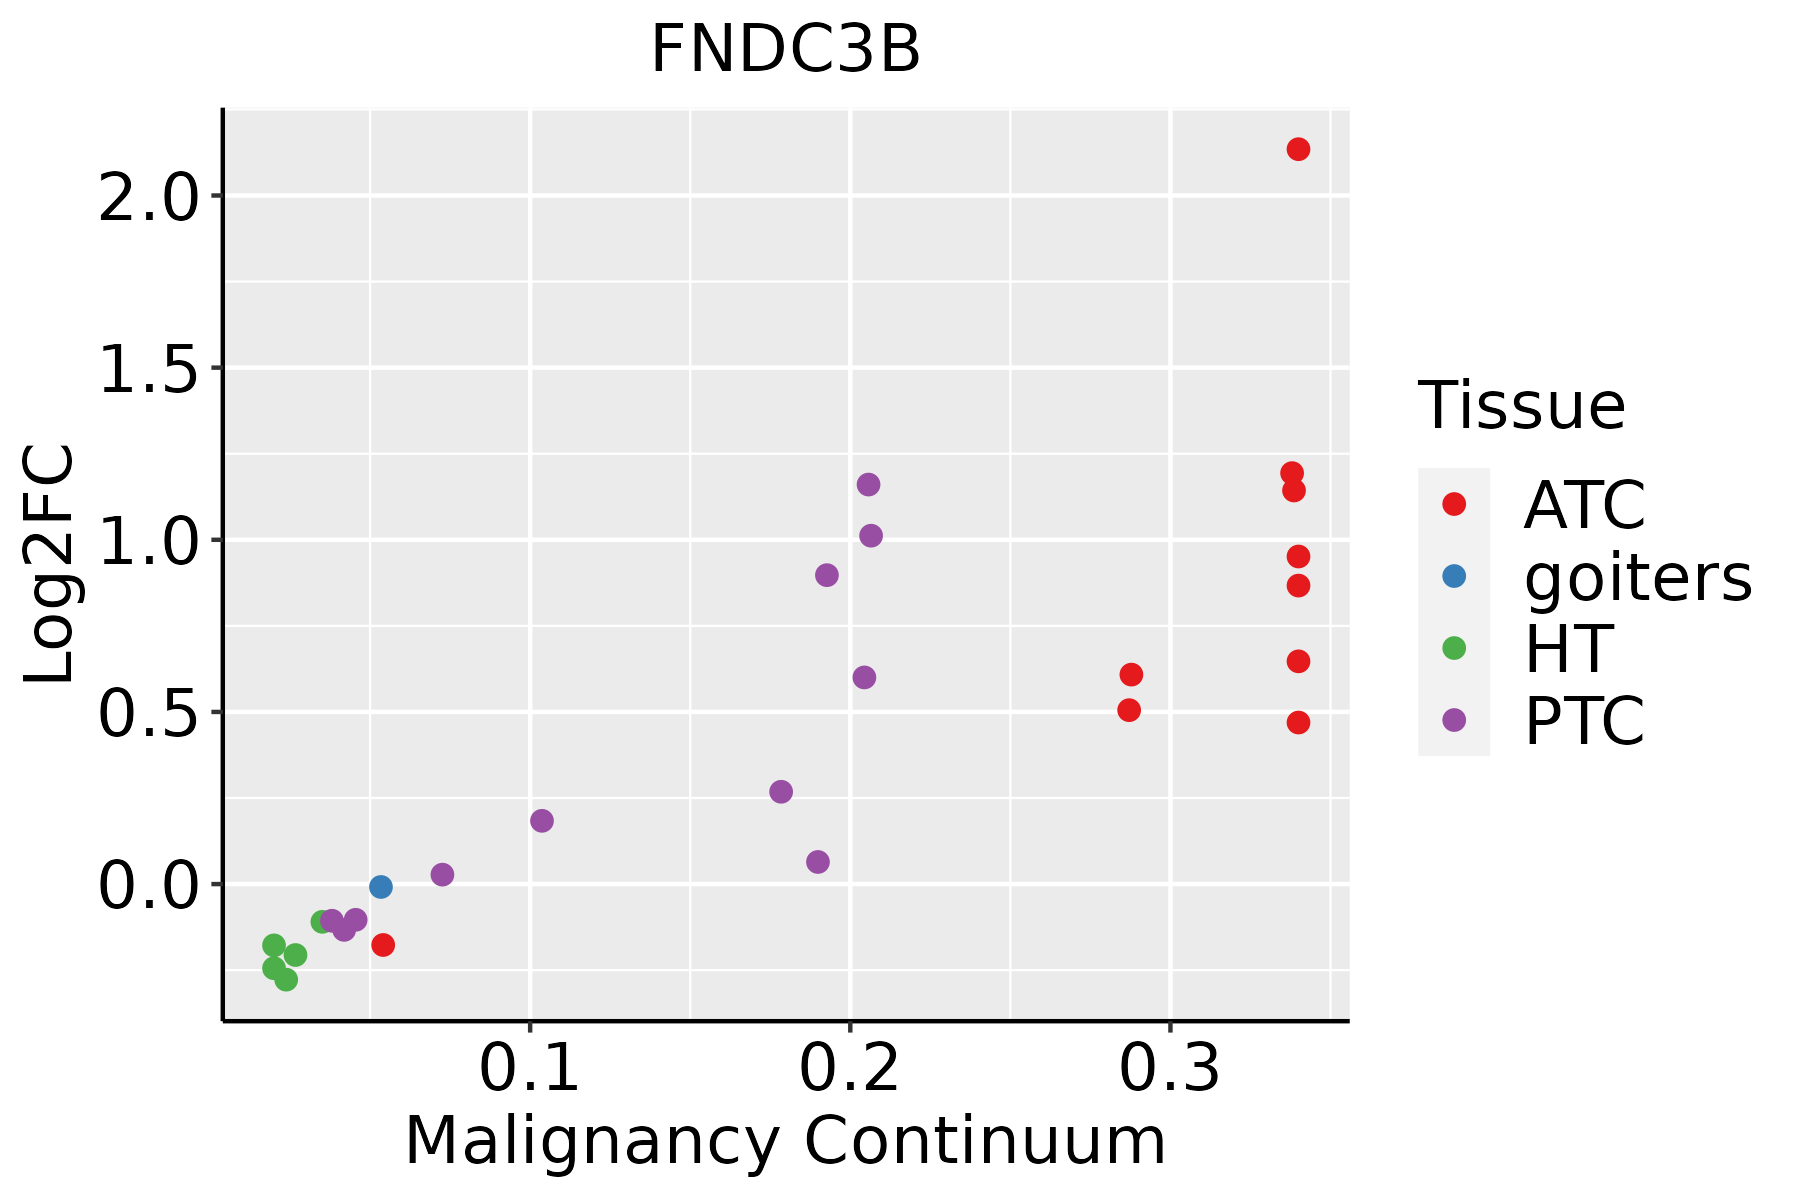 | ATC: Anaplastic thyroid cancer |
| HT: Hashimoto's thyroiditis | ||
| PTC: Papillary thyroid cancer |
| ∗log2FC in expression of this searched gene in stem-like cells from each diseased tissue sample relative to stem-like cells in normal samples in each tissue plotted against the malignancy continuum. Samples are colored based on if they are from different disease stage. |
Top |
Malignant transformation related pathway analysis |
| Find out the enriched GO biological processes and KEGG pathways involved in transition from healthy to precancer to cancer |
| Tissue | Disease Stage | Enriched GO biological Processes |
| Colorectum | AD |  |
| Colorectum | SER |  |
| Colorectum | MSS |  |
| Colorectum | MSI-H |  |
| Colorectum | FAP |  |
| ∗Top 15 enriched GO BP terms are showed in the bar plot of each disease state in each tissue. Each row represents a significant GO biological process which is colored according to the -log10(p.adjust). |
| Page: 1 2 3 4 5 6 7 8 9 |
| GO ID | Tissue | Disease Stage | Description | Gene Ratio | Bg Ratio | pvalue | p.adjust | Count |
| Page: 1 |
| Pathway ID | Tissue | Disease Stage | Description | Gene Ratio | Bg Ratio | pvalue | p.adjust | qvalue | Count |
| Page: 1 |
Top |
Cell-cell communication analysis |
| Identification of potential cell-cell interactions between two cell types and their ligand-receptor pairs for different disease states |
| Ligand | Receptor | LRpair | Pathway | Tissue | Disease Stage |
| Page: 1 |
Top |
Single-cell gene regulatory network inference analysis |
| Find out the significant the regulons (TFs) and the target genes of each regulon across cell types for different disease states |
| TF | Cell Type | Tissue | Disease Stage | Target Gene | RSS | Regulon Activity |
| ∗The dot plots of a searched regulon are shown for all cell subpopulations in each disease state of each tissue based on the regulon specific score inferred using pySCENIC and by calculating the average expression. |
| Page: 1 |
Top |
Somatic mutation of malignant transformation related genes |
| Annotation of somatic variants for genes involved in malignant transformation |
| Hugo Symbol | Variant Class | Variant Classification | dbSNP RS | HGVSc | HGVSp | HGVSp Short | SWISSPROT | BIOTYPE | SIFT | PolyPhen | Tumor Sample Barcode | Tissue | Histology | Sex | Age | Stage | Therapy Types | Drugs | Outcome |
| FNDC3B | SNV | Missense_Mutation | c.2485N>T | p.Pro829Ser | p.P829S | Q53EP0 | protein_coding | deleterious(0.02) | possibly_damaging(0.823) | TCGA-A8-A09A-01 | Breast | breast invasive carcinoma | Female | <65 | I/II | Hormone Therapy | tamoxiphen | SD | |
| FNDC3B | SNV | Missense_Mutation | c.1333N>T | p.Met445Leu | p.M445L | Q53EP0 | protein_coding | tolerated(0.46) | benign(0.003) | TCGA-AC-A23H-01 | Breast | breast invasive carcinoma | Female | >=65 | I/II | Unknown | Unknown | PD | |
| FNDC3B | SNV | Missense_Mutation | c.3057N>T | p.Arg1019Ser | p.R1019S | Q53EP0 | protein_coding | deleterious(0) | possibly_damaging(0.823) | TCGA-B6-A0RT-01 | Breast | breast invasive carcinoma | Female | <65 | III/IV | Unknown | Unknown | SD | |
| FNDC3B | SNV | Missense_Mutation | c.115A>G | p.Ile39Val | p.I39V | Q53EP0 | protein_coding | tolerated(0.07) | benign(0.311) | TCGA-BH-A0HO-01 | Breast | breast invasive carcinoma | Female | <65 | I/II | Chemotherapy | cyclophosphamide | SD | |
| FNDC3B | SNV | Missense_Mutation | rs762666819 | c.3547N>G | p.Ile1183Val | p.I1183V | Q53EP0 | protein_coding | tolerated(0.08) | benign(0.091) | TCGA-BH-A18G-01 | Breast | breast invasive carcinoma | Female | >=65 | I/II | Unknown | Unknown | SD |
| FNDC3B | SNV | Missense_Mutation | c.2338N>A | p.Asp780Asn | p.D780N | Q53EP0 | protein_coding | tolerated(1) | benign(0.003) | TCGA-E2-A14V-01 | Breast | breast invasive carcinoma | Female | <65 | I/II | Chemotherapy | cyclophosphamide | SD | |
| FNDC3B | SNV | Missense_Mutation | novel | c.1415N>C | p.Gly472Ala | p.G472A | Q53EP0 | protein_coding | deleterious(0.05) | benign(0.024) | TCGA-UU-A93S-01 | Breast | breast invasive carcinoma | Female | <65 | III/IV | Unknown | Unknown | PD |
| FNDC3B | insertion | Nonsense_Mutation | novel | c.2737_2738insAATAAAT | p.Thr913LysfsTer2 | p.T913Kfs*2 | Q53EP0 | protein_coding | TCGA-AC-A3QQ-01 | Breast | breast invasive carcinoma | Female | <65 | I/II | Unknown | Unknown | SD | ||
| FNDC3B | insertion | Nonsense_Mutation | novel | c.3602_3603insAAAATGTCAGCTGCATTTCTAGTCAGTGCCTTATCTC | p.Phe1201LeufsTer8 | p.F1201Lfs*8 | Q53EP0 | protein_coding | TCGA-AQ-A04J-01 | Breast | breast invasive carcinoma | Female | <65 | I/II | Chemotherapy | cytoxan | SD | ||
| FNDC3B | deletion | Frame_Shift_Del | novel | c.396delN | p.Phe133LeufsTer63 | p.F133Lfs*63 | Q53EP0 | protein_coding | TCGA-EW-A2FV-01 | Breast | breast invasive carcinoma | Female | <65 | III/IV | Chemotherapy | docetaxel | SD |
| Page: 1 2 3 4 5 6 7 8 9 10 11 12 13 |
Top |
Related drugs of malignant transformation related genes |
| Identification of chemicals and drugs interact with genes involved in malignant transfromation |
| (DGIdb 4.0) |
| Entrez ID | Symbol | Category | Interaction Types | Drug Claim Name | Drug Name | PMIDs |
| Page: 1 |

Copyright 2023-Present -The University of Texas Health Science Center at Houston |