Schematic overview of the cellular and molecular mechanisms involved in the cancer progression, including the proposed cellular and molecular mechanisms in cancer cells trajectory. AT1: alveolar type 1 cells; AT2: alveolar type 2 cells; AAH: atypical adenomatous hyperplasia; AIS: adenocarcinoma in situ; MIA: minimally invasive adenocarcinoma; IA: invasive adenocarcinoma; EMT: epithelial-mesenchymal transition

Home

Download

Statistics

Help

Contact

Center for Computational Systems Medicine
leaf

Gene summary

leaf

Malignant transformation analysis

leaf

Malignant transformation related pathway analysis

leaf

Cell-cell communication analysis

leaf

Single-cell gene regulatory network inference analysis

leaf

Somatic mutation of malignant transformation related genes

leaf

Related drugs of malignant transformation related genes

Gene: FNDC3A

Gene summary for FNDC3A

check button Gene summary.

Gene informationSpeciesHuman
Gene symbol

FNDC3A

Gene ID

22862

Gene namefibronectin type III domain containing 3A
Gene AliasFNDC3
Cytomap13q14.2
Gene Typeprotein-coding
GO ID

GO:0000003

UniProtAcc

A0A024RDT9


Top

Malignant transformation analysis

check button Identification of the aberrant gene expression in precancerous and cancerous lesions by comparing the gene expression of stem-like cells in diseased tissues with normal stem cells
check button Malignant transformation involving gene list.
Entrez IDSymbolReplicatesSpeciesOrganTissueAdj P-valueLog2FCMalignancy
22862FNDC3AHTA11_3410_2000001011HumanColorectumAD3.01e-13-5.09e-010.0155
22862FNDC3AHTA11_2487_2000001011HumanColorectumSER1.95e-04-4.79e-01-0.1808
22862FNDC3AHTA11_3361_2000001011HumanColorectumAD1.12e-06-4.74e-01-0.1207
22862FNDC3AHTA11_866_2000001011HumanColorectumAD8.41e-03-3.13e-01-0.1001
22862FNDC3AHTA11_5212_2000001011HumanColorectumAD4.19e-04-7.19e-01-0.2061
22862FNDC3AHTA11_7862_2000001011HumanColorectumAD4.94e-02-4.91e-01-0.0179
22862FNDC3AHTA11_866_3004761011HumanColorectumAD6.27e-04-4.25e-010.096
22862FNDC3AHTA11_8622_2000001021HumanColorectumSER1.90e-04-6.04e-010.0528
22862FNDC3AHTA11_10711_2000001011HumanColorectumAD4.76e-08-5.32e-010.0338
22862FNDC3AHTA11_7696_3000711011HumanColorectumAD9.14e-08-4.49e-010.0674
22862FNDC3AHTA11_6818_2000001021HumanColorectumAD4.86e-03-4.32e-010.0588
22862FNDC3AHTA11_99999965104_69814HumanColorectumMSS1.67e-024.97e-010.281
22862FNDC3AHTA11_99999974143_84620HumanColorectumMSS4.38e-11-4.89e-010.3005
22862FNDC3AA001-C-207HumanColorectumFAP6.14e-05-2.24e-010.1278
22862FNDC3AA015-C-203HumanColorectumFAP1.45e-30-4.47e-01-0.1294
22862FNDC3AA015-C-204HumanColorectumFAP1.37e-06-2.82e-01-0.0228
22862FNDC3AA014-C-040HumanColorectumFAP1.67e-04-2.55e-01-0.1184
22862FNDC3AA002-C-201HumanColorectumFAP3.51e-15-4.41e-010.0324
22862FNDC3AA002-C-203HumanColorectumFAP9.30e-04-1.44e-010.2786
22862FNDC3AA001-C-119HumanColorectumFAP8.49e-11-5.36e-01-0.1557
Page: 1 2 3 4 5 6 7 8 9 10 11 

check button Transcriptomic changes along malignancy continuum.
TissueExpression DynamicsAbbreviation
Colorectum (GSE201348)The image shows the transcriptomic changes along malignancy continuum.log2FC in expression of this searched gene in stem-like cells from each diseased tissue sample relative to stem-like cells in normal samples in each tissue plotted against the malignancy continuum. Samples are colored based on if they are from different disease stage.FAP: Familial adenomatous polyposis
CRC: Colorectal cancer
Colorectum (HTA11)The image shows the transcriptomic changes along malignancy continuum.log2FC in expression of this searched gene in stem-like cells from each diseased tissue sample relative to stem-like cells in normal samples in each tissue plotted against the malignancy continuum. Samples are colored based on if they are from different disease stage.AD: Adenomas
SER: Sessile serrated lesions
MSI-H: Microsatellite-high colorectal cancer
MSS: Microsatellite stable colorectal cancer
EndometriumThe image shows the transcriptomic changes along malignancy continuum.log2FC in expression of this searched gene in stem-like cells from each diseased tissue sample relative to stem-like cells in normal samples in each tissue plotted against the malignancy continuum. Samples are colored based on if they are from different disease stage.
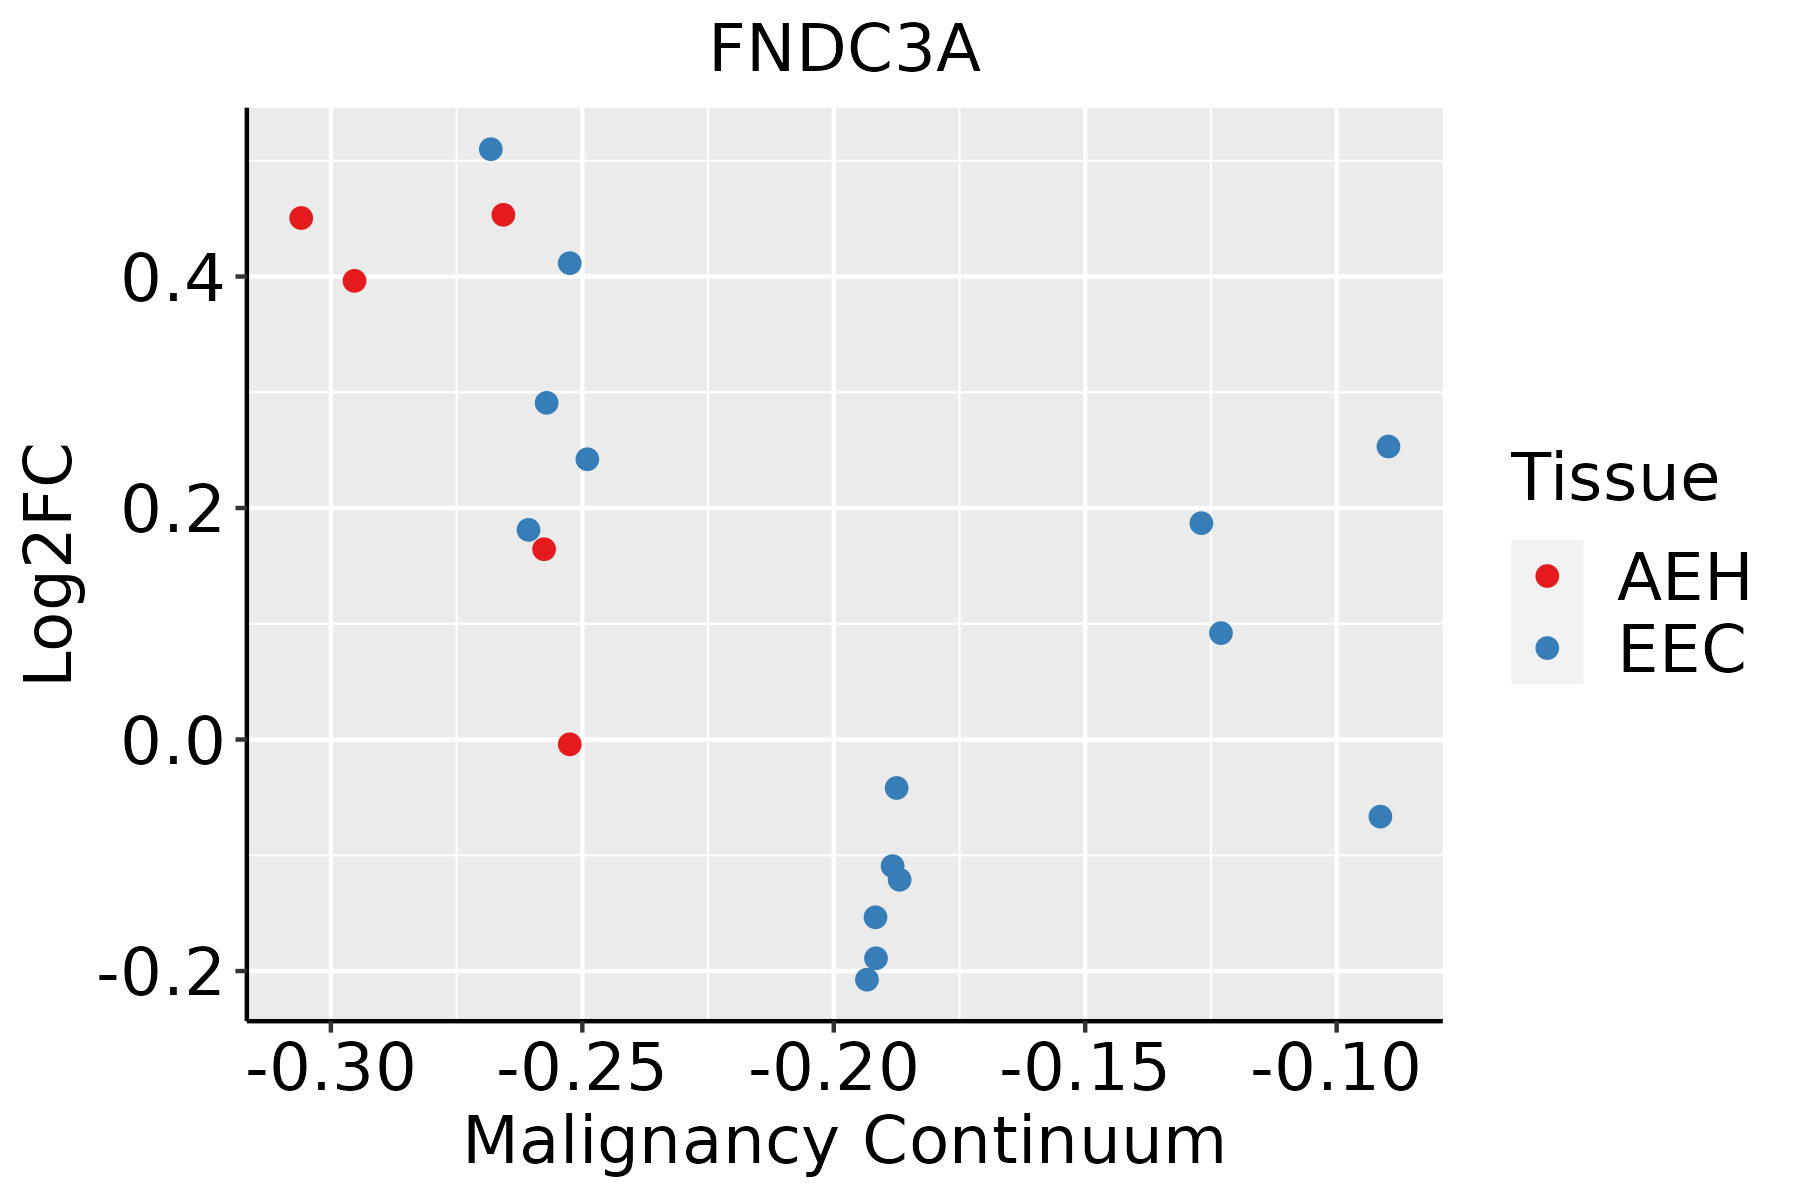
AEH: Atypical endometrial hyperplasia
EEC: Endometrioid Cancer
EsophagusThe image shows the transcriptomic changes along malignancy continuum.log2FC in expression of this searched gene in stem-like cells from each diseased tissue sample relative to stem-like cells in normal samples in each tissue plotted against the malignancy continuum. Samples are colored based on if they are from different disease stage.ESCC: Esophageal squamous cell carcinoma
HGIN: High-grade intraepithelial neoplasias
LGIN: Low-grade intraepithelial neoplasias
LiverThe image shows the transcriptomic changes along malignancy continuum.log2FC in expression of this searched gene in stem-like cells from each diseased tissue sample relative to stem-like cells in normal samples in each tissue plotted against the malignancy continuum. Samples are colored based on if they are from different disease stage.
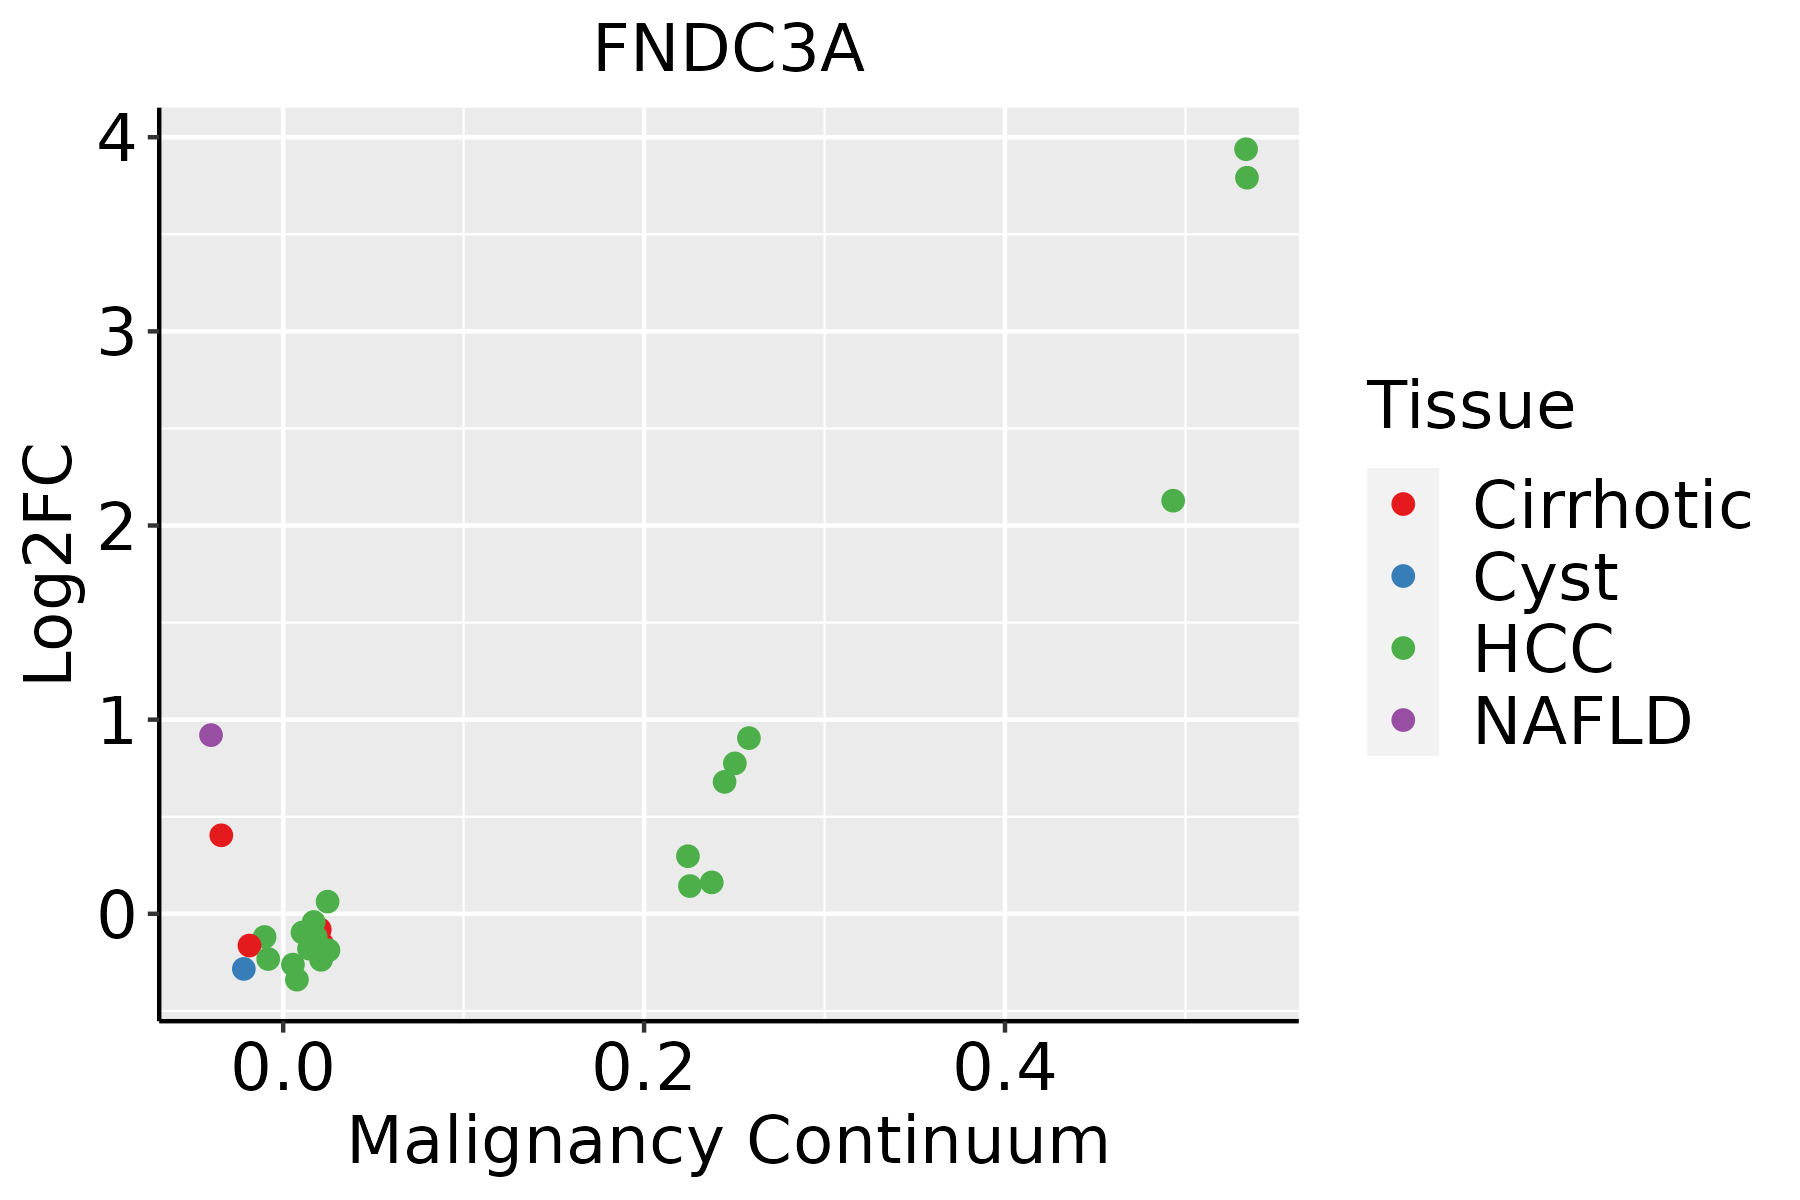
HCC: Hepatocellular carcinoma
NAFLD: Non-alcoholic fatty liver disease
LungThe image shows the transcriptomic changes along malignancy continuum.log2FC in expression of this searched gene in stem-like cells from each diseased tissue sample relative to stem-like cells in normal samples in each tissue plotted against the malignancy continuum. Samples are colored based on if they are from different disease stage.
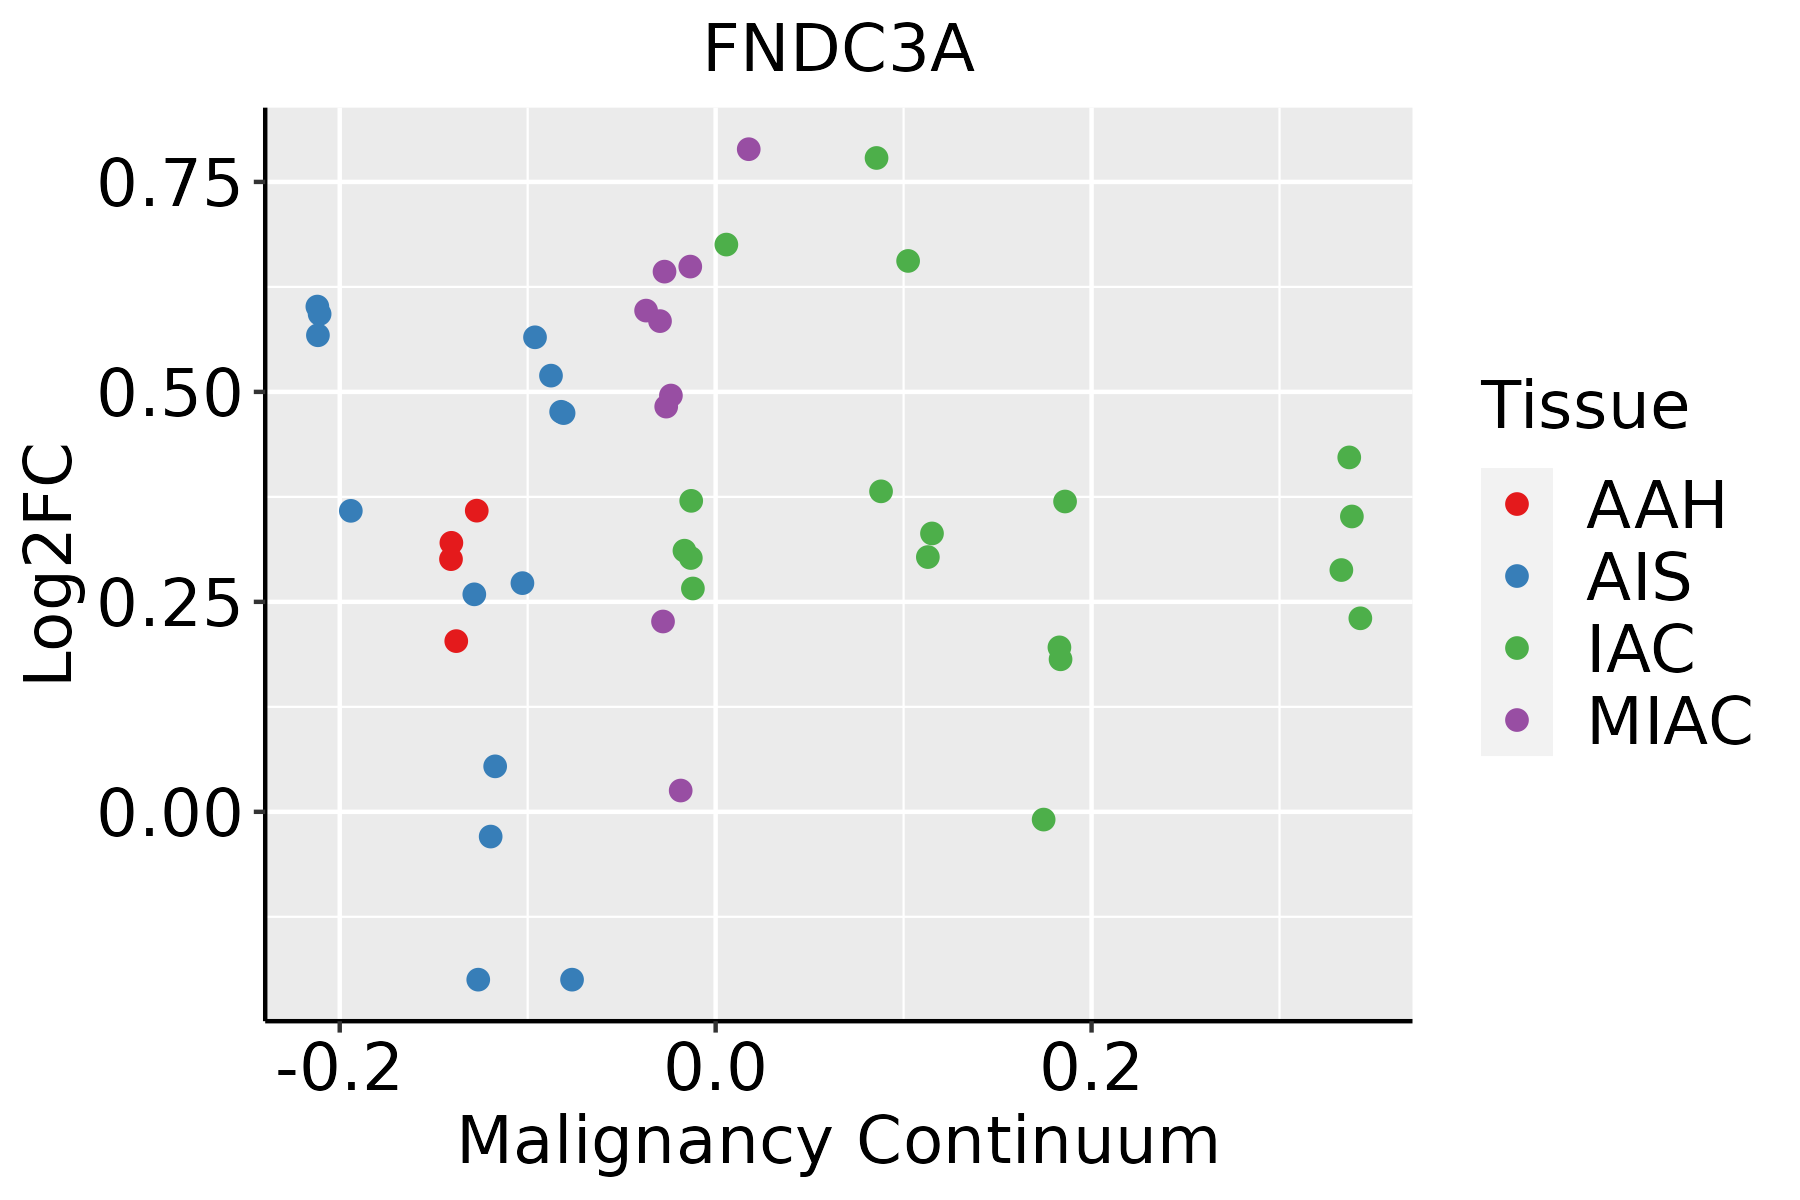
AAH: Atypical adenomatous hyperplasia
AIS: Adenocarcinoma in situ
IAC: Invasive lung adenocarcinoma
MIA: Minimally invasive adenocarcinoma
Oral CavityThe image shows the transcriptomic changes along malignancy continuum.log2FC in expression of this searched gene in stem-like cells from each diseased tissue sample relative to stem-like cells in normal samples in each tissue plotted against the malignancy continuum. Samples are colored based on if they are from different disease stage.EOLP: Erosive Oral lichen planus
LP: leukoplakia
NEOLP: Non-erosive oral lichen planus
OSCC: Oral squamous cell carcinoma
ProstateThe image shows the transcriptomic changes along malignancy continuum.log2FC in expression of this searched gene in stem-like cells from each diseased tissue sample relative to stem-like cells in normal samples in each tissue plotted against the malignancy continuum. Samples are colored based on if they are from different disease stage.
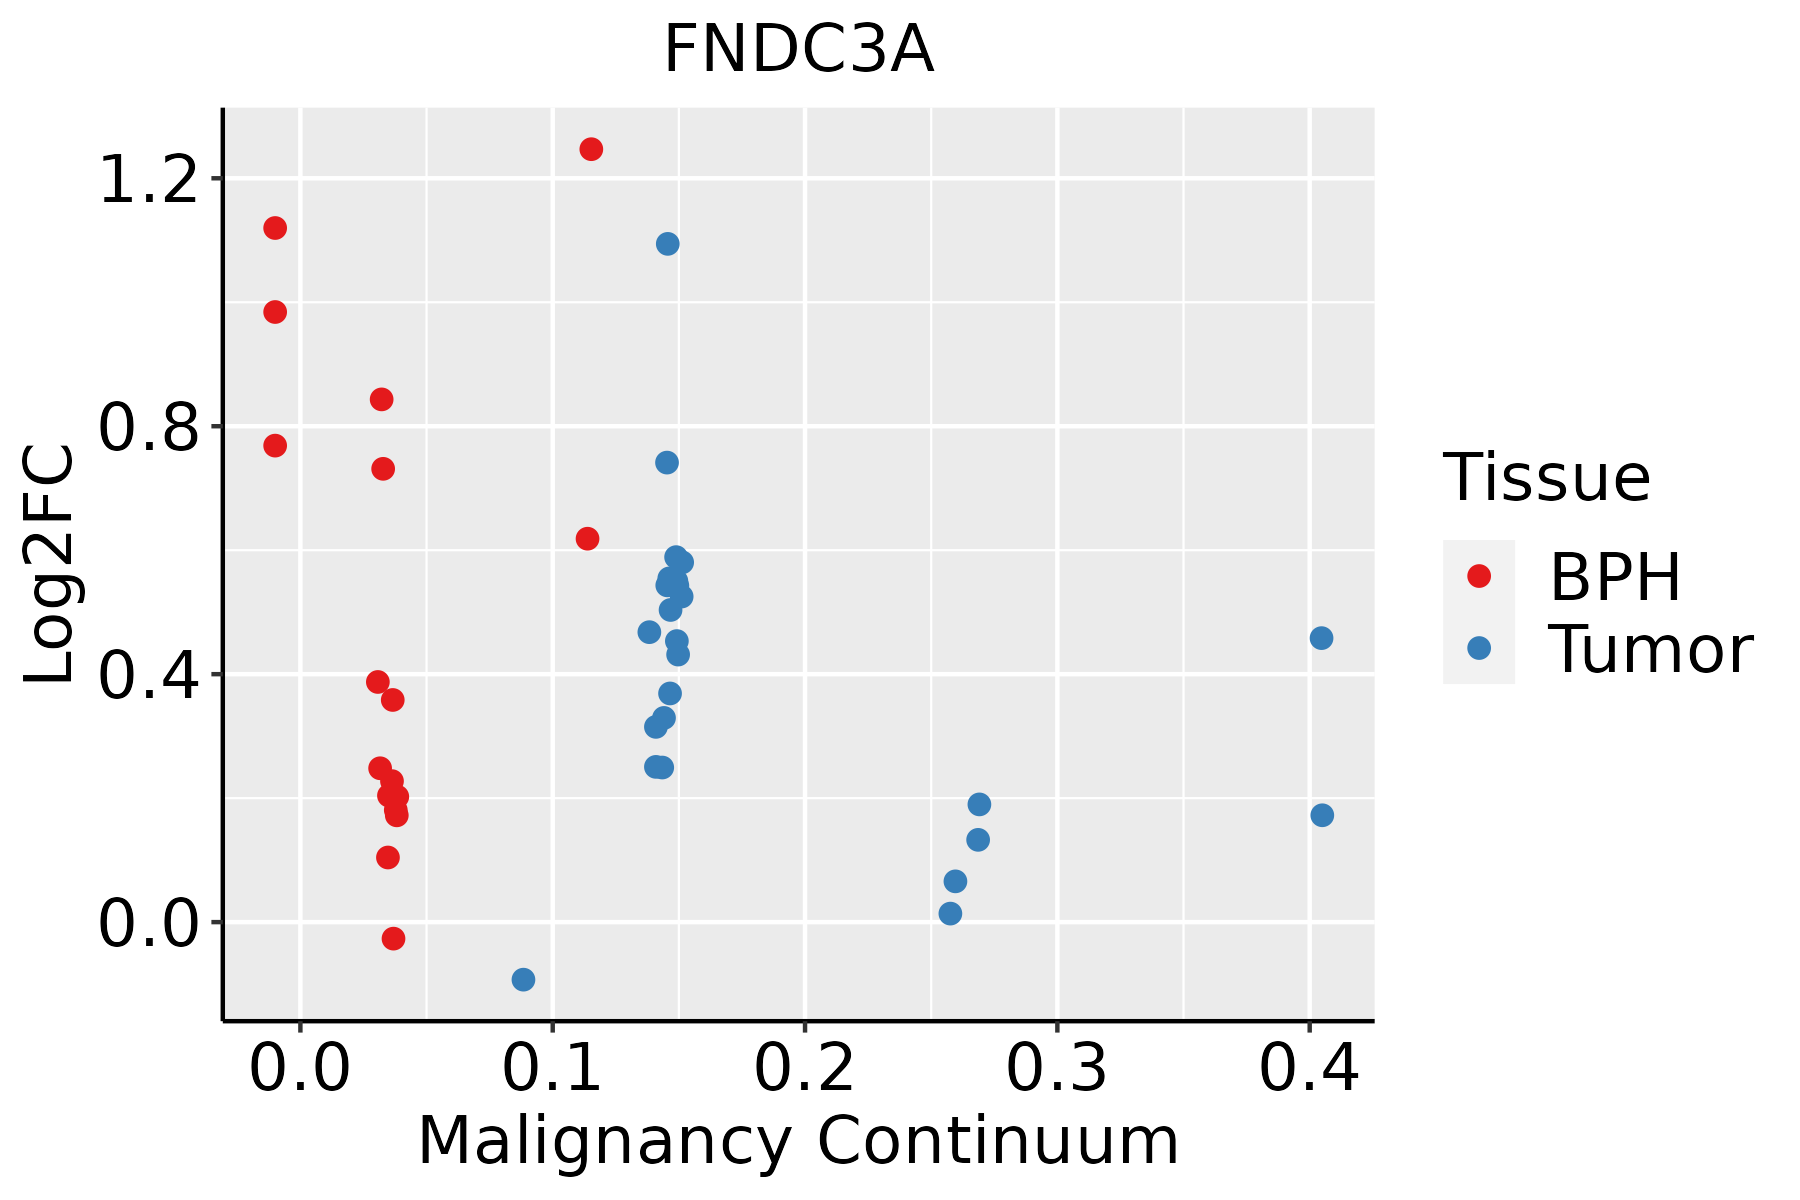
BPH: Benign Prostatic Hyperplasia
SkinThe image shows the transcriptomic changes along malignancy continuum.log2FC in expression of this searched gene in stem-like cells from each diseased tissue sample relative to stem-like cells in normal samples in each tissue plotted against the malignancy continuum. Samples are colored based on if they are from different disease stage.
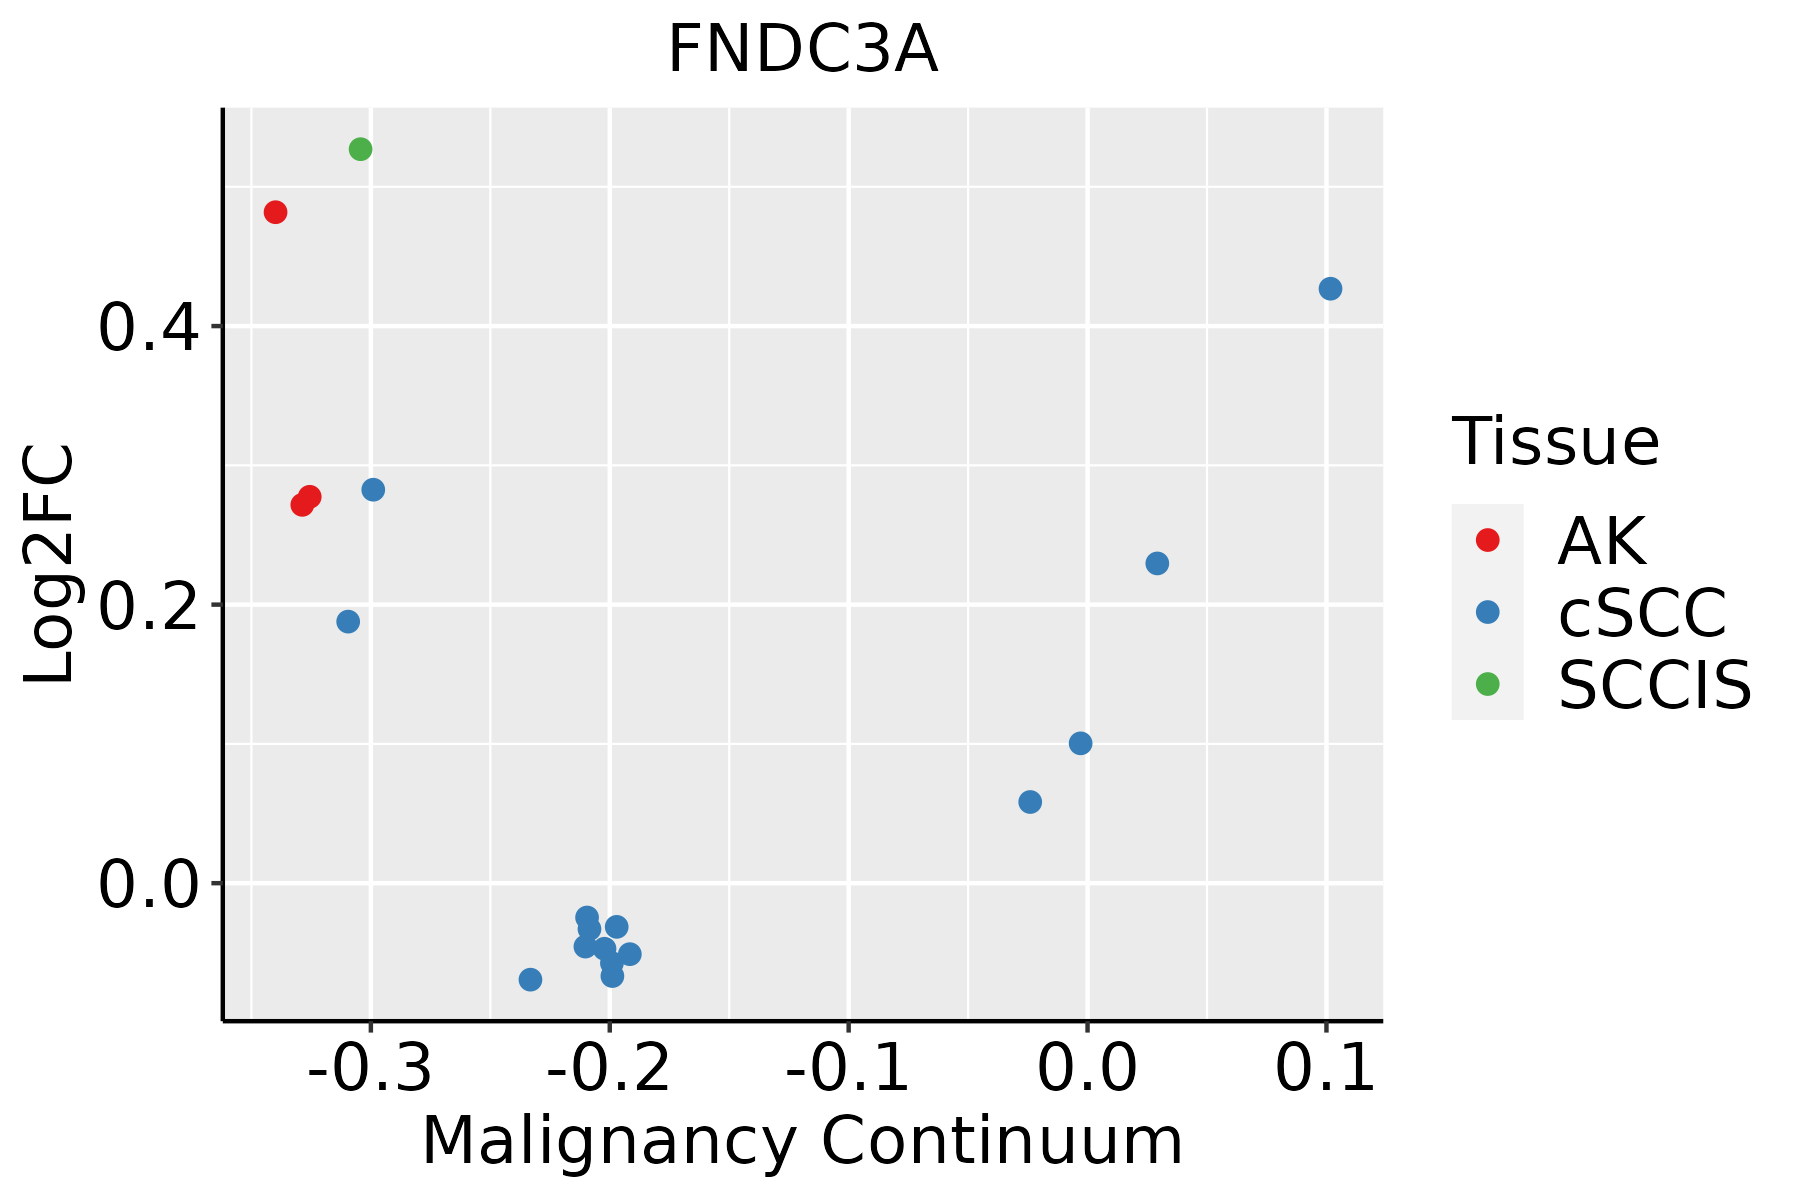
AK: Actinic keratosis
cSCC: Cutaneous squamous cell carcinoma
SCCIS:squamous cell carcinoma in situ
ThyroidThe image shows the transcriptomic changes along malignancy continuum.log2FC in expression of this searched gene in stem-like cells from each diseased tissue sample relative to stem-like cells in normal samples in each tissue plotted against the malignancy continuum. Samples are colored based on if they are from different disease stage.ATC: Anaplastic thyroid cancer
HT: Hashimoto's thyroiditis
PTC: Papillary thyroid cancer
∗log2FC in expression of this searched gene in stem-like cells from each diseased tissue sample relative to stem-like cells in normal samples in each tissue plotted against the malignancy continuum. Samples are colored based on if they are from different disease stage.

Top

Malignant transformation related pathway analysis

check buttonFind out the enriched GO biological processes and KEGG pathways involved in transition from healthy to precancer to cancer
check button Figure of enriched GO biological processes.
TissueDisease StageEnriched GO biological Processes
ColorectumADGO analysis - Figure of enriched GO biological processes: Top 15 enriched GO BP terms are showed in the bar plot of each disease state in each tissue. Each row represents a significant GO biological process which is colored according to the -log10(p.adjust).
ColorectumSERGO analysis - Figure of enriched GO biological processes: Top 15 enriched GO BP terms are showed in the bar plot of each disease state in each tissue. Each row represents a significant GO biological process which is colored according to the -log10(p.adjust).
ColorectumMSSGO analysis - Figure of enriched GO biological processes: Top 15 enriched GO BP terms are showed in the bar plot of each disease state in each tissue. Each row represents a significant GO biological process which is colored according to the -log10(p.adjust).
ColorectumMSI-HGO analysis - Figure of enriched GO biological processes: Top 15 enriched GO BP terms are showed in the bar plot of each disease state in each tissue. Each row represents a significant GO biological process which is colored according to the -log10(p.adjust).
ColorectumFAPGO analysis - Figure of enriched GO biological processes: Top 15 enriched GO BP terms are showed in the bar plot of each disease state in each tissue. Each row represents a significant GO biological process which is colored according to the -log10(p.adjust).
∗Top 15 enriched GO BP terms are showed in the bar plot of each disease state in each tissue. Each row represents a significant GO biological process which is colored according to the -log10(p.adjust).
Page: 1 2 3 4 5 6 7 8 9 

check button Enriched GO biological processes.
GO IDTissueDisease StageDescriptionGene RatioBg Ratiopvaluep.adjustCount
GO:0002064ColorectumADepithelial cell development89/3918220/187232.98e-113.52e-0989
GO:0061458ColorectumADreproductive system development116/3918427/187231.11e-031.01e-02116
GO:0048608ColorectumADreproductive structure development114/3918424/187231.78e-031.47e-02114
GO:0060009ColorectumADSertoli cell development7/391812/187235.09e-033.38e-027
GO:00020641ColorectumSERepithelial cell development64/2897220/187231.96e-071.10e-0564
GO:00614581ColorectumSERreproductive system development87/2897427/187233.69e-033.07e-0287
GO:00600091ColorectumSERSertoli cell development6/289712/187235.42e-034.03e-026
GO:00486081ColorectumSERreproductive structure development85/2897424/187236.33e-034.56e-0285
GO:00020642ColorectumMSSepithelial cell development81/3467220/187231.02e-101.06e-0881
GO:00614582ColorectumMSSreproductive system development115/3467427/187239.86e-062.39e-04115
GO:00486082ColorectumMSSreproductive structure development113/3467424/187231.94e-054.18e-04113
GO:00020644ColorectumFAPepithelial cell development62/2622220/187232.74e-082.54e-0662
GO:00614583ColorectumFAPreproductive system development85/2622427/187234.30e-045.13e-0385
GO:00486083ColorectumFAPreproductive structure development84/2622424/187235.40e-046.10e-0384
GO:00020645ColorectumCRCepithelial cell development55/2078220/187234.63e-091.16e-0655
GO:00614584ColorectumCRCreproductive system development73/2078427/187231.13e-042.22e-0373
GO:00486084ColorectumCRCreproductive structure development72/2078424/187231.55e-042.80e-0372
GO:00614589EndometriumAEHreproductive system development88/2100427/187239.50e-096.41e-0788
GO:00486089EndometriumAEHreproductive structure development87/2100424/187231.43e-089.12e-0787
GO:000206415EndometriumAEHepithelial cell development43/2100220/187231.94e-042.48e-0343
Page: 1 2 3 4 5 6 

check button Enriched KEGG pathways.
Pathway IDTissueDisease StageDescriptionGene RatioBg Ratiopvaluep.adjustqvalueCount
Page: 1 

Top

Cell-cell communication analysis

check buttonIdentification of potential cell-cell interactions between two cell types and their ligand-receptor pairs for different disease states
LigandReceptorLRpairPathwayTissueDisease Stage
Page: 1 

Top

Single-cell gene regulatory network inference analysis

check buttonFind out the significant the regulons (TFs) and the target genes of each regulon across cell types for different disease states
TFCell TypeTissueDisease StageTarget GeneRSSRegulon Activity
∗The dot plots of a searched regulon are shown for all cell subpopulations in each disease state of each tissue based on the regulon specific score inferred using pySCENIC and by calculating the average expression.
Page: 1 

Top

Somatic mutation of malignant transformation related genes

check buttonAnnotation of somatic variants for genes involved in malignant transformation
Hugo SymbolVariant ClassVariant ClassificationdbSNP RSHGVScHGVSpHGVSp ShortSWISSPROTBIOTYPESIFTPolyPhenTumor Sample BarcodeTissueHistologySexAgeStageTherapy TypesDrugsOutcome
FNDC3ASNVMissense_Mutationnovelc.3337N>Ap.Glu1113Lysp.E1113KQ9Y2H6protein_codingdeleterious(0.03)benign(0.155)TCGA-3C-AALI-01Breastbreast invasive carcinomaFemale<65I/IIUnspecificPoly EComplete Response
FNDC3ASNVMissense_Mutationnovelc.1842N>Ap.Met614Ilep.M614IQ9Y2H6protein_codingtolerated(0.49)benign(0.003)TCGA-5L-AAT1-01Breastbreast invasive carcinomaFemale<65III/IVHormone TherapyletrozolSD
FNDC3ASNVMissense_Mutationc.2014G>Tp.Gly672Cysp.G672CQ9Y2H6protein_codingdeleterious(0)probably_damaging(0.999)TCGA-A8-A09Z-01Breastbreast invasive carcinomaFemale>=65I/IIUnknownUnknownSD
FNDC3ASNVMissense_Mutationnovelc.568N>Gp.Leu190Valp.L190VQ9Y2H6protein_codingtolerated(0.07)benign(0.297)TCGA-AN-A046-01Breastbreast invasive carcinomaFemale>=65I/IIUnknownUnknownSD
FNDC3ASNVMissense_Mutationnovelc.1842N>Ap.Met614Ilep.M614IQ9Y2H6protein_codingtolerated(0.49)benign(0.003)TCGA-AO-A0JC-01Breastbreast invasive carcinomaFemale<65I/IIChemotherapyfluorouracilSD
FNDC3ASNVMissense_Mutationc.971T>Cp.Val324Alap.V324AQ9Y2H6protein_codingtolerated(0.21)benign(0.044)TCGA-D8-A140-01Breastbreast invasive carcinomaFemale<65I/IIChemotherapydoxorubicin+cyclophosphamidSD
FNDC3AdeletionIn_Frame_Delc.2623_2625delTCTp.Ser875delp.S875delQ9Y2H6protein_codingTCGA-AN-A0AK-01Breastbreast invasive carcinomaFemale>=65I/IIUnknownUnknownSD
FNDC3ASNVMissense_Mutationc.2602G>Ap.Glu868Lysp.E868KQ9Y2H6protein_codingtolerated(0.69)benign(0.101)TCGA-LP-A5U2-01Cervixcervical & endocervical cancerFemale<65III/IVUnknownUnknownSD
FNDC3ASNVMissense_Mutationrs201004322c.826N>Ap.Asp276Asnp.D276NQ9Y2H6protein_codingtolerated(0.71)benign(0.005)TCGA-Q1-A5R2-01Cervixcervical & endocervical cancerFemale<65I/IIChemotherapycisplatinPR
FNDC3ASNVMissense_Mutationrs771506910c.2206N>Tp.Arg736Cysp.R736CQ9Y2H6protein_codingdeleterious(0)benign(0.188)TCGA-5M-AAT6-01Colorectumcolon adenocarcinomaFemale<65III/IVUnknownUnknownPD
Page: 1 2 3 4 5 6 7 8 9 10 

Top

Related drugs of malignant transformation related genes

check buttonIdentification of chemicals and drugs interact with genes involved in malignant transfromation
(DGIdb 4.0)
Entrez IDSymbolCategoryInteraction TypesDrug Claim NameDrug NamePMIDs
Page: 1