
|
|||||
|
 | |
| |
| |
| |
| |
| |
|
Gene: FN3KRP |
Gene summary for FN3KRP |
| Gene information | Species | Human | Gene symbol | FN3KRP | Gene ID | 79672 |
| Gene name | fructosamine 3 kinase related protein | |
| Gene Alias | FN3KL | |
| Cytomap | 17q25.3 | |
| Gene Type | protein-coding | GO ID | GO:0006464 | UniProtAcc | A0A140VK84 |
Top |
Malignant transformation analysis |
| Identification of the aberrant gene expression in precancerous and cancerous lesions by comparing the gene expression of stem-like cells in diseased tissues with normal stem cells |
| Entrez ID | Symbol | Replicates | Species | Organ | Tissue | Adj P-value | Log2FC | Malignancy |
| 79672 | FN3KRP | LZE4T | Human | Esophagus | ESCC | 2.80e-10 | 3.04e-01 | 0.0811 |
| 79672 | FN3KRP | LZE7T | Human | Esophagus | ESCC | 1.21e-04 | 2.65e-01 | 0.0667 |
| 79672 | FN3KRP | LZE8T | Human | Esophagus | ESCC | 9.13e-03 | 8.74e-02 | 0.067 |
| 79672 | FN3KRP | LZE20T | Human | Esophagus | ESCC | 3.80e-02 | 1.17e-01 | 0.0662 |
| 79672 | FN3KRP | LZE22T | Human | Esophagus | ESCC | 1.59e-03 | 5.28e-01 | 0.068 |
| 79672 | FN3KRP | LZE24T | Human | Esophagus | ESCC | 4.63e-22 | 4.54e-01 | 0.0596 |
| 79672 | FN3KRP | LZE21T | Human | Esophagus | ESCC | 9.94e-03 | 3.06e-01 | 0.0655 |
| 79672 | FN3KRP | LZE6T | Human | Esophagus | ESCC | 3.65e-04 | 1.64e-01 | 0.0845 |
| 79672 | FN3KRP | P1T-E | Human | Esophagus | ESCC | 5.35e-06 | 3.61e-01 | 0.0875 |
| 79672 | FN3KRP | P2T-E | Human | Esophagus | ESCC | 9.62e-43 | 6.86e-01 | 0.1177 |
| 79672 | FN3KRP | P4T-E | Human | Esophagus | ESCC | 1.11e-13 | 3.35e-01 | 0.1323 |
| 79672 | FN3KRP | P5T-E | Human | Esophagus | ESCC | 9.17e-19 | 4.82e-01 | 0.1327 |
| 79672 | FN3KRP | P8T-E | Human | Esophagus | ESCC | 2.77e-28 | 4.94e-01 | 0.0889 |
| 79672 | FN3KRP | P9T-E | Human | Esophagus | ESCC | 2.60e-10 | 2.00e-01 | 0.1131 |
| 79672 | FN3KRP | P10T-E | Human | Esophagus | ESCC | 1.47e-19 | 3.91e-01 | 0.116 |
| 79672 | FN3KRP | P11T-E | Human | Esophagus | ESCC | 3.06e-16 | 8.00e-01 | 0.1426 |
| 79672 | FN3KRP | P12T-E | Human | Esophagus | ESCC | 3.50e-34 | 6.57e-01 | 0.1122 |
| 79672 | FN3KRP | P15T-E | Human | Esophagus | ESCC | 3.07e-36 | 8.12e-01 | 0.1149 |
| 79672 | FN3KRP | P16T-E | Human | Esophagus | ESCC | 3.14e-21 | 3.61e-01 | 0.1153 |
| 79672 | FN3KRP | P17T-E | Human | Esophagus | ESCC | 9.15e-07 | 3.81e-01 | 0.1278 |
| Page: 1 2 3 4 5 |
| Tissue | Expression Dynamics | Abbreviation |
| Esophagus | 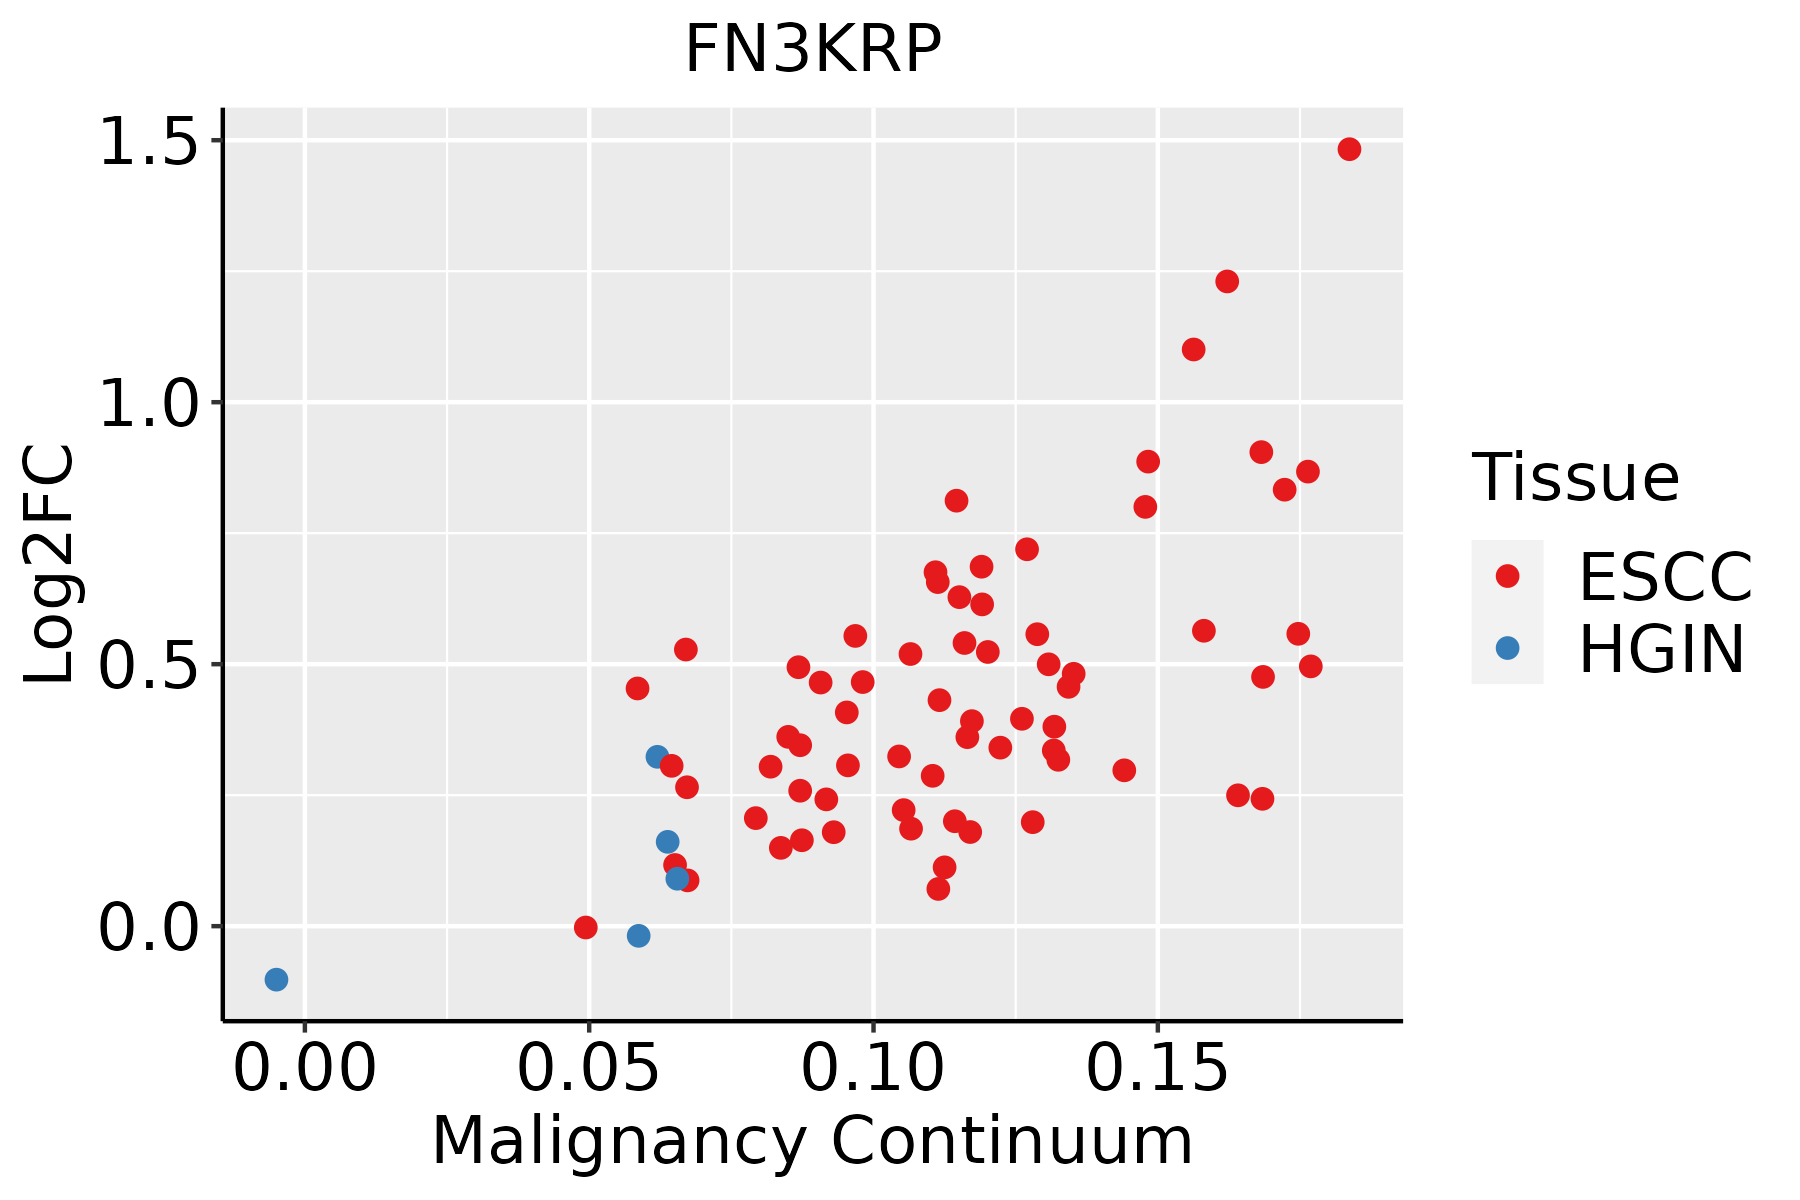 | ESCC: Esophageal squamous cell carcinoma |
| HGIN: High-grade intraepithelial neoplasias | ||
| LGIN: Low-grade intraepithelial neoplasias | ||
| Liver |  | HCC: Hepatocellular carcinoma |
| NAFLD: Non-alcoholic fatty liver disease | ||
| Oral Cavity | 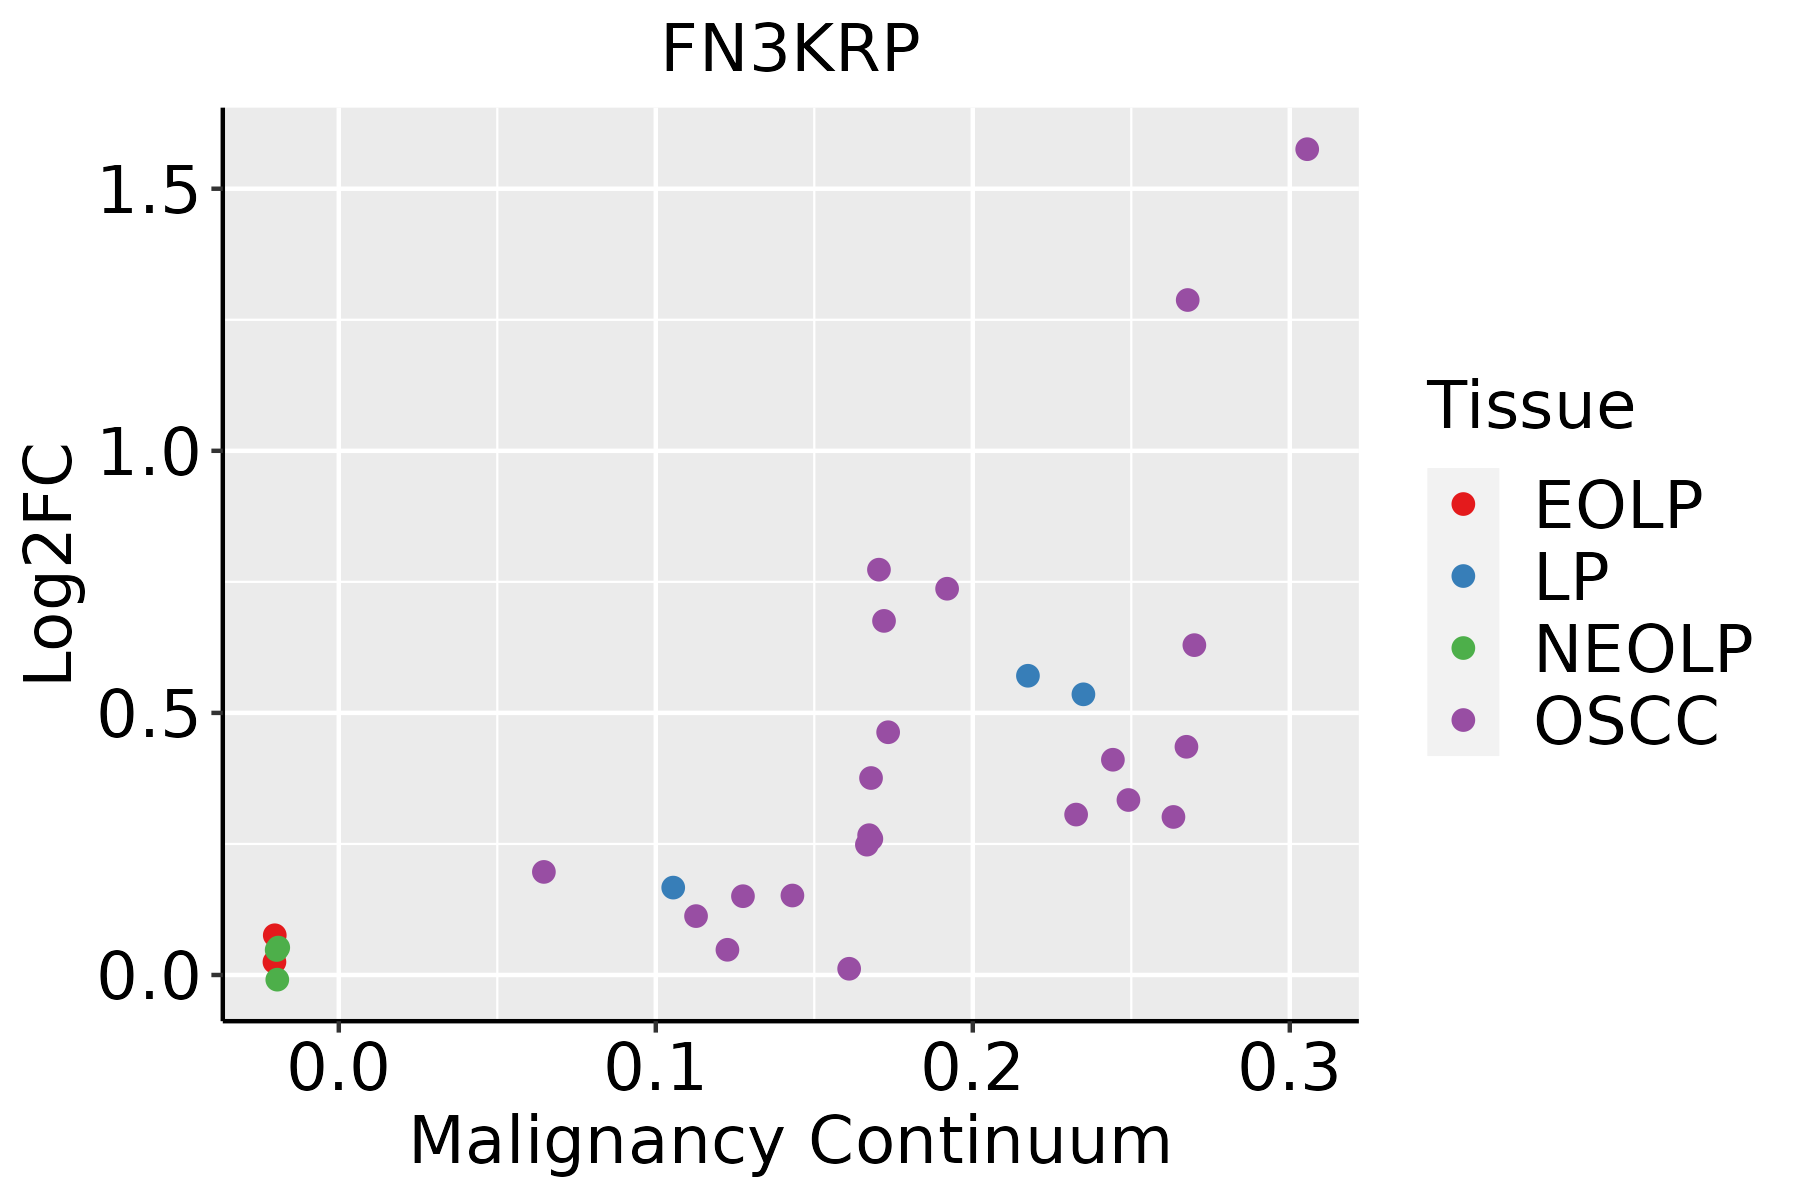 | EOLP: Erosive Oral lichen planus |
| LP: leukoplakia | ||
| NEOLP: Non-erosive oral lichen planus | ||
| OSCC: Oral squamous cell carcinoma |
| ∗log2FC in expression of this searched gene in stem-like cells from each diseased tissue sample relative to stem-like cells in normal samples in each tissue plotted against the malignancy continuum. Samples are colored based on if they are from different disease stage. |
Top |
Malignant transformation related pathway analysis |
| Find out the enriched GO biological processes and KEGG pathways involved in transition from healthy to precancer to cancer |
| Tissue | Disease Stage | Enriched GO biological Processes |
| Colorectum | AD |  |
| Colorectum | SER |  |
| Colorectum | MSS |  |
| Colorectum | MSI-H |  |
| Colorectum | FAP |  |
| ∗Top 15 enriched GO BP terms are showed in the bar plot of each disease state in each tissue. Each row represents a significant GO biological process which is colored according to the -log10(p.adjust). |
| Page: 1 2 3 4 5 6 7 8 9 |
| GO ID | Tissue | Disease Stage | Description | Gene Ratio | Bg Ratio | pvalue | p.adjust | Count |
| GO:0043687 | Liver | HCC | post-translational protein modification | 24/7958 | 37/18723 | 5.03e-03 | 2.11e-02 | 24 |
| Page: 1 |
| Pathway ID | Tissue | Disease Stage | Description | Gene Ratio | Bg Ratio | pvalue | p.adjust | qvalue | Count |
| Page: 1 |
Top |
Cell-cell communication analysis |
| Identification of potential cell-cell interactions between two cell types and their ligand-receptor pairs for different disease states |
| Ligand | Receptor | LRpair | Pathway | Tissue | Disease Stage |
| Page: 1 |
Top |
Single-cell gene regulatory network inference analysis |
| Find out the significant the regulons (TFs) and the target genes of each regulon across cell types for different disease states |
| TF | Cell Type | Tissue | Disease Stage | Target Gene | RSS | Regulon Activity |
| ∗The dot plots of a searched regulon are shown for all cell subpopulations in each disease state of each tissue based on the regulon specific score inferred using pySCENIC and by calculating the average expression. |
| Page: 1 |
Top |
Somatic mutation of malignant transformation related genes |
| Annotation of somatic variants for genes involved in malignant transformation |
| Hugo Symbol | Variant Class | Variant Classification | dbSNP RS | HGVSc | HGVSp | HGVSp Short | SWISSPROT | BIOTYPE | SIFT | PolyPhen | Tumor Sample Barcode | Tissue | Histology | Sex | Age | Stage | Therapy Types | Drugs | Outcome |
| FN3KRP | SNV | Missense_Mutation | rs111958189 | c.614N>A | p.Arg205His | p.R205H | Q9HA64 | protein_coding | tolerated(0.14) | benign(0.005) | TCGA-A8-A09W-01 | Breast | breast invasive carcinoma | Female | >=65 | III/IV | Unknown | Unknown | SD |
| FN3KRP | SNV | Missense_Mutation | c.176T>C | p.Leu59Ser | p.L59S | Q9HA64 | protein_coding | deleterious(0) | probably_damaging(0.999) | TCGA-BH-A0EE-01 | Breast | breast invasive carcinoma | Female | >=65 | I/II | Chemotherapy | docetaxel | SD | |
| FN3KRP | SNV | Missense_Mutation | c.389N>A | p.Arg130Lys | p.R130K | Q9HA64 | protein_coding | tolerated(1) | benign(0.001) | TCGA-C8-A26Y-01 | Breast | breast invasive carcinoma | Female | >=65 | I/II | Unknown | Unknown | SD | |
| FN3KRP | SNV | Missense_Mutation | novel | c.746N>G | p.Ala249Gly | p.A249G | Q9HA64 | protein_coding | tolerated(0.06) | benign(0.232) | TCGA-EW-A1P1-01 | Breast | breast invasive carcinoma | Female | >=65 | III/IV | Chemotherapy | taxotere | PD |
| FN3KRP | insertion | In_Frame_Ins | novel | c.269_270insACACTGGAAAGCTCAAGCCCTCTTCTTCCAGTACAG | p.His90delinsGlnHisTrpLysAlaGlnAlaLeuPhePheGlnTyrSer | p.H90delinsQHWKAQALFFQYS | Q9HA64 | protein_coding | TCGA-A7-A0CE-01 | Breast | breast invasive carcinoma | Female | <65 | I/II | Chemotherapy | adriamycin | SD | ||
| FN3KRP | deletion | Frame_Shift_Del | novel | c.676delG | p.Asp226IlefsTer6 | p.D226Ifs*6 | Q9HA64 | protein_coding | TCGA-EW-A2FV-01 | Breast | breast invasive carcinoma | Female | <65 | III/IV | Chemotherapy | docetaxel | SD | ||
| FN3KRP | SNV | Missense_Mutation | c.683N>G | p.Ser228Cys | p.S228C | Q9HA64 | protein_coding | deleterious(0.04) | possibly_damaging(0.852) | TCGA-C5-A7X3-01 | Cervix | cervical & endocervical cancer | Female | >=65 | III/IV | Chemotherapy | cisplatin | SD | |
| FN3KRP | SNV | Missense_Mutation | novel | c.644N>G | p.His215Arg | p.H215R | Q9HA64 | protein_coding | deleterious(0) | probably_damaging(1) | TCGA-VS-A94Z-01 | Cervix | cervical & endocervical cancer | Female | <65 | I/II | Chemotherapy | cisplatin | CR |
| FN3KRP | SNV | Missense_Mutation | novel | c.610T>C | p.Phe204Leu | p.F204L | Q9HA64 | protein_coding | tolerated(0.05) | probably_damaging(0.951) | TCGA-AA-3947-01 | Colorectum | colon adenocarcinoma | Female | <65 | I/II | Unknown | Unknown | SD |
| FN3KRP | SNV | Missense_Mutation | rs756638100 | c.362N>A | p.Arg121His | p.R121H | Q9HA64 | protein_coding | tolerated(0.54) | possibly_damaging(0.532) | TCGA-AD-6964-01 | Colorectum | colon adenocarcinoma | Male | <65 | III/IV | Chemotherapy | folfox | PD |
| Page: 1 2 3 4 |
Top |
Related drugs of malignant transformation related genes |
| Identification of chemicals and drugs interact with genes involved in malignant transfromation |
| (DGIdb 4.0) |
| Entrez ID | Symbol | Category | Interaction Types | Drug Claim Name | Drug Name | PMIDs |
| Page: 1 |

Copyright 2023-Present -The University of Texas Health Science Center at Houston |