
|
|||||
|
 | |
| |
| |
| |
| |
| |
|
Gene: FN3K |
Gene summary for FN3K |
| Gene information | Species | Human | Gene symbol | FN3K | Gene ID | 64122 |
| Gene name | fructosamine 3 kinase | |
| Gene Alias | FN3K | |
| Cytomap | 17q25.3 | |
| Gene Type | protein-coding | GO ID | GO:0006040 | UniProtAcc | Q9H479 |
Top |
Malignant transformation analysis |
| Identification of the aberrant gene expression in precancerous and cancerous lesions by comparing the gene expression of stem-like cells in diseased tissues with normal stem cells |
| Entrez ID | Symbol | Replicates | Species | Organ | Tissue | Adj P-value | Log2FC | Malignancy |
| 64122 | FN3K | LZE4T | Human | Esophagus | ESCC | 8.21e-09 | 2.61e-01 | 0.0811 |
| 64122 | FN3K | LZE24T | Human | Esophagus | ESCC | 5.67e-20 | 4.72e-01 | 0.0596 |
| 64122 | FN3K | LZE21T | Human | Esophagus | ESCC | 1.21e-03 | 2.93e-01 | 0.0655 |
| 64122 | FN3K | P1T-E | Human | Esophagus | ESCC | 2.91e-03 | 2.49e-01 | 0.0875 |
| 64122 | FN3K | P2T-E | Human | Esophagus | ESCC | 3.32e-18 | 3.33e-01 | 0.1177 |
| 64122 | FN3K | P5T-E | Human | Esophagus | ESCC | 6.15e-09 | 1.52e-01 | 0.1327 |
| 64122 | FN3K | P8T-E | Human | Esophagus | ESCC | 9.11e-35 | 5.80e-01 | 0.0889 |
| 64122 | FN3K | P9T-E | Human | Esophagus | ESCC | 7.82e-16 | 2.91e-01 | 0.1131 |
| 64122 | FN3K | P10T-E | Human | Esophagus | ESCC | 3.27e-14 | 2.49e-01 | 0.116 |
| 64122 | FN3K | P11T-E | Human | Esophagus | ESCC | 2.69e-17 | 6.56e-01 | 0.1426 |
| 64122 | FN3K | P12T-E | Human | Esophagus | ESCC | 3.63e-41 | 7.59e-01 | 0.1122 |
| 64122 | FN3K | P15T-E | Human | Esophagus | ESCC | 1.32e-17 | 3.57e-01 | 0.1149 |
| 64122 | FN3K | P16T-E | Human | Esophagus | ESCC | 2.39e-21 | 4.01e-01 | 0.1153 |
| 64122 | FN3K | P17T-E | Human | Esophagus | ESCC | 8.11e-04 | 3.72e-01 | 0.1278 |
| 64122 | FN3K | P19T-E | Human | Esophagus | ESCC | 1.04e-04 | 4.05e-01 | 0.1662 |
| 64122 | FN3K | P20T-E | Human | Esophagus | ESCC | 1.11e-07 | 1.36e-01 | 0.1124 |
| 64122 | FN3K | P21T-E | Human | Esophagus | ESCC | 2.42e-15 | 3.36e-01 | 0.1617 |
| 64122 | FN3K | P22T-E | Human | Esophagus | ESCC | 1.33e-23 | 4.85e-01 | 0.1236 |
| 64122 | FN3K | P23T-E | Human | Esophagus | ESCC | 7.68e-03 | 1.42e-01 | 0.108 |
| 64122 | FN3K | P24T-E | Human | Esophagus | ESCC | 1.19e-05 | 1.98e-01 | 0.1287 |
| Page: 1 2 3 |
| Tissue | Expression Dynamics | Abbreviation |
| Esophagus |  | ESCC: Esophageal squamous cell carcinoma |
| HGIN: High-grade intraepithelial neoplasias | ||
| LGIN: Low-grade intraepithelial neoplasias | ||
| Liver | 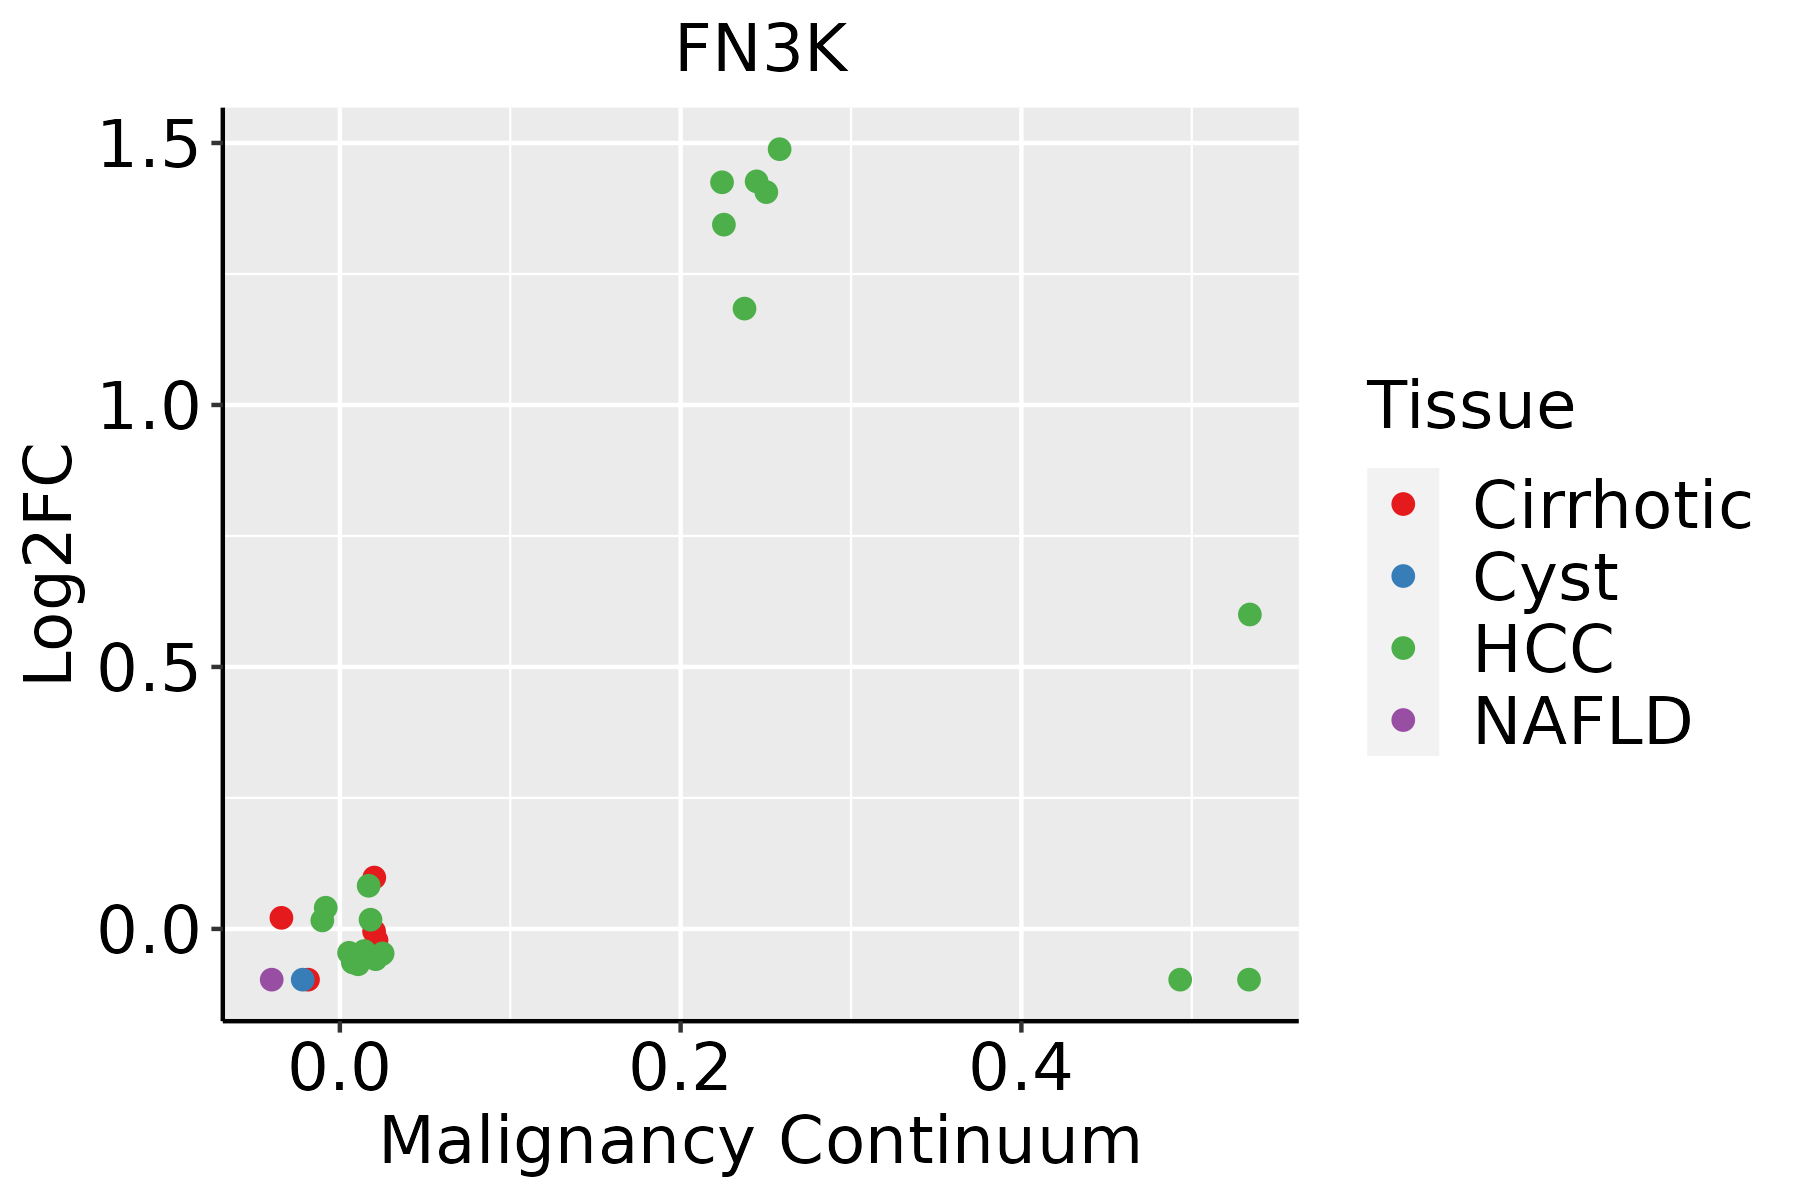 | HCC: Hepatocellular carcinoma |
| NAFLD: Non-alcoholic fatty liver disease |
| ∗log2FC in expression of this searched gene in stem-like cells from each diseased tissue sample relative to stem-like cells in normal samples in each tissue plotted against the malignancy continuum. Samples are colored based on if they are from different disease stage. |
Top |
Malignant transformation related pathway analysis |
| Find out the enriched GO biological processes and KEGG pathways involved in transition from healthy to precancer to cancer |
| Tissue | Disease Stage | Enriched GO biological Processes |
| Colorectum | AD |  |
| Colorectum | SER |  |
| Colorectum | MSS |  |
| Colorectum | MSI-H |  |
| Colorectum | FAP |  |
| ∗Top 15 enriched GO BP terms are showed in the bar plot of each disease state in each tissue. Each row represents a significant GO biological process which is colored according to the -log10(p.adjust). |
| Page: 1 2 3 4 5 6 7 8 9 |
| GO ID | Tissue | Disease Stage | Description | Gene Ratio | Bg Ratio | pvalue | p.adjust | Count |
| GO:00065202 | Liver | HCC | cellular amino acid metabolic process | 167/7958 | 284/18723 | 1.91e-08 | 4.56e-07 | 167 |
| GO:0043687 | Liver | HCC | post-translational protein modification | 24/7958 | 37/18723 | 5.03e-03 | 2.11e-02 | 24 |
| Page: 1 |
| Pathway ID | Tissue | Disease Stage | Description | Gene Ratio | Bg Ratio | pvalue | p.adjust | qvalue | Count |
| Page: 1 |
Top |
Cell-cell communication analysis |
| Identification of potential cell-cell interactions between two cell types and their ligand-receptor pairs for different disease states |
| Ligand | Receptor | LRpair | Pathway | Tissue | Disease Stage |
| Page: 1 |
Top |
Single-cell gene regulatory network inference analysis |
| Find out the significant the regulons (TFs) and the target genes of each regulon across cell types for different disease states |
| TF | Cell Type | Tissue | Disease Stage | Target Gene | RSS | Regulon Activity |
| ∗The dot plots of a searched regulon are shown for all cell subpopulations in each disease state of each tissue based on the regulon specific score inferred using pySCENIC and by calculating the average expression. |
| Page: 1 |
Top |
Somatic mutation of malignant transformation related genes |
| Annotation of somatic variants for genes involved in malignant transformation |
| Hugo Symbol | Variant Class | Variant Classification | dbSNP RS | HGVSc | HGVSp | HGVSp Short | SWISSPROT | BIOTYPE | SIFT | PolyPhen | Tumor Sample Barcode | Tissue | Histology | Sex | Age | Stage | Therapy Types | Drugs | Outcome |
| FN3K | SNV | Missense_Mutation | novel | c.513C>A | p.His171Gln | p.H171Q | Q9H479 | protein_coding | tolerated(1) | benign(0.015) | TCGA-AC-A8OP-01 | Breast | breast invasive carcinoma | Female | >=65 | I/II | Unknown | Unknown | SD |
| FN3K | SNV | Missense_Mutation | c.704C>T | p.Pro235Leu | p.P235L | Q9H479 | protein_coding | deleterious(0) | probably_damaging(0.999) | TCGA-B6-A2IU-01 | Breast | breast invasive carcinoma | Female | <65 | I/II | Unknown | Unknown | PD | |
| FN3K | SNV | Missense_Mutation | rs368977042 | c.602N>T | p.Pro201Leu | p.P201L | Q9H479 | protein_coding | deleterious(0) | probably_damaging(0.956) | TCGA-C8-A26X-01 | Breast | breast invasive carcinoma | Female | <65 | I/II | Chemotherapy | 5-fluorouracil | CR |
| FN3K | SNV | Missense_Mutation | novel | c.721N>G | p.His241Asp | p.H241D | Q9H479 | protein_coding | deleterious(0.05) | probably_damaging(0.951) | TCGA-LL-A441-01 | Breast | breast invasive carcinoma | Female | <65 | I/II | Chemotherapy | taxotere | CR |
| FN3K | insertion | Nonsense_Mutation | novel | c.688_689insGATTAAAACTATAA | p.Pro230ArgfsTer5 | p.P230Rfs*5 | Q9H479 | protein_coding | TCGA-A7-A0CE-01 | Breast | breast invasive carcinoma | Female | <65 | I/II | Chemotherapy | adriamycin | SD | ||
| FN3K | SNV | Missense_Mutation | novel | c.634G>A | p.Ala212Thr | p.A212T | Q9H479 | protein_coding | deleterious(0) | probably_damaging(0.914) | TCGA-5M-AAT6-01 | Colorectum | colon adenocarcinoma | Female | <65 | III/IV | Unknown | Unknown | PD |
| FN3K | SNV | Missense_Mutation | novel | c.604G>C | p.Asp202His | p.D202H | Q9H479 | protein_coding | tolerated(0.08) | benign(0.035) | TCGA-AA-3947-01 | Colorectum | colon adenocarcinoma | Female | <65 | I/II | Unknown | Unknown | SD |
| FN3K | SNV | Missense_Mutation | novel | c.232N>A | p.Asp78Asn | p.D78N | Q9H479 | protein_coding | tolerated(0.07) | probably_damaging(0.912) | TCGA-F5-6814-01 | Colorectum | rectum adenocarcinoma | Male | <65 | I/II | Unknown | Unknown | SD |
| FN3K | SNV | Missense_Mutation | novel | c.820N>A | p.Asp274Asn | p.D274N | Q9H479 | protein_coding | tolerated(0.14) | benign(0.023) | TCGA-F5-6814-01 | Colorectum | rectum adenocarcinoma | Male | <65 | I/II | Unknown | Unknown | SD |
| FN3K | deletion | Frame_Shift_Del | rs776430853 | c.757delN | p.Phe255SerfsTer32 | p.F255Sfs*32 | Q9H479 | protein_coding | TCGA-AD-5900-01 | Colorectum | colon adenocarcinoma | Male | >=65 | I/II | Unknown | Unknown | SD |
| Page: 1 2 3 4 |
Top |
Related drugs of malignant transformation related genes |
| Identification of chemicals and drugs interact with genes involved in malignant transfromation |
| (DGIdb 4.0) |
| Entrez ID | Symbol | Category | Interaction Types | Drug Claim Name | Drug Name | PMIDs |
| Page: 1 |

Copyright 2023-Present -The University of Texas Health Science Center at Houston |