
|
|||||
|
 | |
| |
| |
| |
| |
| |
|
Gene: FMR1 |
Gene summary for FMR1 |
| Gene information | Species | Human | Gene symbol | FMR1 | Gene ID | 2332 |
| Gene name | FMRP translational regulator 1 | |
| Gene Alias | FMRP | |
| Cytomap | Xq27.3 | |
| Gene Type | protein-coding | GO ID | GO:0000375 | UniProtAcc | Q06787 |
Top |
Malignant transformation analysis |
| Identification of the aberrant gene expression in precancerous and cancerous lesions by comparing the gene expression of stem-like cells in diseased tissues with normal stem cells |
| Entrez ID | Symbol | Replicates | Species | Organ | Tissue | Adj P-value | Log2FC | Malignancy |
| 2332 | FMR1 | LZE4T | Human | Esophagus | ESCC | 8.09e-05 | 1.18e-01 | 0.0811 |
| 2332 | FMR1 | LZE7T | Human | Esophagus | ESCC | 5.27e-04 | 5.28e-01 | 0.0667 |
| 2332 | FMR1 | LZE20T | Human | Esophagus | ESCC | 1.82e-03 | 1.56e-01 | 0.0662 |
| 2332 | FMR1 | LZE24T | Human | Esophagus | ESCC | 3.58e-19 | 5.99e-01 | 0.0596 |
| 2332 | FMR1 | LZE21T | Human | Esophagus | ESCC | 1.96e-04 | 1.95e-01 | 0.0655 |
| 2332 | FMR1 | LZE6T | Human | Esophagus | ESCC | 1.36e-04 | 9.94e-02 | 0.0845 |
| 2332 | FMR1 | P1T-E | Human | Esophagus | ESCC | 1.56e-05 | 4.66e-01 | 0.0875 |
| 2332 | FMR1 | P2T-E | Human | Esophagus | ESCC | 9.72e-22 | 2.68e-01 | 0.1177 |
| 2332 | FMR1 | P4T-E | Human | Esophagus | ESCC | 3.22e-10 | 1.87e-01 | 0.1323 |
| 2332 | FMR1 | P5T-E | Human | Esophagus | ESCC | 1.14e-08 | 1.20e-01 | 0.1327 |
| 2332 | FMR1 | P8T-E | Human | Esophagus | ESCC | 7.01e-19 | 3.15e-01 | 0.0889 |
| 2332 | FMR1 | P9T-E | Human | Esophagus | ESCC | 1.05e-12 | 2.97e-01 | 0.1131 |
| 2332 | FMR1 | P10T-E | Human | Esophagus | ESCC | 1.22e-26 | 4.39e-01 | 0.116 |
| 2332 | FMR1 | P11T-E | Human | Esophagus | ESCC | 2.25e-05 | 1.61e-01 | 0.1426 |
| 2332 | FMR1 | P12T-E | Human | Esophagus | ESCC | 5.34e-19 | 2.77e-01 | 0.1122 |
| 2332 | FMR1 | P15T-E | Human | Esophagus | ESCC | 4.91e-19 | 2.11e-01 | 0.1149 |
| 2332 | FMR1 | P16T-E | Human | Esophagus | ESCC | 2.42e-06 | 4.91e-02 | 0.1153 |
| 2332 | FMR1 | P19T-E | Human | Esophagus | ESCC | 1.00e-05 | 3.58e-01 | 0.1662 |
| 2332 | FMR1 | P20T-E | Human | Esophagus | ESCC | 7.18e-05 | 1.80e-01 | 0.1124 |
| 2332 | FMR1 | P21T-E | Human | Esophagus | ESCC | 3.06e-09 | 2.06e-01 | 0.1617 |
| Page: 1 2 3 4 5 |
| Tissue | Expression Dynamics | Abbreviation |
| Esophagus |  | ESCC: Esophageal squamous cell carcinoma |
| HGIN: High-grade intraepithelial neoplasias | ||
| LGIN: Low-grade intraepithelial neoplasias | ||
| Liver | 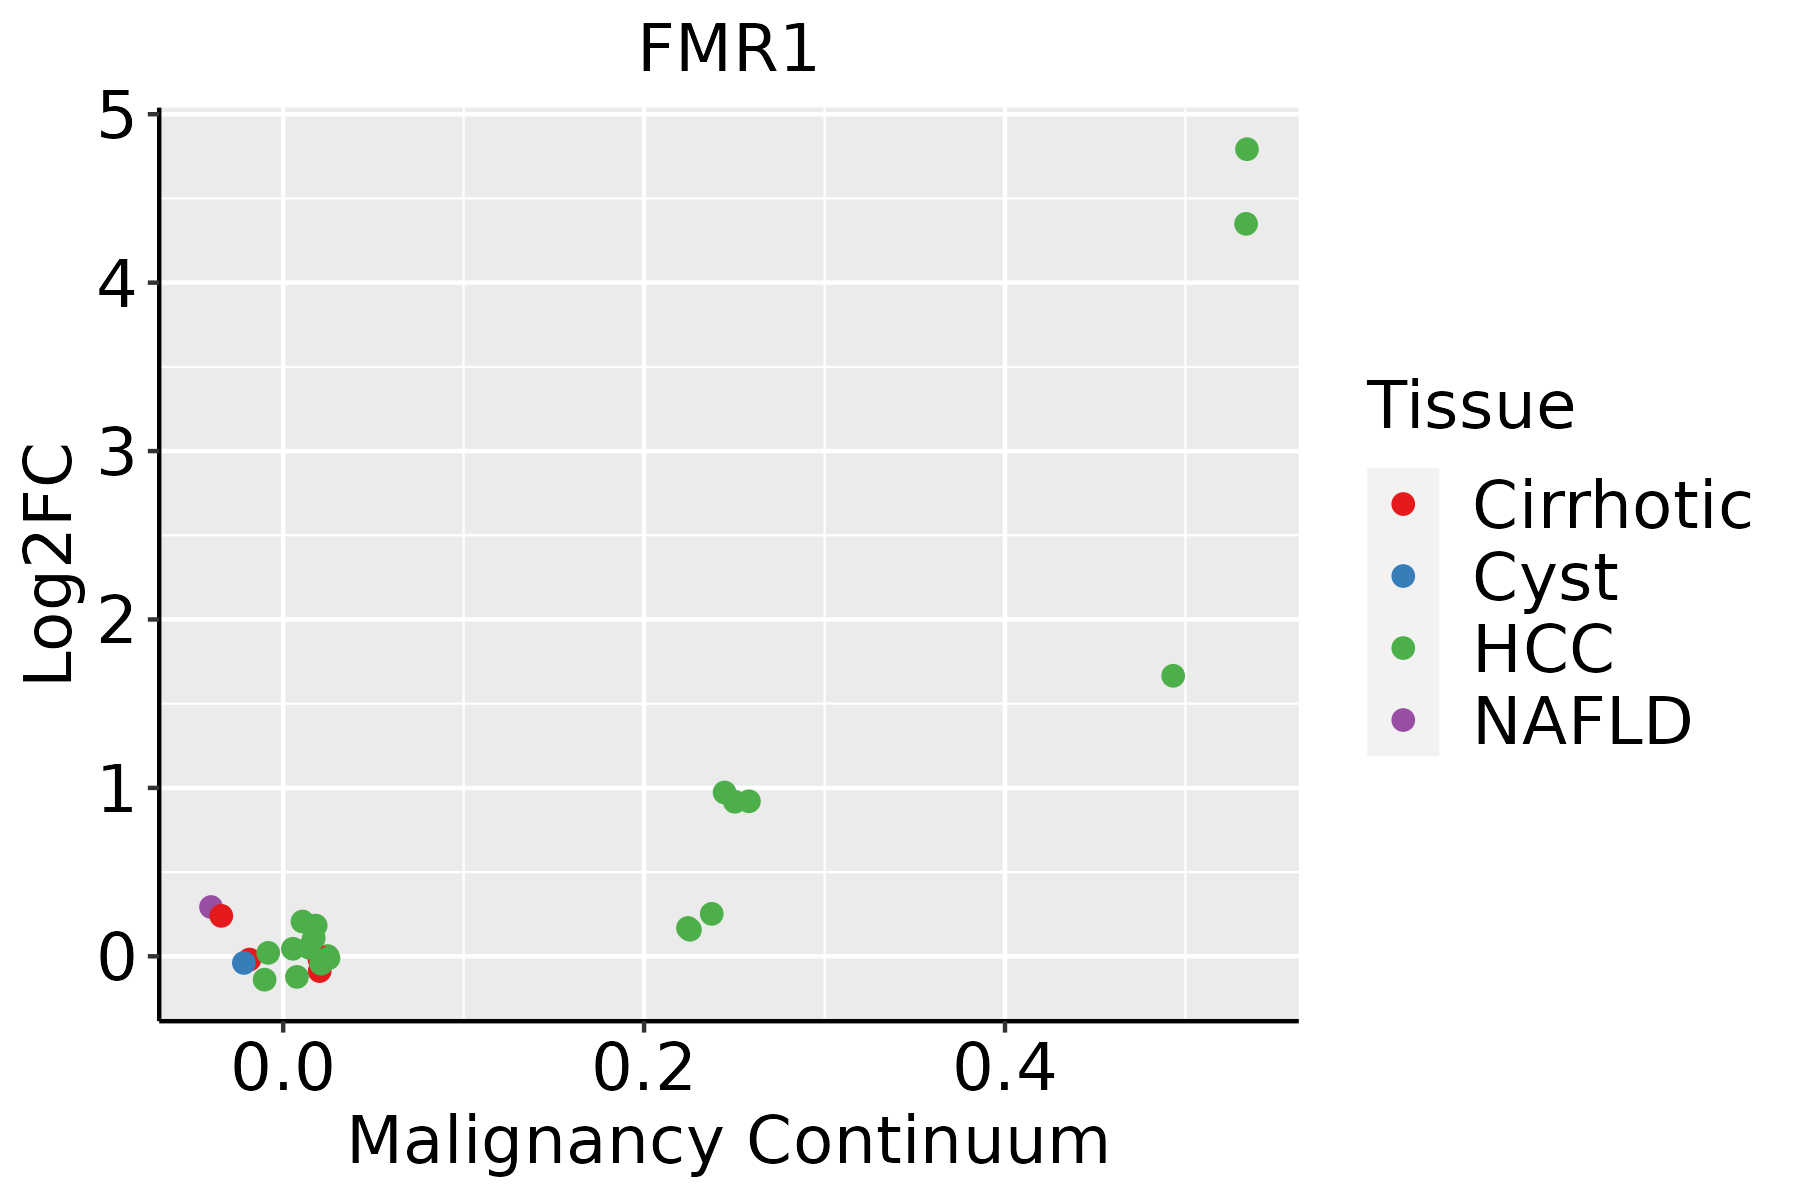 | HCC: Hepatocellular carcinoma |
| NAFLD: Non-alcoholic fatty liver disease | ||
| Oral Cavity | 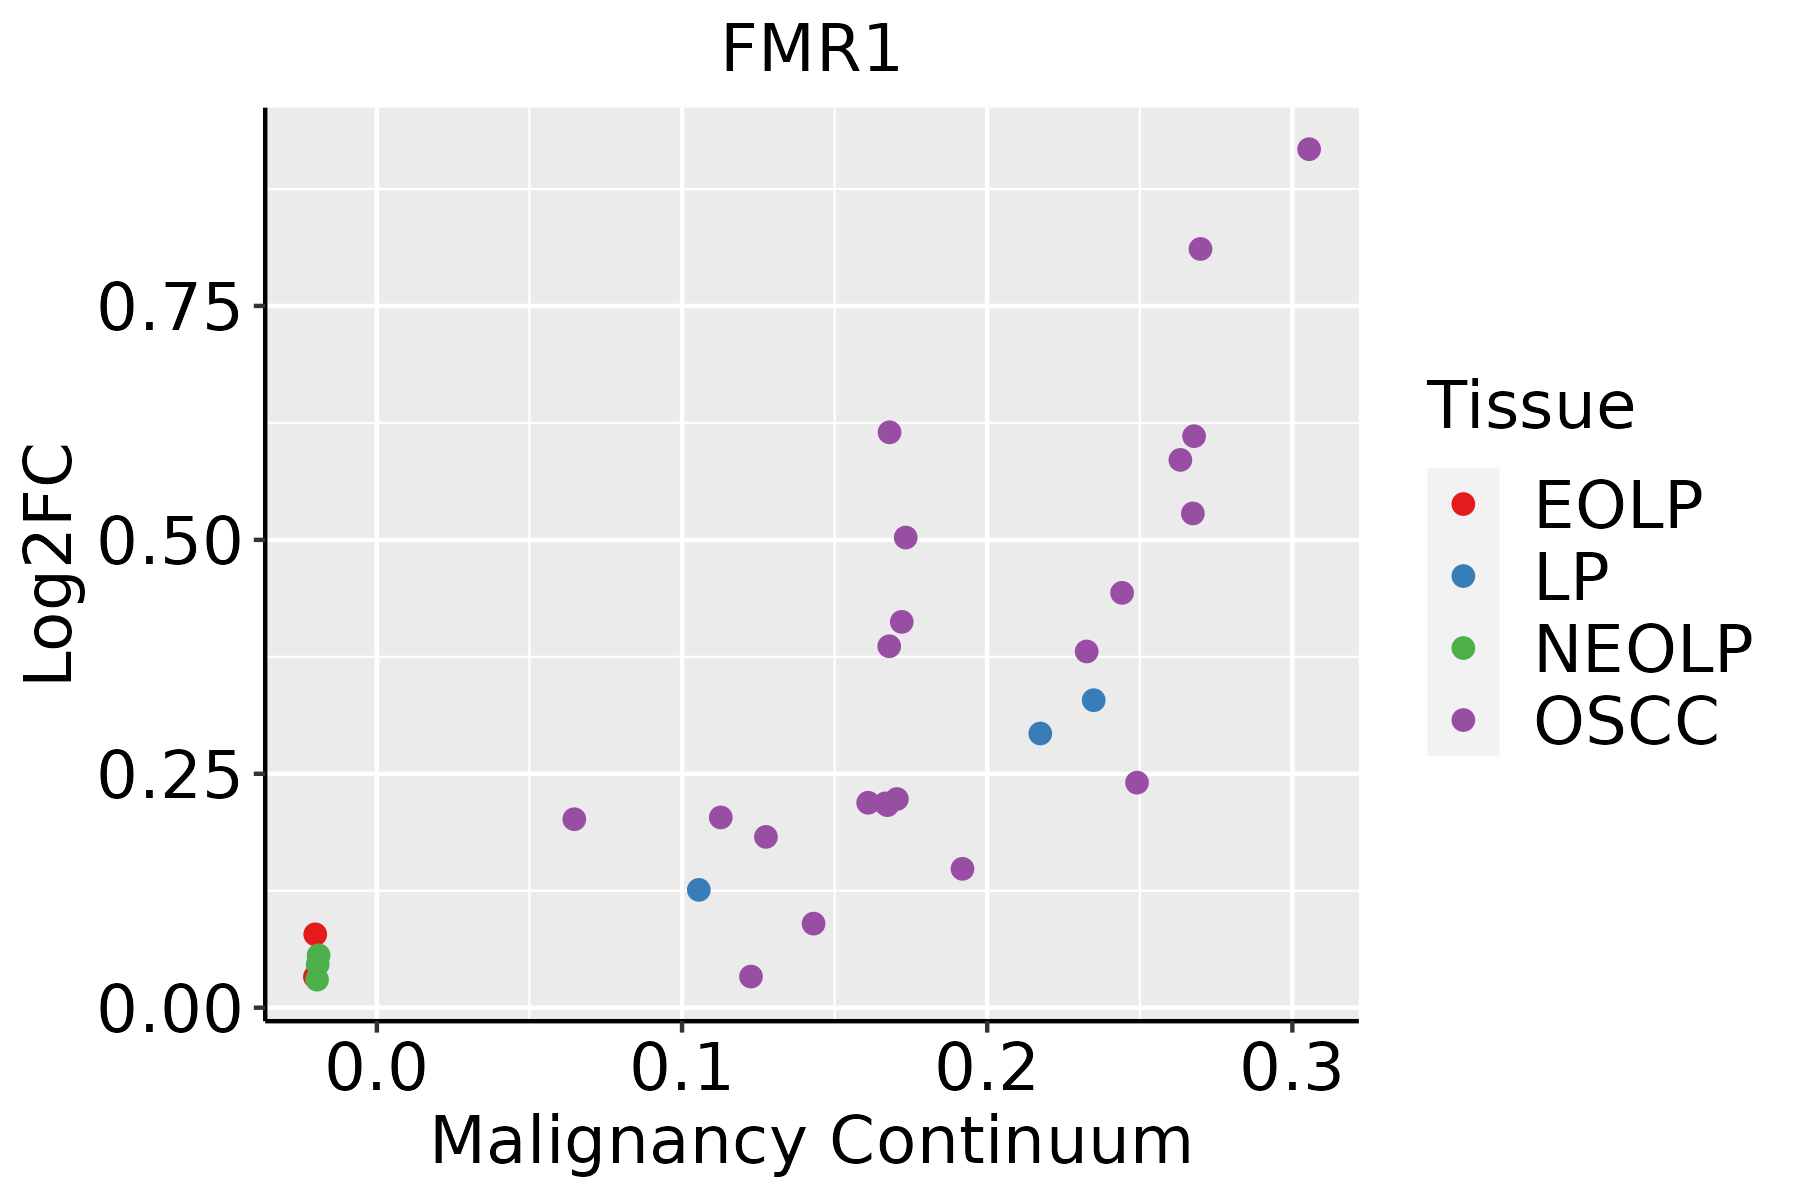 | EOLP: Erosive Oral lichen planus |
| LP: leukoplakia | ||
| NEOLP: Non-erosive oral lichen planus | ||
| OSCC: Oral squamous cell carcinoma | ||
| Thyroid | 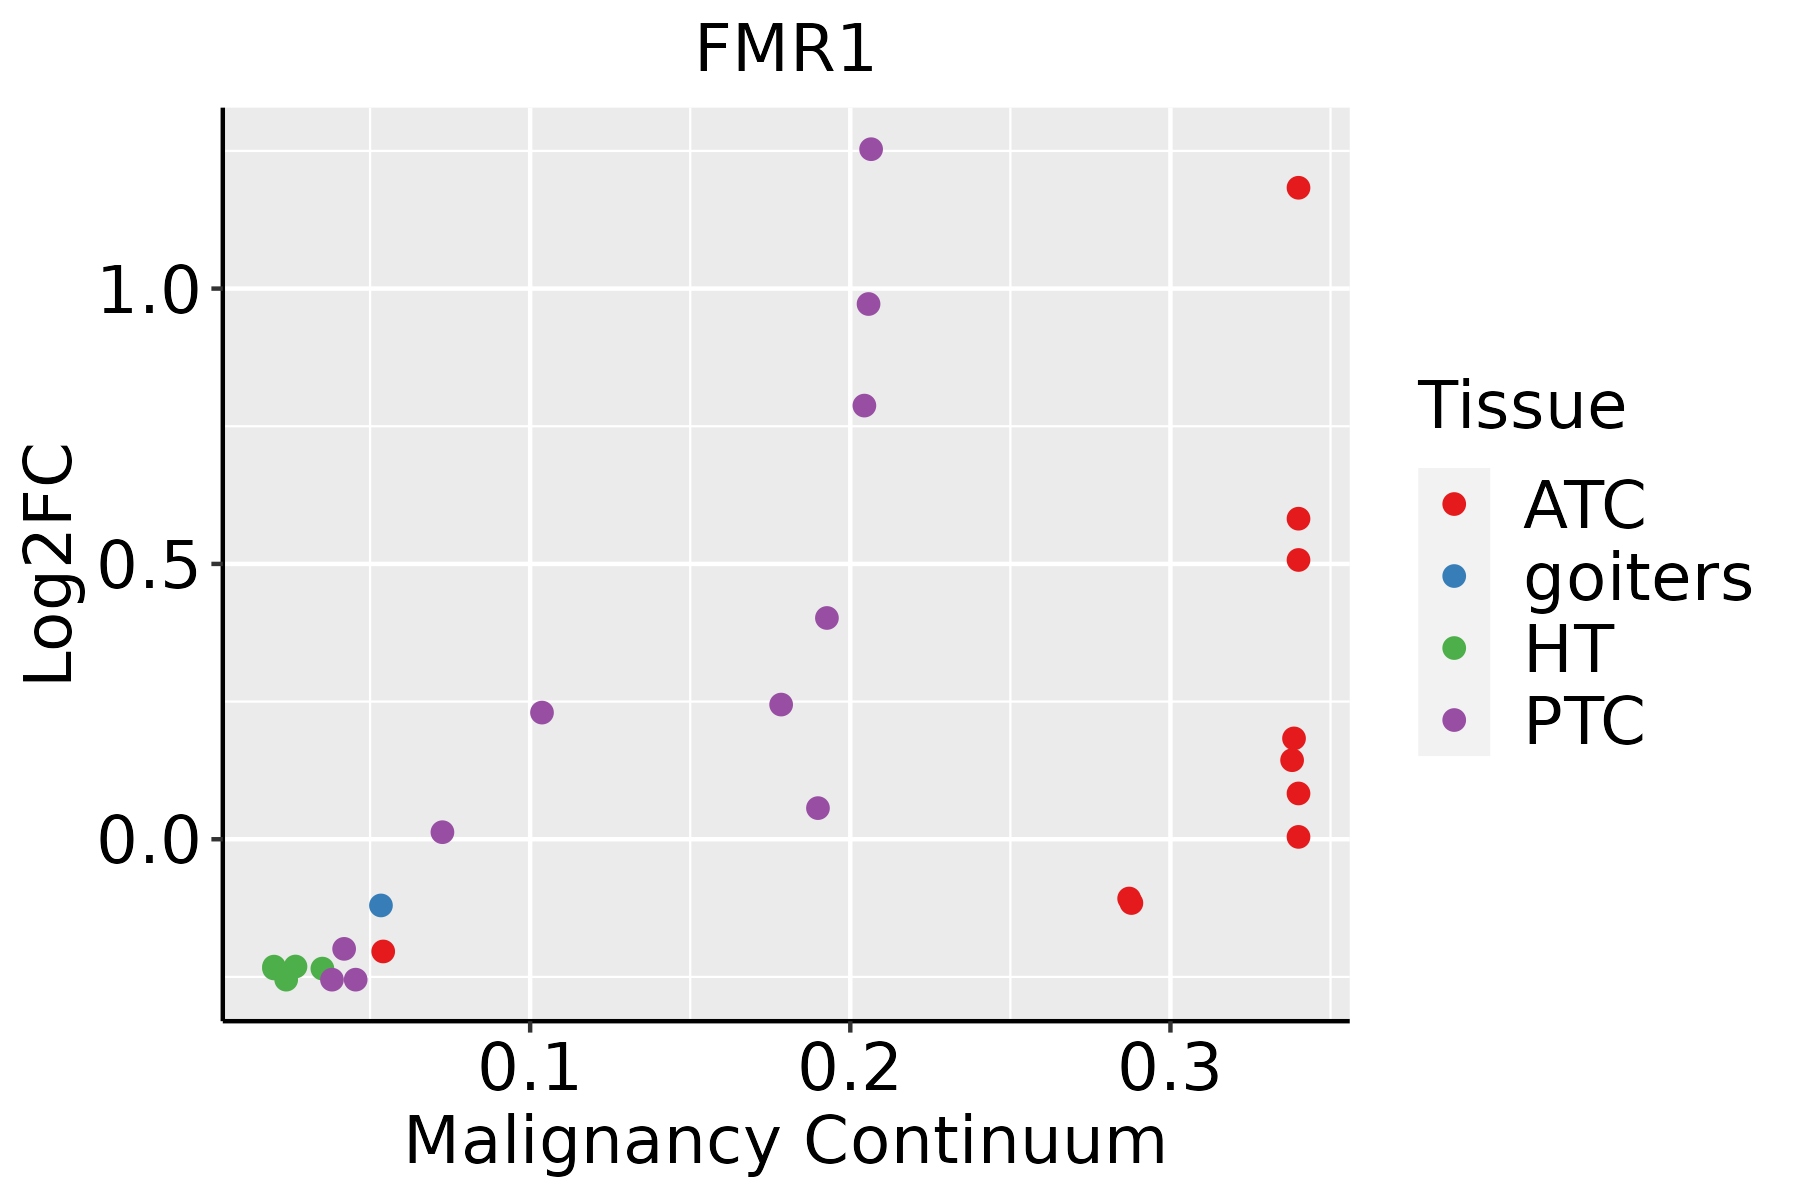 | ATC: Anaplastic thyroid cancer |
| HT: Hashimoto's thyroiditis | ||
| PTC: Papillary thyroid cancer |
| ∗log2FC in expression of this searched gene in stem-like cells from each diseased tissue sample relative to stem-like cells in normal samples in each tissue plotted against the malignancy continuum. Samples are colored based on if they are from different disease stage. |
Top |
Malignant transformation related pathway analysis |
| Find out the enriched GO biological processes and KEGG pathways involved in transition from healthy to precancer to cancer |
| Tissue | Disease Stage | Enriched GO biological Processes |
| Colorectum | AD |  |
| Colorectum | SER |  |
| Colorectum | MSS |  |
| Colorectum | MSI-H |  |
| Colorectum | FAP |  |
| ∗Top 15 enriched GO BP terms are showed in the bar plot of each disease state in each tissue. Each row represents a significant GO biological process which is colored according to the -log10(p.adjust). |
| Page: 1 2 3 4 5 6 7 8 9 |
| GO ID | Tissue | Disease Stage | Description | Gene Ratio | Bg Ratio | pvalue | p.adjust | Count |
| GO:0008380111 | Esophagus | ESCC | RNA splicing | 336/8552 | 434/18723 | 1.74e-42 | 3.67e-39 | 336 |
| GO:0010498111 | Esophagus | ESCC | proteasomal protein catabolic process | 369/8552 | 490/18723 | 1.13e-41 | 1.80e-38 | 369 |
| GO:0002181111 | Esophagus | ESCC | cytoplasmic translation | 135/8552 | 148/18723 | 4.17e-32 | 2.65e-29 | 135 |
| GO:0000375111 | Esophagus | ESCC | RNA splicing, via transesterification reactions | 248/8552 | 324/18723 | 3.05e-30 | 1.49e-27 | 248 |
| GO:0000377111 | Esophagus | ESCC | RNA splicing, via transesterification reactions with bulged adenosine as nucleophile | 244/8552 | 320/18723 | 2.52e-29 | 1.07e-26 | 244 |
| GO:0000398111 | Esophagus | ESCC | mRNA splicing, via spliceosome | 244/8552 | 320/18723 | 2.52e-29 | 1.07e-26 | 244 |
| GO:0016032111 | Esophagus | ESCC | viral process | 301/8552 | 415/18723 | 3.34e-29 | 1.32e-26 | 301 |
| GO:0006403110 | Esophagus | ESCC | RNA localization | 166/8552 | 201/18723 | 1.95e-27 | 6.18e-25 | 166 |
| GO:001657015 | Esophagus | ESCC | histone modification | 323/8552 | 463/18723 | 2.61e-26 | 7.88e-24 | 323 |
| GO:0042176111 | Esophagus | ESCC | regulation of protein catabolic process | 280/8552 | 391/18723 | 8.65e-26 | 2.39e-23 | 280 |
| GO:0009896111 | Esophagus | ESCC | positive regulation of catabolic process | 332/8552 | 492/18723 | 4.36e-23 | 9.22e-21 | 332 |
| GO:0031331111 | Esophagus | ESCC | positive regulation of cellular catabolic process | 292/8552 | 427/18723 | 8.67e-22 | 1.53e-19 | 292 |
| GO:1903311110 | Esophagus | ESCC | regulation of mRNA metabolic process | 210/8552 | 288/18723 | 3.25e-21 | 5.56e-19 | 210 |
| GO:0006401110 | Esophagus | ESCC | RNA catabolic process | 204/8552 | 278/18723 | 3.39e-21 | 5.66e-19 | 204 |
| GO:0019058111 | Esophagus | ESCC | viral life cycle | 226/8552 | 317/18723 | 1.17e-20 | 1.76e-18 | 226 |
| GO:005123617 | Esophagus | ESCC | establishment of RNA localization | 134/8552 | 166/18723 | 1.23e-20 | 1.81e-18 | 134 |
| GO:005102815 | Esophagus | ESCC | mRNA transport | 110/8552 | 130/18723 | 2.76e-20 | 3.80e-18 | 110 |
| GO:1903362111 | Esophagus | ESCC | regulation of cellular protein catabolic process | 188/8552 | 255/18723 | 5.12e-20 | 6.62e-18 | 188 |
| GO:0051098111 | Esophagus | ESCC | regulation of binding | 251/8552 | 363/18723 | 6.73e-20 | 8.46e-18 | 251 |
| GO:005065717 | Esophagus | ESCC | nucleic acid transport | 131/8552 | 163/18723 | 6.94e-20 | 8.46e-18 | 131 |
| Page: 1 2 3 4 5 6 7 8 9 10 11 12 13 14 15 16 17 18 19 20 21 22 23 24 25 26 27 28 29 30 31 32 |
| Pathway ID | Tissue | Disease Stage | Description | Gene Ratio | Bg Ratio | pvalue | p.adjust | qvalue | Count |
| Page: 1 |
Top |
Cell-cell communication analysis |
| Identification of potential cell-cell interactions between two cell types and their ligand-receptor pairs for different disease states |
| Ligand | Receptor | LRpair | Pathway | Tissue | Disease Stage |
| Page: 1 |
Top |
Single-cell gene regulatory network inference analysis |
| Find out the significant the regulons (TFs) and the target genes of each regulon across cell types for different disease states |
| TF | Cell Type | Tissue | Disease Stage | Target Gene | RSS | Regulon Activity |
| ∗The dot plots of a searched regulon are shown for all cell subpopulations in each disease state of each tissue based on the regulon specific score inferred using pySCENIC and by calculating the average expression. |
| Page: 1 |
Top |
Somatic mutation of malignant transformation related genes |
| Annotation of somatic variants for genes involved in malignant transformation |
| Hugo Symbol | Variant Class | Variant Classification | dbSNP RS | HGVSc | HGVSp | HGVSp Short | SWISSPROT | BIOTYPE | SIFT | PolyPhen | Tumor Sample Barcode | Tissue | Histology | Sex | Age | Stage | Therapy Types | Drugs | Outcome |
| FMR1 | SNV | Missense_Mutation | c.763N>G | p.Leu255Val | p.L255V | Q06787 | protein_coding | tolerated(0.08) | possibly_damaging(0.856) | TCGA-5L-AAT1-01 | Breast | breast invasive carcinoma | Female | <65 | III/IV | Hormone Therapy | letrozol | SD | |
| FMR1 | SNV | Missense_Mutation | novel | c.215N>C | p.Asn72Thr | p.N72T | Q06787 | protein_coding | tolerated(0.05) | probably_damaging(0.994) | TCGA-A1-A0SH-01 | Breast | breast invasive carcinoma | Female | <65 | I/II | Chemotherapy | tc | SD |
| FMR1 | SNV | Missense_Mutation | c.1822N>T | p.Gly608Cys | p.G608C | Q06787 | protein_coding | deleterious_low_confidence(0.02) | probably_damaging(0.935) | TCGA-A7-A56D-01 | Breast | breast invasive carcinoma | Female | >=65 | I/II | Hormone Therapy | arimidex | SD | |
| FMR1 | SNV | Missense_Mutation | rs782738200 | c.1580G>A | p.Arg527His | p.R527H | Q06787 | protein_coding | deleterious(0.01) | probably_damaging(0.999) | TCGA-B6-A401-01 | Breast | breast invasive carcinoma | Female | <65 | I/II | Chemotherapy | cyclophosphamide | SD |
| FMR1 | SNV | Missense_Mutation | c.1525N>A | p.Glu509Lys | p.E509K | Q06787 | protein_coding | tolerated(0.11) | probably_damaging(0.998) | TCGA-BH-A0HA-01 | Breast | breast invasive carcinoma | Female | <65 | I/II | Unknown | Unknown | SD | |
| FMR1 | SNV | Missense_Mutation | c.859N>G | p.Gln287Glu | p.Q287E | Q06787 | protein_coding | deleterious(0.03) | benign(0.214) | TCGA-C8-A12K-01 | Breast | breast invasive carcinoma | Female | >=65 | I/II | Unknown | Unknown | SD | |
| FMR1 | SNV | Missense_Mutation | novel | c.283N>A | p.Glu95Lys | p.E95K | Q06787 | protein_coding | tolerated(0.09) | benign(0.03) | TCGA-D8-A1JA-01 | Breast | breast invasive carcinoma | Female | <65 | III/IV | Chemotherapy | adriamycin | PD |
| FMR1 | SNV | Missense_Mutation | c.690G>T | p.Met230Ile | p.M230I | Q06787 | protein_coding | tolerated(0.05) | possibly_damaging(0.519) | TCGA-D8-A1JD-01 | Breast | breast invasive carcinoma | Female | <65 | I/II | Chemotherapy | adriamycin | SD | |
| FMR1 | SNV | Missense_Mutation | c.691G>A | p.Gly231Ser | p.G231S | Q06787 | protein_coding | deleterious(0) | probably_damaging(1) | TCGA-D8-A1JD-01 | Breast | breast invasive carcinoma | Female | <65 | I/II | Chemotherapy | adriamycin | SD | |
| FMR1 | SNV | Missense_Mutation | c.1525N>A | p.Glu509Lys | p.E509K | Q06787 | protein_coding | tolerated(0.11) | probably_damaging(0.998) | TCGA-EK-A2RJ-01 | Cervix | cervical & endocervical cancer | Female | <65 | I/II | Unknown | Unknown | SD |
| Page: 1 2 3 4 5 6 7 8 9 10 11 12 13 |
Top |
Related drugs of malignant transformation related genes |
| Identification of chemicals and drugs interact with genes involved in malignant transfromation |
| (DGIdb 4.0) |
| Entrez ID | Symbol | Category | Interaction Types | Drug Claim Name | Drug Name | PMIDs |
| Page: 1 |

Copyright 2023-Present -The University of Texas Health Science Center at Houston |