
|
|||||
|
 | |
| |
| |
| |
| |
| |
|
Gene: FMOD |
Gene summary for FMOD |
| Gene information | Species | Human | Gene symbol | FMOD | Gene ID | 2331 |
| Gene name | fibromodulin | |
| Gene Alias | FM | |
| Cytomap | 1q32.1 | |
| Gene Type | protein-coding | GO ID | GO:0007154 | UniProtAcc | A0A024R971 |
Top |
Malignant transformation analysis |
| Identification of the aberrant gene expression in precancerous and cancerous lesions by comparing the gene expression of stem-like cells in diseased tissues with normal stem cells |
| Entrez ID | Symbol | Replicates | Species | Organ | Tissue | Adj P-value | Log2FC | Malignancy |
| 2331 | FMOD | HTA11_78_2000001011 | Human | Colorectum | AD | 1.29e-02 | 1.55e-01 | -0.1088 |
| 2331 | FMOD | HTA11_696_2000001011 | Human | Colorectum | AD | 1.63e-22 | 5.21e-01 | -0.1464 |
| 2331 | FMOD | HTA11_866_2000001011 | Human | Colorectum | AD | 1.92e-04 | 1.59e-01 | -0.1001 |
| 2331 | FMOD | HTA11_546_2000001011 | Human | Colorectum | AD | 2.22e-03 | 1.94e-01 | -0.0842 |
| 2331 | FMOD | HTA11_866_3004761011 | Human | Colorectum | AD | 2.81e-14 | 3.60e-01 | 0.096 |
| 2331 | FMOD | HTA11_4255_2000001011 | Human | Colorectum | SER | 3.43e-02 | 2.17e-01 | 0.0446 |
| 2331 | FMOD | HTA11_99999970781_79442 | Human | Colorectum | MSS | 9.36e-06 | 1.56e-01 | 0.294 |
| 2331 | FMOD | HTA11_99999965104_69814 | Human | Colorectum | MSS | 5.30e-03 | 1.51e-01 | 0.281 |
| 2331 | FMOD | HTA11_99999971662_82457 | Human | Colorectum | MSS | 9.36e-06 | 1.53e-01 | 0.3859 |
| 2331 | FMOD | Adj_PTCwithHT_6 | Human | Thyroid | HT | 6.90e-05 | -2.37e-01 | 0.02 |
| 2331 | FMOD | PTCwithHT_6 | Human | Thyroid | HT | 4.72e-04 | -2.42e-01 | 0.02 |
| 2331 | FMOD | PTCwithHT_8 | Human | Thyroid | HT | 9.11e-04 | -2.33e-01 | 0.0351 |
| 2331 | FMOD | PTCwithoutHT_2 | Human | Thyroid | PTC | 5.85e-06 | -2.54e-01 | 0.0419 |
| 2331 | FMOD | male-WTA | Human | Thyroid | PTC | 6.42e-05 | -1.47e-01 | 0.1037 |
| 2331 | FMOD | PTC01 | Human | Thyroid | PTC | 1.75e-05 | -2.17e-01 | 0.1899 |
| 2331 | FMOD | PTC07 | Human | Thyroid | PTC | 2.75e-09 | -1.65e-01 | 0.2044 |
| 2331 | FMOD | ATC12 | Human | Thyroid | ATC | 3.57e-05 | -2.00e-01 | 0.34 |
| 2331 | FMOD | ATC13 | Human | Thyroid | ATC | 4.67e-14 | 4.61e-01 | 0.34 |
| 2331 | FMOD | ATC4 | Human | Thyroid | ATC | 2.04e-06 | -1.69e-01 | 0.34 |
| 2331 | FMOD | ATC5 | Human | Thyroid | ATC | 9.34e-18 | 5.30e-01 | 0.34 |
| Page: 1 |
| Tissue | Expression Dynamics | Abbreviation |
| Colorectum (GSE201348) |  | FAP: Familial adenomatous polyposis |
| CRC: Colorectal cancer | ||
| Colorectum (HTA11) | 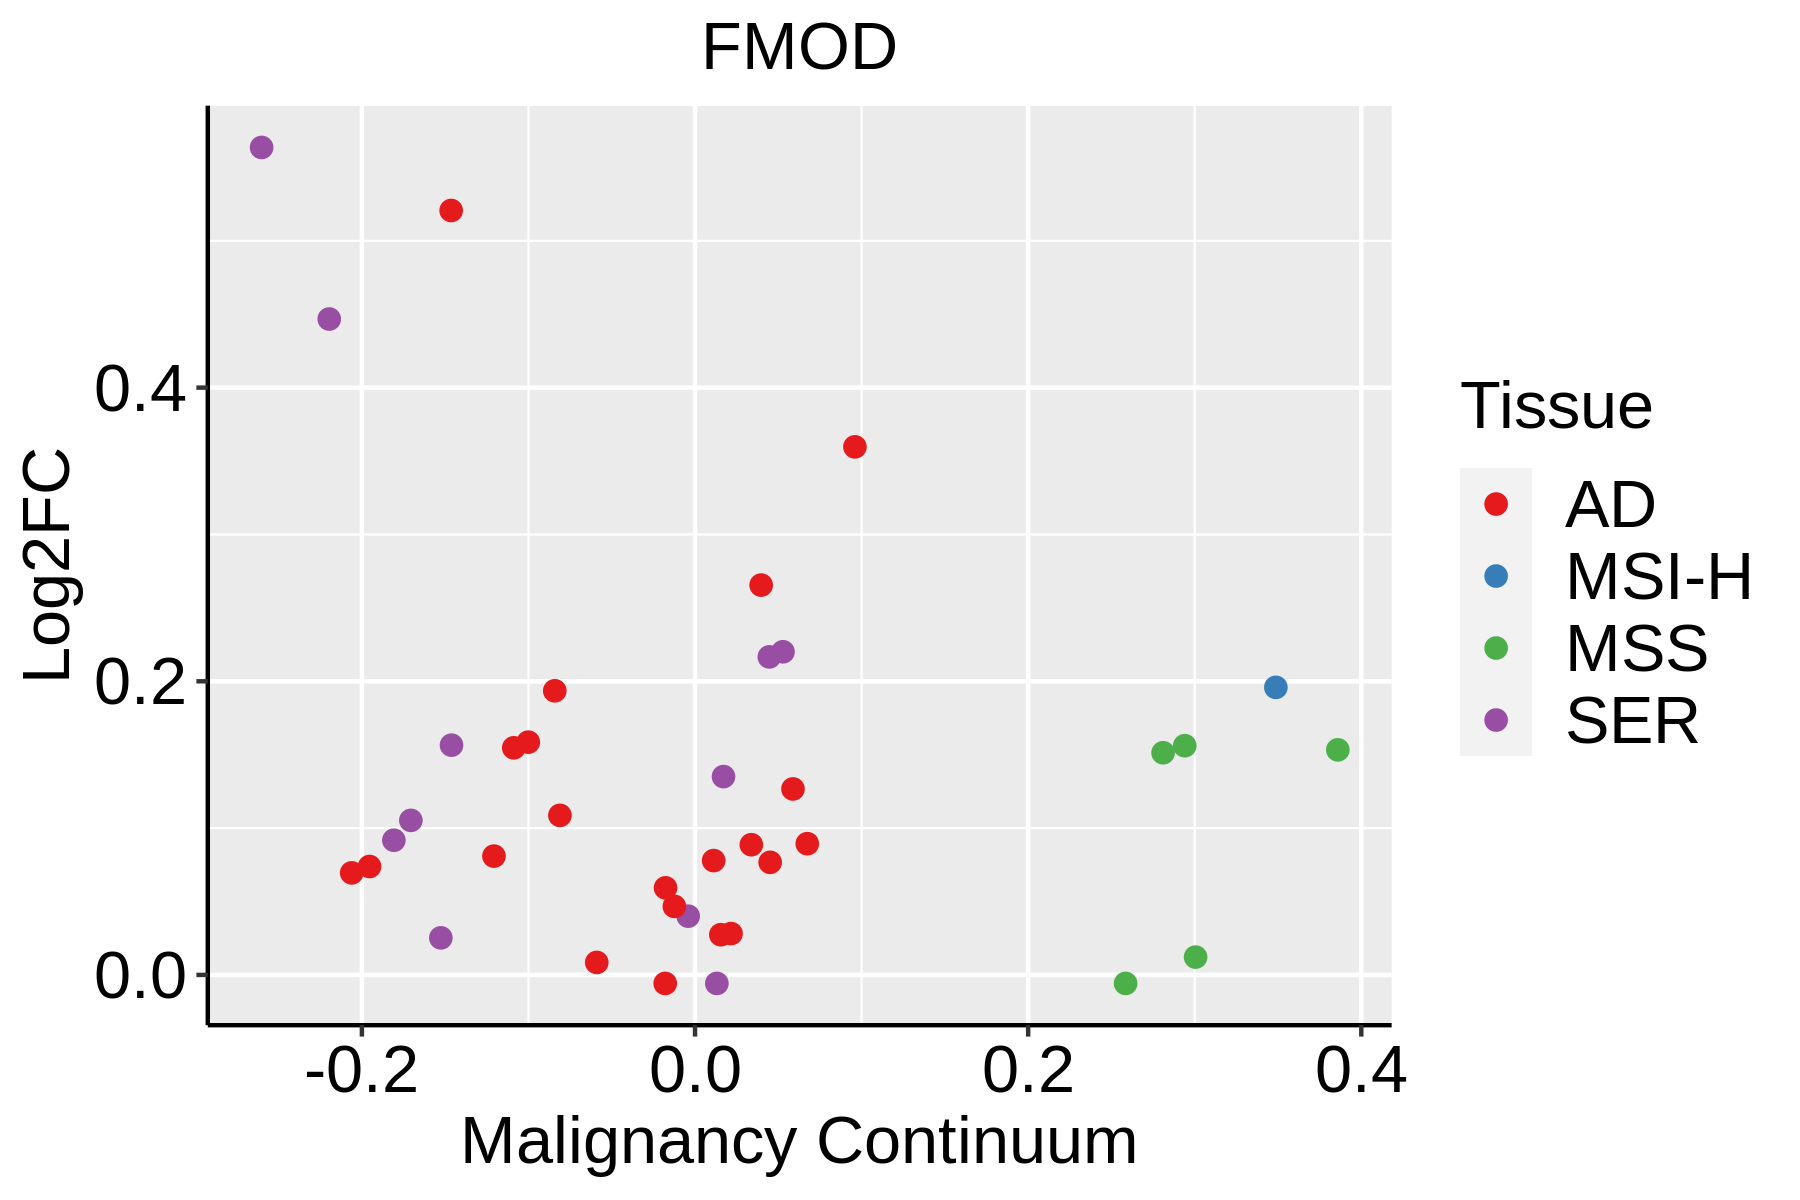 | AD: Adenomas |
| SER: Sessile serrated lesions | ||
| MSI-H: Microsatellite-high colorectal cancer | ||
| MSS: Microsatellite stable colorectal cancer | ||
| Thyroid |  | ATC: Anaplastic thyroid cancer |
| HT: Hashimoto's thyroiditis | ||
| PTC: Papillary thyroid cancer |
| ∗log2FC in expression of this searched gene in stem-like cells from each diseased tissue sample relative to stem-like cells in normal samples in each tissue plotted against the malignancy continuum. Samples are colored based on if they are from different disease stage. |
Top |
Malignant transformation related pathway analysis |
| Find out the enriched GO biological processes and KEGG pathways involved in transition from healthy to precancer to cancer |
| Tissue | Disease Stage | Enriched GO biological Processes |
| Colorectum | AD |  |
| Colorectum | SER |  |
| Colorectum | MSS |  |
| Colorectum | MSI-H |  |
| Colorectum | FAP |  |
| ∗Top 15 enriched GO BP terms are showed in the bar plot of each disease state in each tissue. Each row represents a significant GO biological process which is colored according to the -log10(p.adjust). |
| Page: 1 2 3 4 5 6 7 8 9 |
| GO ID | Tissue | Disease Stage | Description | Gene Ratio | Bg Ratio | pvalue | p.adjust | Count |
| GO:0007178 | Colorectum | AD | transmembrane receptor protein serine/threonine kinase signaling pathway | 99/3918 | 355/18723 | 9.92e-04 | 9.28e-03 | 99 |
| GO:0071559 | Colorectum | AD | response to transforming growth factor beta | 74/3918 | 256/18723 | 1.45e-03 | 1.23e-02 | 74 |
| GO:0071560 | Colorectum | AD | cellular response to transforming growth factor beta stimulus | 72/3918 | 250/18723 | 1.85e-03 | 1.52e-02 | 72 |
| GO:0007179 | Colorectum | AD | transforming growth factor beta receptor signaling pathway | 59/3918 | 198/18723 | 1.94e-03 | 1.58e-02 | 59 |
| GO:00071781 | Colorectum | MSS | transmembrane receptor protein serine/threonine kinase signaling pathway | 86/3467 | 355/18723 | 4.04e-03 | 2.95e-02 | 86 |
| GO:007155918 | Thyroid | HT | response to transforming growth factor beta | 35/1272 | 256/18723 | 6.03e-05 | 1.13e-03 | 35 |
| GO:007156018 | Thyroid | HT | cellular response to transforming growth factor beta stimulus | 34/1272 | 250/18723 | 8.48e-05 | 1.46e-03 | 34 |
| GO:000717818 | Thyroid | HT | transmembrane receptor protein serine/threonine kinase signaling pathway | 42/1272 | 355/18723 | 3.21e-04 | 4.20e-03 | 42 |
| GO:000717918 | Thyroid | HT | transforming growth factor beta receptor signaling pathway | 26/1272 | 198/18723 | 9.39e-04 | 9.80e-03 | 26 |
| GO:007155919 | Thyroid | PTC | response to transforming growth factor beta | 131/5968 | 256/18723 | 9.20e-11 | 3.17e-09 | 131 |
| GO:007156019 | Thyroid | PTC | cellular response to transforming growth factor beta stimulus | 126/5968 | 250/18723 | 7.34e-10 | 2.19e-08 | 126 |
| GO:000717919 | Thyroid | PTC | transforming growth factor beta receptor signaling pathway | 104/5968 | 198/18723 | 1.20e-09 | 3.47e-08 | 104 |
| GO:000717819 | Thyroid | PTC | transmembrane receptor protein serine/threonine kinase signaling pathway | 156/5968 | 355/18723 | 1.02e-06 | 1.51e-05 | 156 |
| GO:00301986 | Thyroid | PTC | extracellular matrix organization | 124/5968 | 301/18723 | 3.75e-04 | 2.53e-03 | 124 |
| GO:00430626 | Thyroid | PTC | extracellular structure organization | 124/5968 | 302/18723 | 4.38e-04 | 2.92e-03 | 124 |
| GO:00452296 | Thyroid | PTC | external encapsulating structure organization | 124/5968 | 304/18723 | 5.96e-04 | 3.79e-03 | 124 |
| GO:00301995 | Thyroid | PTC | collagen fibril organization | 29/5968 | 61/18723 | 7.57e-03 | 3.23e-02 | 29 |
| GO:007155925 | Thyroid | ATC | response to transforming growth factor beta | 142/6293 | 256/18723 | 4.30e-13 | 1.94e-11 | 142 |
| GO:007156026 | Thyroid | ATC | cellular response to transforming growth factor beta stimulus | 137/6293 | 250/18723 | 3.69e-12 | 1.49e-10 | 137 |
| GO:000717924 | Thyroid | ATC | transforming growth factor beta receptor signaling pathway | 112/6293 | 198/18723 | 2.42e-11 | 8.44e-10 | 112 |
| Page: 1 2 |
| Pathway ID | Tissue | Disease Stage | Description | Gene Ratio | Bg Ratio | pvalue | p.adjust | qvalue | Count |
| hsa04350 | Colorectum | SER | TGF-beta signaling pathway | 31/1580 | 108/8465 | 7.00e-03 | 3.77e-02 | 2.74e-02 | 31 |
| hsa043501 | Colorectum | SER | TGF-beta signaling pathway | 31/1580 | 108/8465 | 7.00e-03 | 3.77e-02 | 2.74e-02 | 31 |
| Page: 1 |
Top |
Cell-cell communication analysis |
| Identification of potential cell-cell interactions between two cell types and their ligand-receptor pairs for different disease states |
| Ligand | Receptor | LRpair | Pathway | Tissue | Disease Stage |
| Page: 1 |
Top |
Single-cell gene regulatory network inference analysis |
| Find out the significant the regulons (TFs) and the target genes of each regulon across cell types for different disease states |
| TF | Cell Type | Tissue | Disease Stage | Target Gene | RSS | Regulon Activity |
| ∗The dot plots of a searched regulon are shown for all cell subpopulations in each disease state of each tissue based on the regulon specific score inferred using pySCENIC and by calculating the average expression. |
| Page: 1 |
Top |
Somatic mutation of malignant transformation related genes |
| Annotation of somatic variants for genes involved in malignant transformation |
| Hugo Symbol | Variant Class | Variant Classification | dbSNP RS | HGVSc | HGVSp | HGVSp Short | SWISSPROT | BIOTYPE | SIFT | PolyPhen | Tumor Sample Barcode | Tissue | Histology | Sex | Age | Stage | Therapy Types | Drugs | Outcome |
| FMOD | SNV | Missense_Mutation | rs369136071 | c.821N>A | p.Arg274Gln | p.R274Q | Q06828 | protein_coding | deleterious(0) | probably_damaging(0.999) | TCGA-AR-A1AJ-01 | Breast | breast invasive carcinoma | Female | >=65 | I/II | Unknown | Unknown | SD |
| FMOD | SNV | Missense_Mutation | novel | c.102N>C | p.Gln34His | p.Q34H | Q06828 | protein_coding | tolerated(0.14) | benign(0.4) | TCGA-AR-A2LE-01 | Breast | breast invasive carcinoma | Female | >=65 | I/II | Hormone Therapy | tamoxiphen | PD |
| FMOD | SNV | Missense_Mutation | novel | c.1039G>T | p.Val347Leu | p.V347L | Q06828 | protein_coding | tolerated(0.3) | benign(0.292) | TCGA-AR-A2LQ-01 | Breast | breast invasive carcinoma | Female | <65 | I/II | Chemotherapy | docetaxel | SD |
| FMOD | SNV | Missense_Mutation | rs769441362 | c.993C>A | p.Ser331Arg | p.S331R | Q06828 | protein_coding | deleterious(0.04) | possibly_damaging(0.69) | TCGA-D8-A1JG-01 | Breast | breast invasive carcinoma | Female | <65 | I/II | Chemotherapy | doxorubicin | SD |
| FMOD | insertion | Frame_Shift_Ins | novel | c.799_800insG | p.Ala267GlyfsTer31 | p.A267Gfs*31 | Q06828 | protein_coding | TCGA-B6-A0IA-01 | Breast | breast invasive carcinoma | Female | <65 | I/II | Unknown | Unknown | SD | ||
| FMOD | SNV | Missense_Mutation | c.688C>G | p.Leu230Val | p.L230V | Q06828 | protein_coding | tolerated(0.22) | benign(0.04) | TCGA-IR-A3LL-01 | Cervix | cervical & endocervical cancer | Female | <65 | I/II | Chemotherapy | cisplatin | CR | |
| FMOD | SNV | Missense_Mutation | rs200924838 | c.820C>T | p.Arg274Trp | p.R274W | Q06828 | protein_coding | deleterious(0) | probably_damaging(1) | TCGA-A6-5661-01 | Colorectum | colon adenocarcinoma | Female | >=65 | I/II | Unknown | Unknown | SD |
| FMOD | SNV | Missense_Mutation | rs376310218 | c.316N>T | p.Arg106Cys | p.R106C | Q06828 | protein_coding | deleterious(0.03) | probably_damaging(0.994) | TCGA-AA-3947-01 | Colorectum | colon adenocarcinoma | Female | <65 | I/II | Unknown | Unknown | SD |
| FMOD | SNV | Missense_Mutation | c.298N>A | p.Leu100Met | p.L100M | Q06828 | protein_coding | tolerated(0.45) | benign(0.133) | TCGA-D5-6927-01 | Colorectum | colon adenocarcinoma | Male | <65 | I/II | Unknown | Unknown | SD | |
| FMOD | SNV | Missense_Mutation | c.208N>T | p.Pro70Ser | p.P70S | Q06828 | protein_coding | tolerated(0.62) | benign(0.01) | TCGA-F4-6570-01 | Colorectum | colon adenocarcinoma | Female | >=65 | I/II | Unknown | Unknown | SD |
| Page: 1 2 3 4 5 6 |
Top |
Related drugs of malignant transformation related genes |
| Identification of chemicals and drugs interact with genes involved in malignant transfromation |
| (DGIdb 4.0) |
| Entrez ID | Symbol | Category | Interaction Types | Drug Claim Name | Drug Name | PMIDs |
| Page: 1 |

Copyright 2023-Present -The University of Texas Health Science Center at Houston |