
|
|||||
|
 | |
| |
| |
| |
| |
| |
|
Gene: FMO5 |
Gene summary for FMO5 |
| Gene information | Species | Human | Gene symbol | FMO5 | Gene ID | 2330 |
| Gene name | flavin containing dimethylaniline monoxygenase 5 | |
| Gene Alias | hBVMO1 | |
| Cytomap | 1q21.1 | |
| Gene Type | protein-coding | GO ID | GO:0006066 | UniProtAcc | P49326 |
Top |
Malignant transformation analysis |
| Identification of the aberrant gene expression in precancerous and cancerous lesions by comparing the gene expression of stem-like cells in diseased tissues with normal stem cells |
| Entrez ID | Symbol | Replicates | Species | Organ | Tissue | Adj P-value | Log2FC | Malignancy |
| 2330 | FMO5 | NAFLD1 | Human | Liver | NAFLD | 1.32e-08 | 9.93e-01 | -0.04 |
| 2330 | FMO5 | S41 | Human | Liver | Cirrhotic | 8.60e-09 | 7.85e-01 | -0.0343 |
| 2330 | FMO5 | S43 | Human | Liver | Cirrhotic | 2.36e-14 | -3.98e-02 | -0.0187 |
| 2330 | FMO5 | S44 | Human | Liver | HCC | 1.78e-03 | 5.03e-01 | -0.0083 |
| 2330 | FMO5 | HCC1_Meng | Human | Liver | HCC | 3.80e-45 | -2.34e-01 | 0.0246 |
| 2330 | FMO5 | HCC2_Meng | Human | Liver | HCC | 1.02e-20 | -1.79e-01 | 0.0107 |
| 2330 | FMO5 | cirrhotic2 | Human | Liver | Cirrhotic | 5.40e-05 | -2.06e-02 | 0.0201 |
| 2330 | FMO5 | HCC1 | Human | Liver | HCC | 3.64e-26 | 5.19e+00 | 0.5336 |
| 2330 | FMO5 | HCC2 | Human | Liver | HCC | 4.01e-13 | 3.21e+00 | 0.5341 |
| 2330 | FMO5 | Pt13.b | Human | Liver | HCC | 7.83e-04 | -1.35e-01 | 0.0251 |
| 2330 | FMO5 | Pt14.b | Human | Liver | HCC | 3.35e-04 | 1.48e-01 | 0.018 |
| 2330 | FMO5 | S014 | Human | Liver | HCC | 3.58e-21 | 1.02e+00 | 0.2254 |
| 2330 | FMO5 | S015 | Human | Liver | HCC | 7.28e-09 | 1.04e+00 | 0.2375 |
| 2330 | FMO5 | S016 | Human | Liver | HCC | 1.37e-15 | 8.24e-01 | 0.2243 |
| 2330 | FMO5 | S028 | Human | Liver | HCC | 6.80e-12 | 7.42e-01 | 0.2503 |
| 2330 | FMO5 | S029 | Human | Liver | HCC | 2.43e-11 | 8.02e-01 | 0.2581 |
| Page: 1 |
| Tissue | Expression Dynamics | Abbreviation |
| Liver | 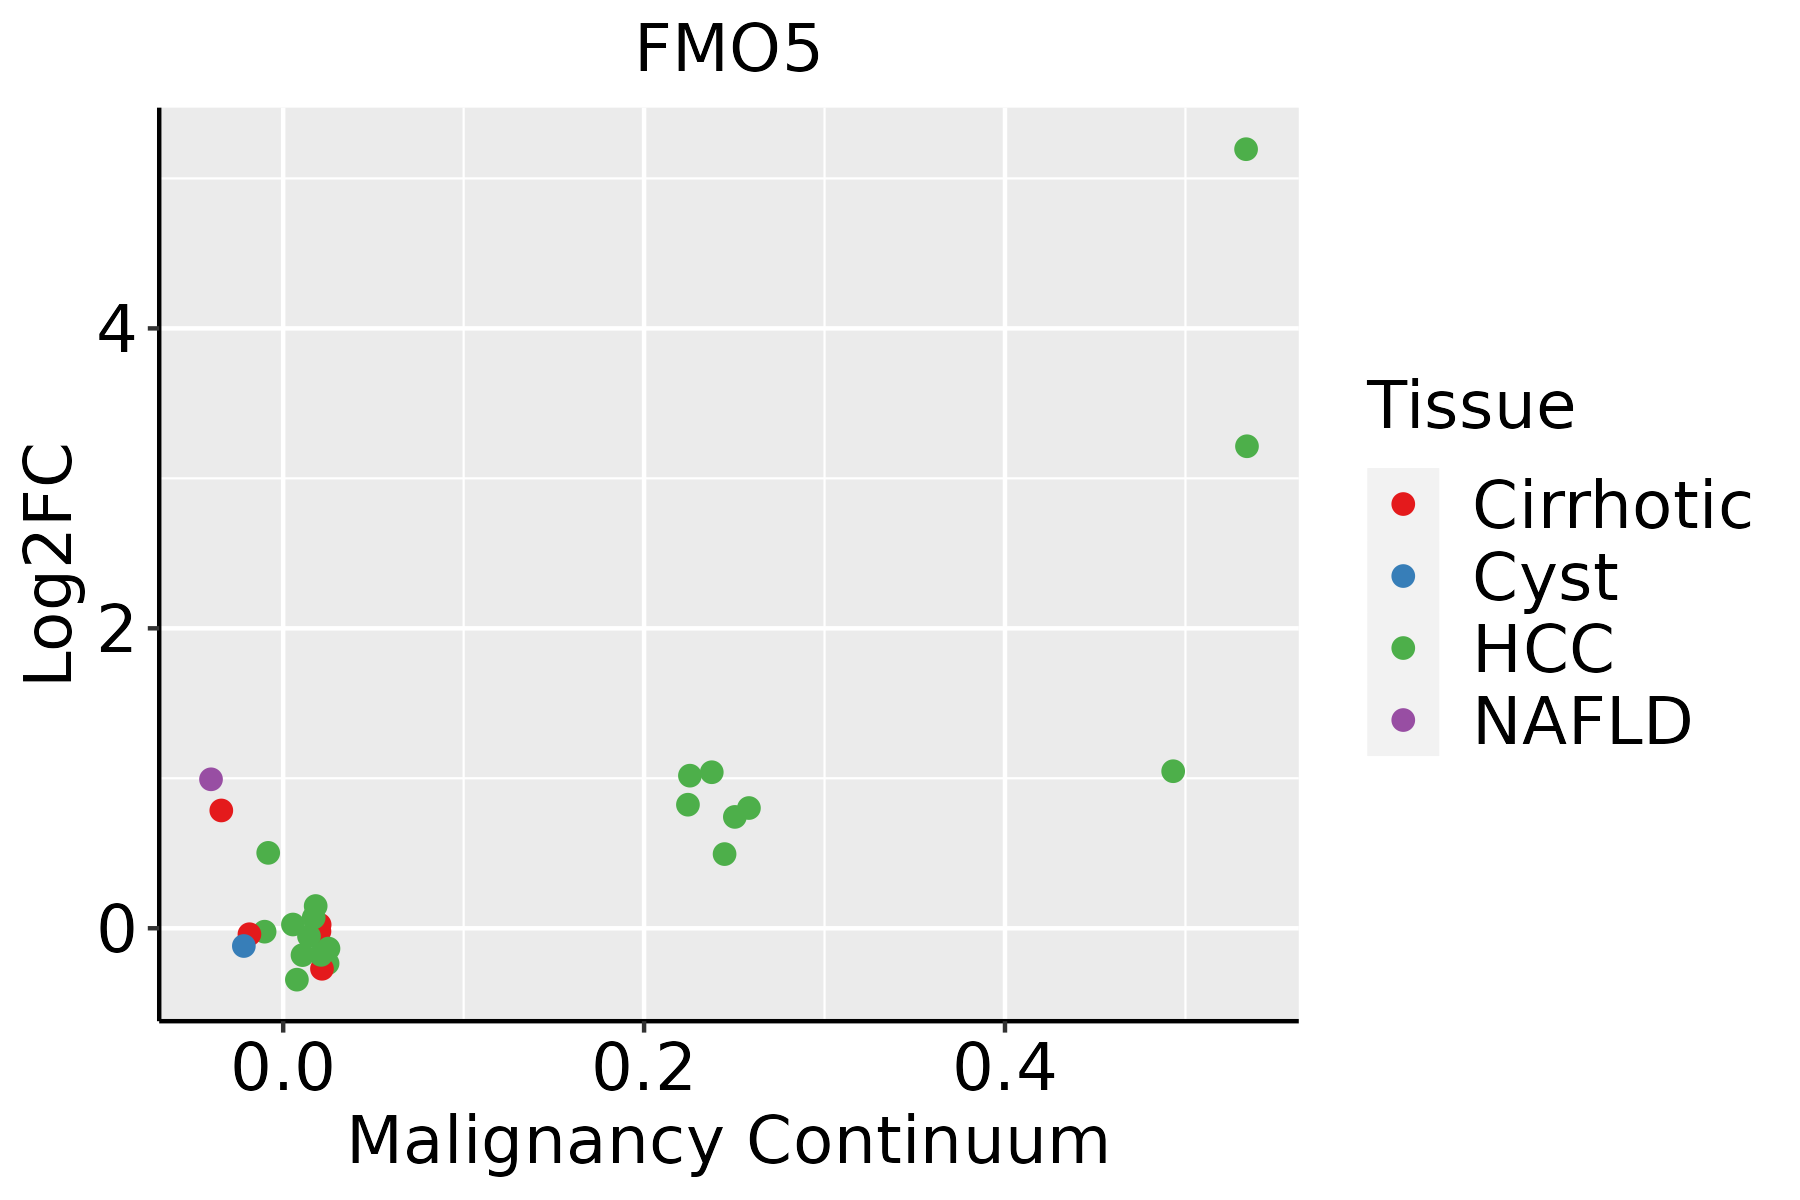 | HCC: Hepatocellular carcinoma |
| NAFLD: Non-alcoholic fatty liver disease | ||
| Prostate |  | BPH: Benign Prostatic Hyperplasia |
| ∗log2FC in expression of this searched gene in stem-like cells from each diseased tissue sample relative to stem-like cells in normal samples in each tissue plotted against the malignancy continuum. Samples are colored based on if they are from different disease stage. |
Top |
Malignant transformation related pathway analysis |
| Find out the enriched GO biological processes and KEGG pathways involved in transition from healthy to precancer to cancer |
| Tissue | Disease Stage | Enriched GO biological Processes |
| Colorectum | AD |  |
| Colorectum | SER |  |
| Colorectum | MSS |  |
| Colorectum | MSI-H |  |
| Colorectum | FAP |  |
| ∗Top 15 enriched GO BP terms are showed in the bar plot of each disease state in each tissue. Each row represents a significant GO biological process which is colored according to the -log10(p.adjust). |
| Page: 1 2 3 4 5 6 7 8 9 |
| GO ID | Tissue | Disease Stage | Description | Gene Ratio | Bg Ratio | pvalue | p.adjust | Count |
| GO:00082023 | Liver | NAFLD | steroid metabolic process | 69/1882 | 319/18723 | 5.90e-10 | 1.28e-07 | 69 |
| GO:00094107 | Liver | NAFLD | response to xenobiotic stimulus | 88/1882 | 462/18723 | 2.53e-09 | 4.11e-07 | 88 |
| GO:00620125 | Liver | NAFLD | regulation of small molecule metabolic process | 63/1882 | 334/18723 | 6.55e-07 | 3.79e-05 | 63 |
| GO:00192163 | Liver | NAFLD | regulation of lipid metabolic process | 61/1882 | 331/18723 | 2.18e-06 | 9.24e-05 | 61 |
| GO:0008203 | Liver | NAFLD | cholesterol metabolic process | 32/1882 | 137/18723 | 4.28e-06 | 1.66e-04 | 32 |
| GO:0016125 | Liver | NAFLD | sterol metabolic process | 34/1882 | 152/18723 | 6.02e-06 | 2.11e-04 | 34 |
| GO:1902652 | Liver | NAFLD | secondary alcohol metabolic process | 33/1882 | 147/18723 | 7.57e-06 | 2.56e-04 | 33 |
| GO:00060666 | Liver | NAFLD | alcohol metabolic process | 62/1882 | 353/18723 | 9.01e-06 | 2.96e-04 | 62 |
| GO:00192183 | Liver | NAFLD | regulation of steroid metabolic process | 22/1882 | 100/18723 | 3.22e-04 | 4.98e-03 | 22 |
| GO:00714663 | Liver | NAFLD | cellular response to xenobiotic stimulus | 33/1882 | 177/18723 | 3.54e-04 | 5.36e-03 | 33 |
| GO:00068054 | Liver | NAFLD | xenobiotic metabolic process | 22/1882 | 111/18723 | 1.42e-03 | 1.58e-02 | 22 |
| GO:0090181 | Liver | NAFLD | regulation of cholesterol metabolic process | 9/1882 | 35/18723 | 6.47e-03 | 4.69e-02 | 9 |
| GO:000820211 | Liver | Cirrhotic | steroid metabolic process | 143/4634 | 319/18723 | 2.79e-15 | 3.18e-13 | 143 |
| GO:19026521 | Liver | Cirrhotic | secondary alcohol metabolic process | 75/4634 | 147/18723 | 5.62e-12 | 3.91e-10 | 75 |
| GO:00082031 | Liver | Cirrhotic | cholesterol metabolic process | 70/4634 | 137/18723 | 2.59e-11 | 1.55e-09 | 70 |
| GO:00161251 | Liver | Cirrhotic | sterol metabolic process | 75/4634 | 152/18723 | 4.54e-11 | 2.61e-09 | 75 |
| GO:000606612 | Liver | Cirrhotic | alcohol metabolic process | 141/4634 | 353/18723 | 1.57e-10 | 8.03e-09 | 141 |
| GO:000941012 | Liver | Cirrhotic | response to xenobiotic stimulus | 165/4634 | 462/18723 | 6.82e-08 | 2.09e-06 | 165 |
| GO:006201212 | Liver | Cirrhotic | regulation of small molecule metabolic process | 124/4634 | 334/18723 | 2.74e-07 | 6.79e-06 | 124 |
| GO:001921611 | Liver | Cirrhotic | regulation of lipid metabolic process | 119/4634 | 331/18723 | 3.05e-06 | 5.39e-05 | 119 |
| Page: 1 2 |
| Pathway ID | Tissue | Disease Stage | Description | Gene Ratio | Bg Ratio | pvalue | p.adjust | qvalue | Count |
| Page: 1 |
Top |
Cell-cell communication analysis |
| Identification of potential cell-cell interactions between two cell types and their ligand-receptor pairs for different disease states |
| Ligand | Receptor | LRpair | Pathway | Tissue | Disease Stage |
| Page: 1 |
Top |
Single-cell gene regulatory network inference analysis |
| Find out the significant the regulons (TFs) and the target genes of each regulon across cell types for different disease states |
| TF | Cell Type | Tissue | Disease Stage | Target Gene | RSS | Regulon Activity |
| ∗The dot plots of a searched regulon are shown for all cell subpopulations in each disease state of each tissue based on the regulon specific score inferred using pySCENIC and by calculating the average expression. |
| Page: 1 |
Top |
Somatic mutation of malignant transformation related genes |
| Annotation of somatic variants for genes involved in malignant transformation |
| Hugo Symbol | Variant Class | Variant Classification | dbSNP RS | HGVSc | HGVSp | HGVSp Short | SWISSPROT | BIOTYPE | SIFT | PolyPhen | Tumor Sample Barcode | Tissue | Histology | Sex | Age | Stage | Therapy Types | Drugs | Outcome |
| FMO5 | SNV | Missense_Mutation | rs781850993 | c.560N>C | p.Arg187Thr | p.R187T | P49326 | protein_coding | deleterious(0.03) | possibly_damaging(0.824) | TCGA-5L-AAT1-01 | Breast | breast invasive carcinoma | Female | <65 | III/IV | Hormone Therapy | letrozol | SD |
| FMO5 | SNV | Missense_Mutation | rs781795531 | c.397N>A | p.Glu133Lys | p.E133K | P49326 | protein_coding | tolerated(0.09) | benign(0.41) | TCGA-5L-AAT1-01 | Breast | breast invasive carcinoma | Female | <65 | III/IV | Hormone Therapy | letrozol | SD |
| FMO5 | SNV | Missense_Mutation | c.637N>A | p.Leu213Ile | p.L213I | P49326 | protein_coding | tolerated(0.25) | benign(0.434) | TCGA-A2-A0D1-01 | Breast | breast invasive carcinoma | Female | >=65 | I/II | Chemotherapy | taxotere | SD | |
| FMO5 | SNV | Missense_Mutation | c.578N>A | p.Ile193Asn | p.I193N | P49326 | protein_coding | deleterious(0) | probably_damaging(0.985) | TCGA-A8-A07F-01 | Breast | breast invasive carcinoma | Female | >=65 | I/II | Hormone Therapy | tamoxiphen | SD | |
| FMO5 | SNV | Missense_Mutation | rs782092443 | c.578N>C | p.Ile193Thr | p.I193T | P49326 | protein_coding | tolerated(0.1) | possibly_damaging(0.6) | TCGA-GM-A2D9-01 | Breast | breast invasive carcinoma | Female | >=65 | I/II | Hormone Therapy | arimidex | SD |
| FMO5 | deletion | Frame_Shift_Del | c.48_79delCTCTTCCATCAAGTGCTGCGTAGAAGAAGGCT | p.Ser17GlyfsTer6 | p.S17Gfs*6 | P49326 | protein_coding | TCGA-A2-A0T0-01 | Breast | breast invasive carcinoma | Female | <65 | I/II | Chemotherapy | taxotere | SD | |||
| FMO5 | insertion | Nonsense_Mutation | novel | c.780_781insGCACCTGTCTGTAGTCCCAGCTATTCAGGAGGCTGAGGCAGGAGA | p.Lys260_Ile261insAlaProValCysSerProSerTyrSerGlyGlyTerGlyArgArg | p.K260_I261insAPVCSPSYSGG*GRR | P49326 | protein_coding | TCGA-A8-A06Q-01 | Breast | breast invasive carcinoma | Female | <65 | III/IV | Unknown | Unknown | SD | ||
| FMO5 | insertion | Nonsense_Mutation | novel | c.205_206insTTAAAACTCTCTGGTTCCACAACTTGTCCATTACTGCTTAGCC | p.Cys69PhefsTer14 | p.C69Ffs*14 | P49326 | protein_coding | TCGA-BH-A0HU-01 | Breast | breast invasive carcinoma | Female | <65 | I/II | Chemotherapy | docetaxel | SD | ||
| FMO5 | SNV | Missense_Mutation | c.926N>T | p.Glu309Val | p.E309V | P49326 | protein_coding | deleterious(0) | benign(0.257) | TCGA-C5-A2LS-01 | Cervix | cervical & endocervical cancer | Female | <65 | I/II | Unknown | Unknown | SD | |
| FMO5 | SNV | Missense_Mutation | c.268N>C | p.Glu90Gln | p.E90Q | P49326 | protein_coding | tolerated(0.1) | benign(0.257) | TCGA-DR-A0ZM-01 | Cervix | cervical & endocervical cancer | Female | <65 | III/IV | Unspecific | Cisplatin | SD |
| Page: 1 2 3 4 5 6 7 |
Top |
Related drugs of malignant transformation related genes |
| Identification of chemicals and drugs interact with genes involved in malignant transfromation |
| (DGIdb 4.0) |
| Entrez ID | Symbol | Category | Interaction Types | Drug Claim Name | Drug Name | PMIDs |
| 2330 | FMO5 | ENZYME, DRUGGABLE GENOME | metformin | METFORMIN | 26306225 |
| Page: 1 |

Copyright 2023-Present -The University of Texas Health Science Center at Houston |