
|
|||||
|
 | |
| |
| |
| |
| |
| |
|
Gene: FMO3 |
Gene summary for FMO3 |
| Gene information | Species | Human | Gene symbol | FMO3 | Gene ID | 2328 |
| Gene name | flavin containing dimethylaniline monoxygenase 3 | |
| Gene Alias | FMOII | |
| Cytomap | 1q24.3 | |
| Gene Type | protein-coding | GO ID | GO:0005575 | UniProtAcc | A0A024R8Z4 |
Top |
Malignant transformation analysis |
| Identification of the aberrant gene expression in precancerous and cancerous lesions by comparing the gene expression of stem-like cells in diseased tissues with normal stem cells |
| Entrez ID | Symbol | Replicates | Species | Organ | Tissue | Adj P-value | Log2FC | Malignancy |
| 2328 | FMO3 | P5T-E | Human | Esophagus | ESCC | 1.66e-02 | 1.22e-01 | 0.1327 |
| 2328 | FMO3 | P12T-E | Human | Esophagus | ESCC | 3.97e-04 | 1.26e-01 | 0.1122 |
| 2328 | FMO3 | P40T-E | Human | Esophagus | ESCC | 2.18e-06 | 2.97e-01 | 0.109 |
| 2328 | FMO3 | P57T-E | Human | Esophagus | ESCC | 8.56e-12 | 5.06e-01 | 0.0926 |
| 2328 | FMO3 | P62T-E | Human | Esophagus | ESCC | 1.44e-17 | 6.48e-01 | 0.1302 |
| 2328 | FMO3 | P82T-E | Human | Esophagus | ESCC | 1.98e-12 | 1.51e+00 | 0.1072 |
| 2328 | FMO3 | P128T-E | Human | Esophagus | ESCC | 3.69e-73 | 4.06e+00 | 0.1241 |
| 2328 | FMO3 | NAFLD1 | Human | Liver | NAFLD | 1.30e-13 | 1.03e+00 | -0.04 |
| 2328 | FMO3 | HCC1_Meng | Human | Liver | HCC | 6.04e-14 | -2.22e-01 | 0.0246 |
| 2328 | FMO3 | HCC2_Meng | Human | Liver | HCC | 5.02e-08 | -2.53e-01 | 0.0107 |
| 2328 | FMO3 | HCC1 | Human | Liver | HCC | 2.31e-07 | 3.67e+00 | 0.5336 |
| 2328 | FMO3 | Pt13.b | Human | Liver | HCC | 2.46e-18 | 7.27e-02 | 0.0251 |
| 2328 | FMO3 | Pt14.b | Human | Liver | HCC | 1.31e-07 | 2.90e-01 | 0.018 |
| Page: 1 |
| Tissue | Expression Dynamics | Abbreviation |
| Esophagus | 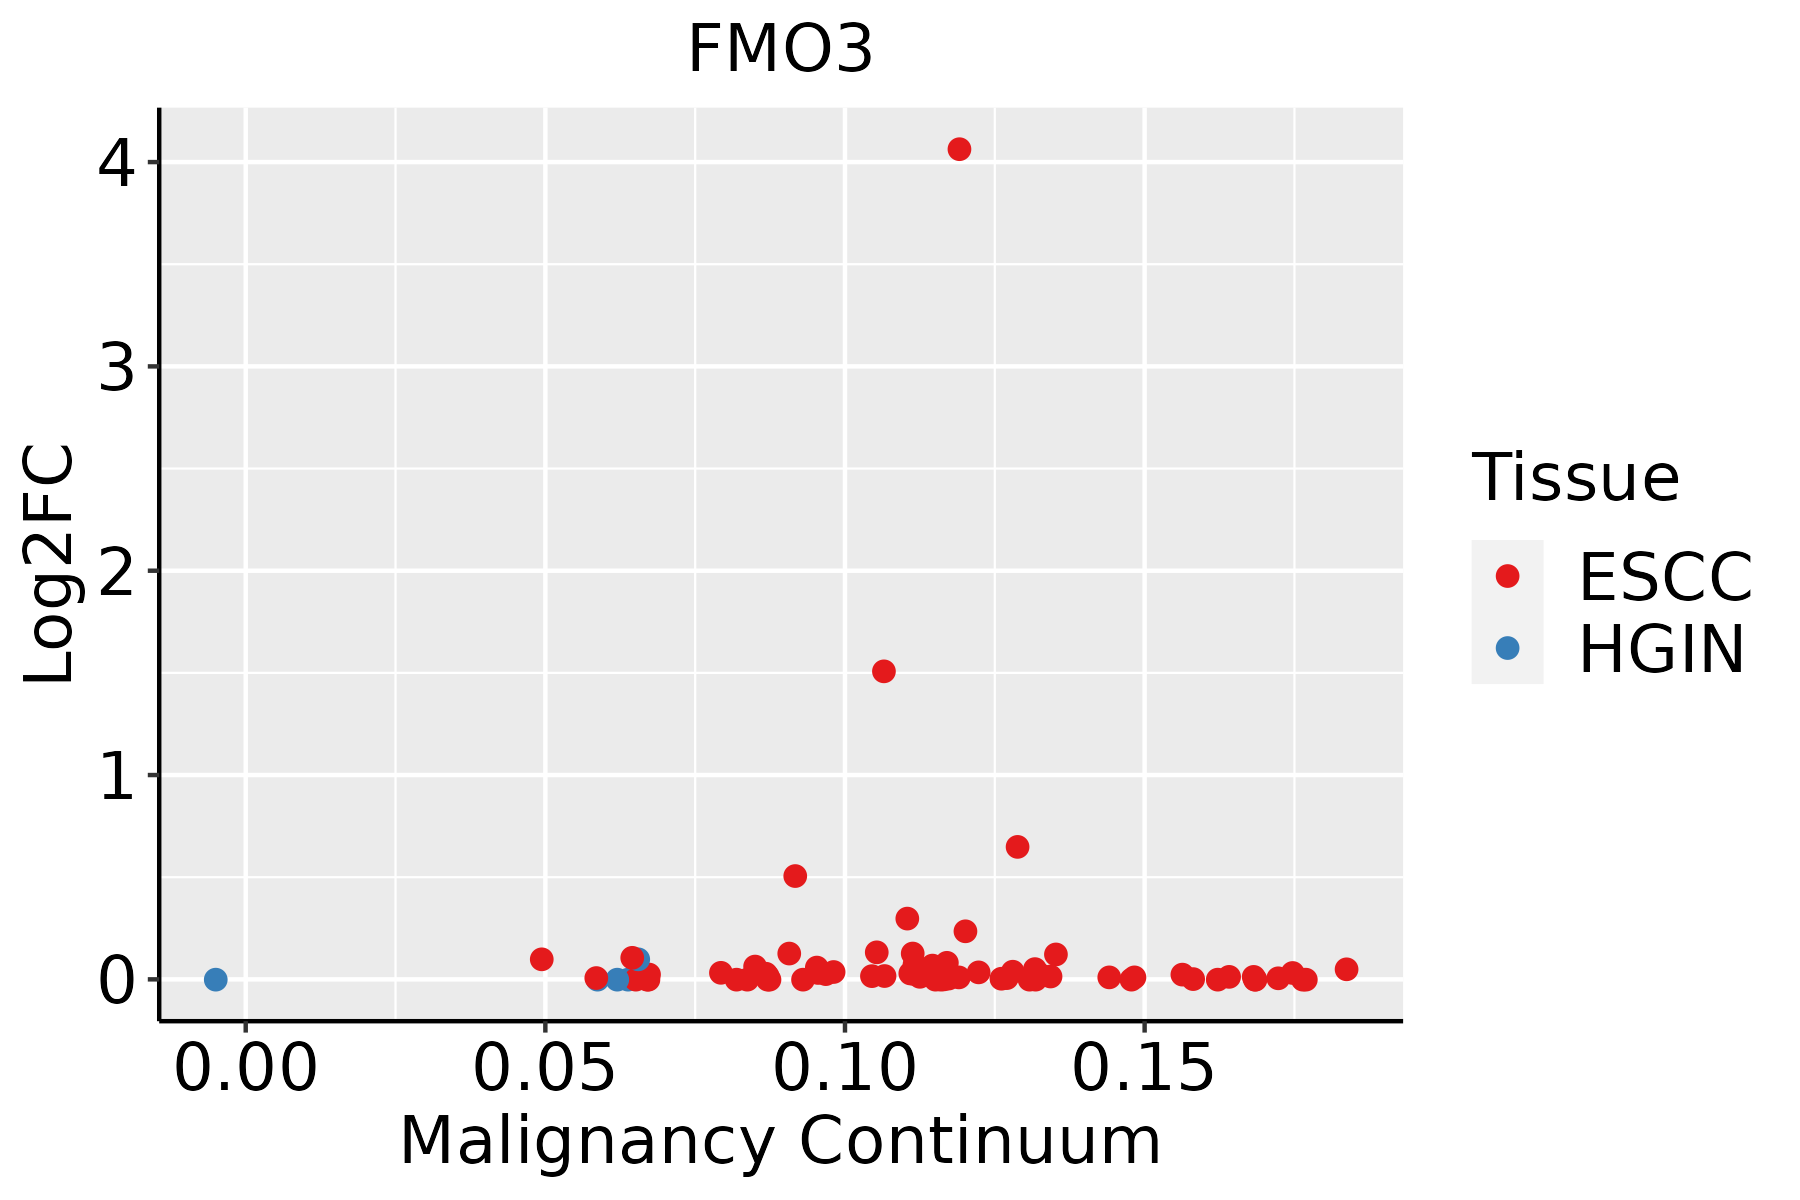 | ESCC: Esophageal squamous cell carcinoma |
| HGIN: High-grade intraepithelial neoplasias | ||
| LGIN: Low-grade intraepithelial neoplasias | ||
| Liver |  | HCC: Hepatocellular carcinoma |
| NAFLD: Non-alcoholic fatty liver disease |
| ∗log2FC in expression of this searched gene in stem-like cells from each diseased tissue sample relative to stem-like cells in normal samples in each tissue plotted against the malignancy continuum. Samples are colored based on if they are from different disease stage. |
Top |
Malignant transformation related pathway analysis |
| Find out the enriched GO biological processes and KEGG pathways involved in transition from healthy to precancer to cancer |
| Tissue | Disease Stage | Enriched GO biological Processes |
| Colorectum | AD |  |
| Colorectum | SER |  |
| Colorectum | MSS |  |
| Colorectum | MSI-H |  |
| Colorectum | FAP |  |
| ∗Top 15 enriched GO BP terms are showed in the bar plot of each disease state in each tissue. Each row represents a significant GO biological process which is colored according to the -log10(p.adjust). |
| Page: 1 2 3 4 5 6 7 8 9 |
| GO ID | Tissue | Disease Stage | Description | Gene Ratio | Bg Ratio | pvalue | p.adjust | Count |
| Page: 1 |
| Pathway ID | Tissue | Disease Stage | Description | Gene Ratio | Bg Ratio | pvalue | p.adjust | qvalue | Count |
| Page: 1 |
Top |
Cell-cell communication analysis |
| Identification of potential cell-cell interactions between two cell types and their ligand-receptor pairs for different disease states |
| Ligand | Receptor | LRpair | Pathway | Tissue | Disease Stage |
| Page: 1 |
Top |
Single-cell gene regulatory network inference analysis |
| Find out the significant the regulons (TFs) and the target genes of each regulon across cell types for different disease states |
| TF | Cell Type | Tissue | Disease Stage | Target Gene | RSS | Regulon Activity |
| ∗The dot plots of a searched regulon are shown for all cell subpopulations in each disease state of each tissue based on the regulon specific score inferred using pySCENIC and by calculating the average expression. |
| Page: 1 |
Top |
Somatic mutation of malignant transformation related genes |
| Annotation of somatic variants for genes involved in malignant transformation |
| Hugo Symbol | Variant Class | Variant Classification | dbSNP RS | HGVSc | HGVSp | HGVSp Short | SWISSPROT | BIOTYPE | SIFT | PolyPhen | Tumor Sample Barcode | Tissue | Histology | Sex | Age | Stage | Therapy Types | Drugs | Outcome |
| FMO3 | SNV | Missense_Mutation | c.352G>T | p.Asp118Tyr | p.D118Y | P31513 | protein_coding | deleterious(0) | probably_damaging(0.991) | TCGA-AC-A23H-01 | Breast | breast invasive carcinoma | Female | >=65 | I/II | Unknown | Unknown | PD | |
| FMO3 | SNV | Missense_Mutation | c.578N>T | p.Gly193Val | p.G193V | P31513 | protein_coding | deleterious(0) | probably_damaging(0.998) | TCGA-BH-A0DO-01 | Breast | breast invasive carcinoma | Female | >=65 | I/II | Unknown | Unknown | SD | |
| FMO3 | SNV | Missense_Mutation | novel | c.45G>T | p.Leu15Phe | p.L15F | P31513 | protein_coding | deleterious(0) | probably_damaging(0.999) | TCGA-BH-A0HO-01 | Breast | breast invasive carcinoma | Female | <65 | I/II | Chemotherapy | cyclophosphamide | SD |
| FMO3 | SNV | Missense_Mutation | novel | c.45G>T | p.Leu15Phe | p.L15F | P31513 | protein_coding | deleterious(0) | probably_damaging(0.999) | TCGA-BH-A0HU-01 | Breast | breast invasive carcinoma | Female | <65 | I/II | Chemotherapy | docetaxel | SD |
| FMO3 | SNV | Missense_Mutation | c.859G>A | p.Glu287Lys | p.E287K | P31513 | protein_coding | deleterious(0.02) | possibly_damaging(0.788) | TCGA-C8-A3M7-01 | Breast | breast invasive carcinoma | Female | <65 | III/IV | Unknown | Unknown | PD | |
| FMO3 | SNV | Missense_Mutation | novel | c.45N>T | p.Leu15Phe | p.L15F | P31513 | protein_coding | deleterious(0) | probably_damaging(0.999) | TCGA-D8-A1JA-01 | Breast | breast invasive carcinoma | Female | <65 | III/IV | Chemotherapy | adriamycin | PD |
| FMO3 | SNV | Missense_Mutation | novel | c.45N>T | p.Leu15Phe | p.L15F | P31513 | protein_coding | deleterious(0) | probably_damaging(0.999) | TCGA-E9-A22A-01 | Breast | breast invasive carcinoma | Female | >=65 | I/II | Hormone Therapy | tamoxiphen | SD |
| FMO3 | SNV | Missense_Mutation | c.1327N>T | p.Ala443Ser | p.A443S | P31513 | protein_coding | tolerated(0.11) | benign(0.192) | TCGA-EW-A1PC-01 | Breast | breast invasive carcinoma | Female | >=65 | I/II | Hormone Therapy | tamoxiphen | SD | |
| FMO3 | insertion | Nonsense_Mutation | novel | c.1556_1557insAATGAGAGATTGATGTT | p.Ile520MetfsTer4 | p.I520Mfs*4 | P31513 | protein_coding | TCGA-AO-A03R-01 | Breast | breast invasive carcinoma | Female | <65 | I/II | Chemotherapy | doxorubicin | SD | ||
| FMO3 | insertion | Frame_Shift_Ins | novel | c.1062_1063insTTCTT | p.Gly355PhefsTer14 | p.G355Ffs*14 | P31513 | protein_coding | TCGA-AR-A0U0-01 | Breast | breast invasive carcinoma | Female | >=65 | I/II | Unknown | Unknown | SD |
| Page: 1 2 3 4 5 6 7 8 9 |
Top |
Related drugs of malignant transformation related genes |
| Identification of chemicals and drugs interact with genes involved in malignant transfromation |
| (DGIdb 4.0) |
| Entrez ID | Symbol | Category | Interaction Types | Drug Claim Name | Drug Name | PMIDs |
| 2328 | FMO3 | ENZYME, DRUGGABLE GENOME | tacrolimus | TACROLIMUS | 28084894 | |
| 2328 | FMO3 | ENZYME, DRUGGABLE GENOME | nicotine | NICOTINE | 28290528 | |
| 2328 | FMO3 | ENZYME, DRUGGABLE GENOME | sulindac | SULINDAC | ||
| 2328 | FMO3 | ENZYME, DRUGGABLE GENOME | tamoxifen | TAMOXIFEN | 23962908 | |
| 2328 | FMO3 | ENZYME, DRUGGABLE GENOME | daunorubicin | DAUNORUBICIN | 25119182 | |
| 2328 | FMO3 | ENZYME, DRUGGABLE GENOME | rosuvastatin | ROSUVASTATIN | 20679960 | |
| 2328 | FMO3 | ENZYME, DRUGGABLE GENOME | itopride | ITOPRIDE | 25224784 | |
| 2328 | FMO3 | ENZYME, DRUGGABLE GENOME | anthracyclines and related substances | 23441093,21900104 | ||
| 2328 | FMO3 | ENZYME, DRUGGABLE GENOME | olanzapine | OLANZAPINE | 23147717 |
| Page: 1 |

Copyright 2023-Present -The University of Texas Health Science Center at Houston |