
|
|||||
|
 | |
| |
| |
| |
| |
| |
|
Gene: FMO2 |
Gene summary for FMO2 |
| Gene information | Species | Human | Gene symbol | FMO2 | Gene ID | 2327 |
| Gene name | flavin containing dimethylaniline monoxygenase 2 | |
| Gene Alias | FMO1B1 | |
| Cytomap | 1q24.3 | |
| Gene Type | protein-coding | GO ID | GO:0006082 | UniProtAcc | B4E2Q9 |
Top |
Malignant transformation analysis |
| Identification of the aberrant gene expression in precancerous and cancerous lesions by comparing the gene expression of stem-like cells in diseased tissues with normal stem cells |
| Entrez ID | Symbol | Replicates | Species | Organ | Tissue | Adj P-value | Log2FC | Malignancy |
| 2327 | FMO2 | LZE24D1 | Human | Esophagus | HGIN | 1.58e-02 | 5.95e-01 | 0.054 |
| 2327 | FMO2 | P44T-E | Human | Esophagus | ESCC | 1.11e-03 | 7.70e-01 | 0.1096 |
| 2327 | FMO2 | P57T-E | Human | Esophagus | ESCC | 2.84e-25 | 9.69e-01 | 0.0926 |
| 2327 | FMO2 | P83T-E | Human | Esophagus | ESCC | 7.23e-11 | -3.40e-02 | 0.1738 |
| 2327 | FMO2 | C57 | Human | Oral cavity | OSCC | 2.86e-08 | 5.68e-01 | 0.1679 |
| 2327 | FMO2 | C08 | Human | Oral cavity | OSCC | 8.20e-04 | 6.34e-01 | 0.1919 |
| 2327 | FMO2 | SYSMH6 | Human | Oral cavity | OSCC | 1.54e-20 | 6.95e-01 | 0.1275 |
| Page: 1 |
| Tissue | Expression Dynamics | Abbreviation |
| Esophagus | 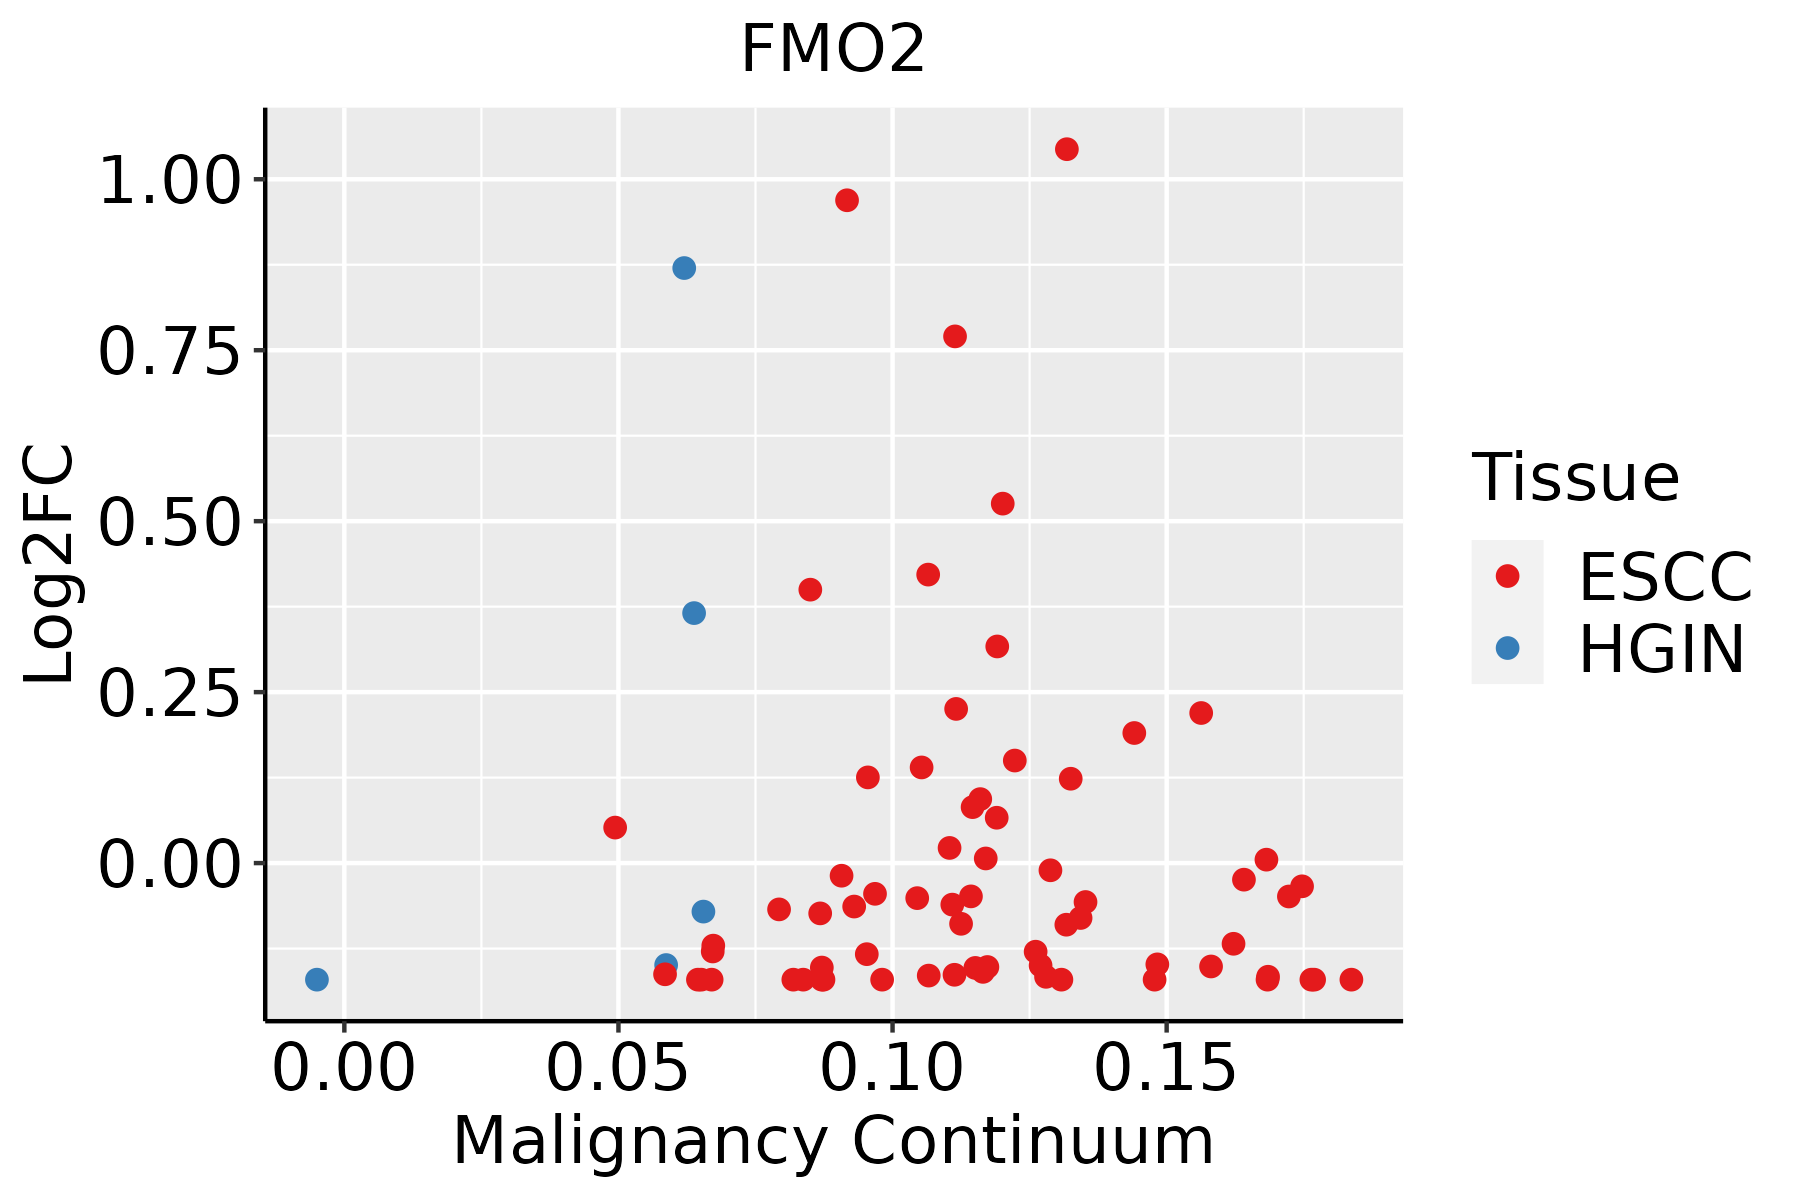 | ESCC: Esophageal squamous cell carcinoma |
| HGIN: High-grade intraepithelial neoplasias | ||
| LGIN: Low-grade intraepithelial neoplasias | ||
| Oral Cavity | 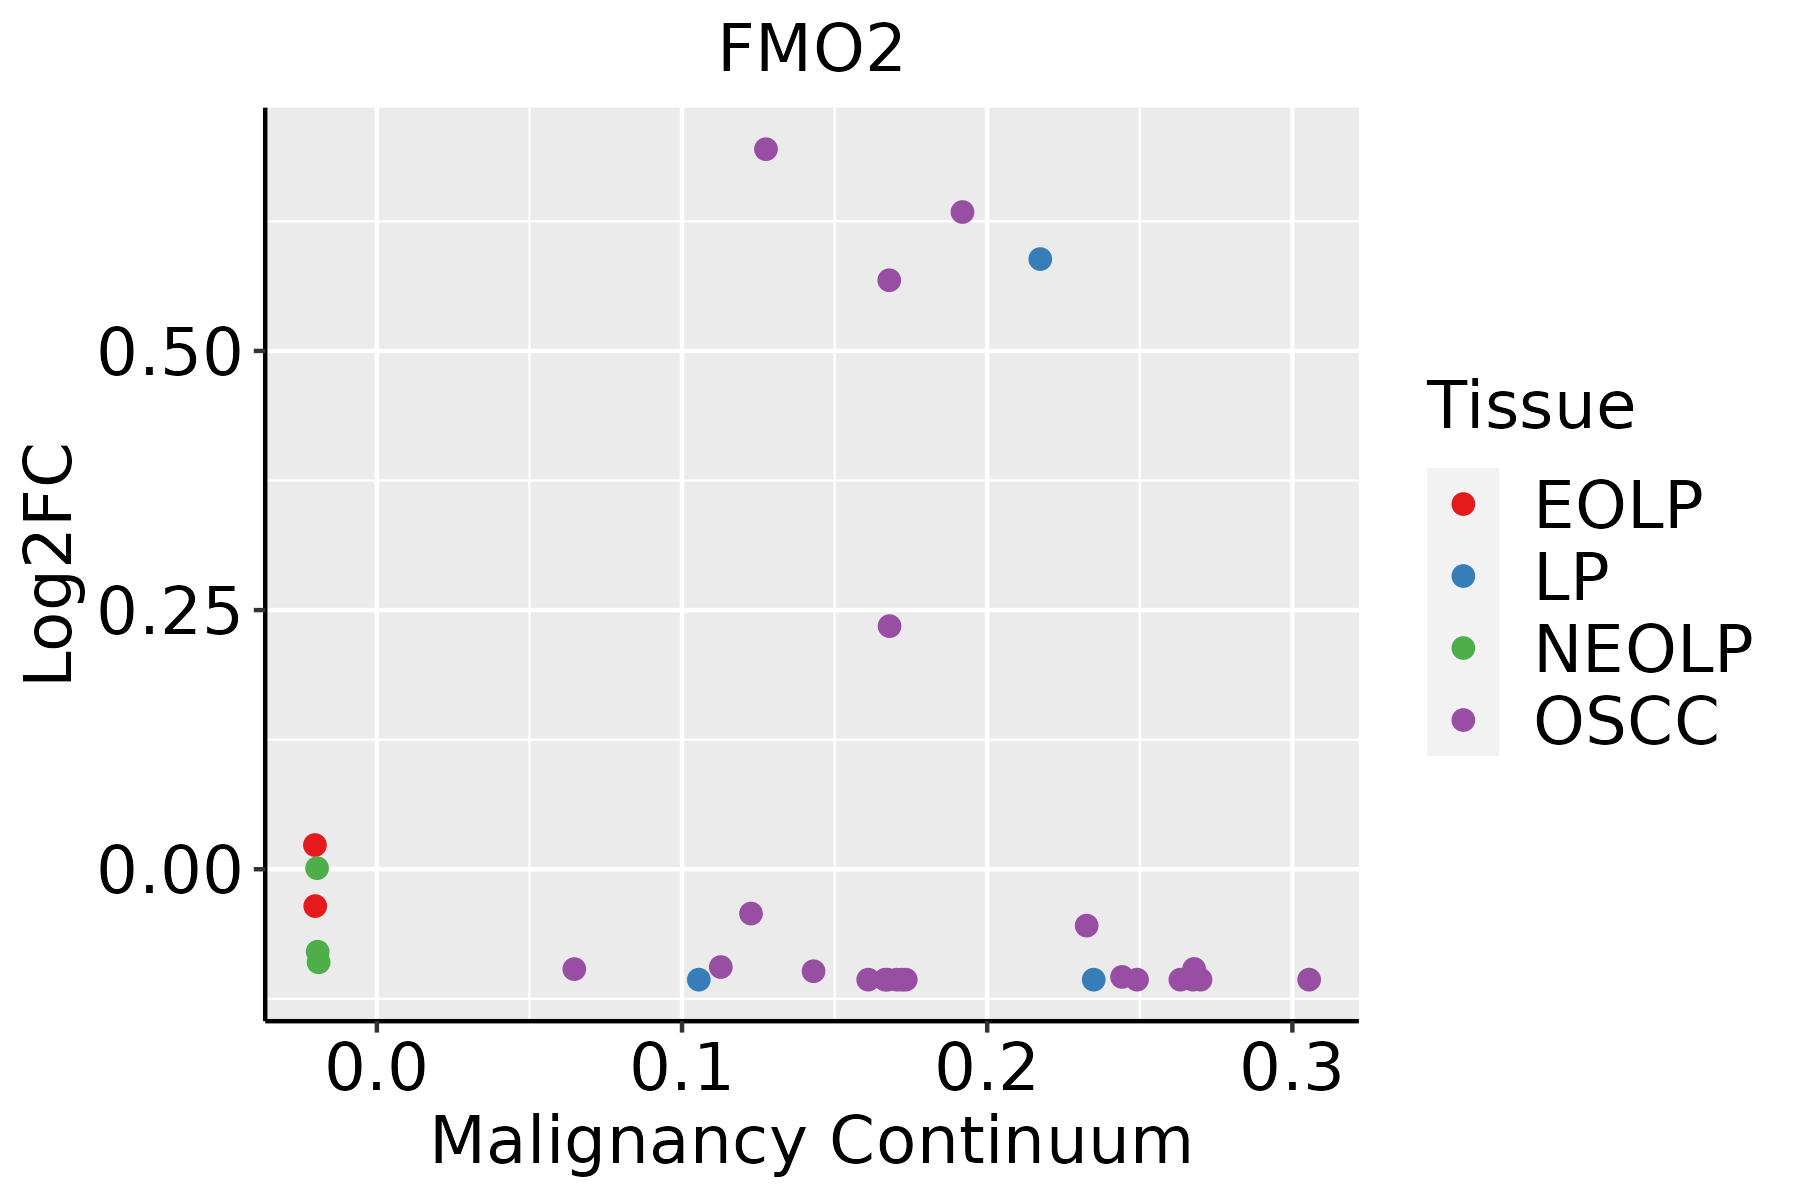 | EOLP: Erosive Oral lichen planus |
| LP: leukoplakia | ||
| NEOLP: Non-erosive oral lichen planus | ||
| OSCC: Oral squamous cell carcinoma |
| ∗log2FC in expression of this searched gene in stem-like cells from each diseased tissue sample relative to stem-like cells in normal samples in each tissue plotted against the malignancy continuum. Samples are colored based on if they are from different disease stage. |
Top |
Malignant transformation related pathway analysis |
| Find out the enriched GO biological processes and KEGG pathways involved in transition from healthy to precancer to cancer |
| Tissue | Disease Stage | Enriched GO biological Processes |
| Colorectum | AD |  |
| Colorectum | SER |  |
| Colorectum | MSS |  |
| Colorectum | MSI-H |  |
| Colorectum | FAP |  |
| ∗Top 15 enriched GO BP terms are showed in the bar plot of each disease state in each tissue. Each row represents a significant GO biological process which is colored according to the -log10(p.adjust). |
| Page: 1 2 3 4 5 6 7 8 9 |
| GO ID | Tissue | Disease Stage | Description | Gene Ratio | Bg Ratio | pvalue | p.adjust | Count |
| GO:000941020 | Esophagus | ESCC | response to xenobiotic stimulus | 253/8552 | 462/18723 | 4.55e-05 | 3.58e-04 | 253 |
| GO:00067393 | Esophagus | ESCC | NADP metabolic process | 23/8552 | 35/18723 | 1.34e-02 | 4.38e-02 | 23 |
| GO:000941018 | Oral cavity | OSCC | response to xenobiotic stimulus | 222/7305 | 462/18723 | 4.00e-05 | 3.48e-04 | 222 |
| GO:00067392 | Oral cavity | OSCC | NADP metabolic process | 22/7305 | 35/18723 | 3.65e-03 | 1.51e-02 | 22 |
| Page: 1 |
| Pathway ID | Tissue | Disease Stage | Description | Gene Ratio | Bg Ratio | pvalue | p.adjust | qvalue | Count |
| Page: 1 |
Top |
Cell-cell communication analysis |
| Identification of potential cell-cell interactions between two cell types and their ligand-receptor pairs for different disease states |
| Ligand | Receptor | LRpair | Pathway | Tissue | Disease Stage |
| Page: 1 |
Top |
Single-cell gene regulatory network inference analysis |
| Find out the significant the regulons (TFs) and the target genes of each regulon across cell types for different disease states |
| TF | Cell Type | Tissue | Disease Stage | Target Gene | RSS | Regulon Activity |
| ∗The dot plots of a searched regulon are shown for all cell subpopulations in each disease state of each tissue based on the regulon specific score inferred using pySCENIC and by calculating the average expression. |
| Page: 1 |
Top |
Somatic mutation of malignant transformation related genes |
| Annotation of somatic variants for genes involved in malignant transformation |
| Hugo Symbol | Variant Class | Variant Classification | dbSNP RS | HGVSc | HGVSp | HGVSp Short | SWISSPROT | BIOTYPE | SIFT | PolyPhen | Tumor Sample Barcode | Tissue | Histology | Sex | Age | Stage | Therapy Types | Drugs | Outcome |
| FMO2 | SNV | Missense_Mutation | c.502N>T | p.Gly168Cys | p.G168C | Q99518 | protein_coding | deleterious(0) | probably_damaging(1) | TCGA-A8-A09Z-01 | Breast | breast invasive carcinoma | Female | >=65 | I/II | Unknown | Unknown | SD | |
| FMO2 | SNV | Missense_Mutation | c.408G>C | p.Gln136His | p.Q136H | Q99518 | protein_coding | deleterious(0.02) | benign(0.012) | TCGA-AC-A23H-01 | Breast | breast invasive carcinoma | Female | >=65 | I/II | Unknown | Unknown | PD | |
| FMO2 | SNV | Missense_Mutation | c.96N>C | p.Glu32Asp | p.E32D | Q99518 | protein_coding | deleterious(0) | possibly_damaging(0.833) | TCGA-BH-A0DZ-01 | Breast | breast invasive carcinoma | Female | <65 | I/II | Chemotherapy | docetaxel | SD | |
| FMO2 | SNV | Missense_Mutation | c.123N>C | p.Trp41Cys | p.W41C | Q99518 | protein_coding | deleterious(0) | probably_damaging(1) | TCGA-D8-A145-01 | Breast | breast invasive carcinoma | Female | >=65 | I/II | Hormone Therapy | tamoxiphen | SD | |
| FMO2 | SNV | Missense_Mutation | novel | c.407A>G | p.Gln136Arg | p.Q136R | Q99518 | protein_coding | deleterious(0.02) | benign(0.007) | TCGA-D8-A1J8-01 | Breast | breast invasive carcinoma | Female | >=65 | I/II | Hormone Therapy | nolvadex | SD |
| FMO2 | SNV | Missense_Mutation | novel | c.1490N>G | p.Lys497Arg | p.K497R | Q99518 | protein_coding | tolerated(0.08) | benign(0.401) | TCGA-D8-A1JM-01 | Breast | breast invasive carcinoma | Female | <65 | I/II | ChemotherapyHormone Therapy | doxorubicine | SD |
| FMO2 | insertion | In_Frame_Ins | novel | c.1098_1099insTTGATATTTTTG | p.Leu366_Ala367insLeuIlePheLeu | p.L366_A367insLIFL | Q99518 | protein_coding | TCGA-AR-A0TU-01 | Breast | breast invasive carcinoma | Female | <65 | I/II | Unspecific | Doxorubicin | SD | ||
| FMO2 | SNV | Missense_Mutation | rs368359446 | c.1396G>A | p.Gly466Arg | p.G466R | Q99518 | protein_coding | deleterious(0) | probably_damaging(1) | TCGA-DS-A1OC-01 | Cervix | cervical & endocervical cancer | Female | <65 | I/II | Chemotherapy | gemcitabine | SD |
| FMO2 | SNV | Missense_Mutation | c.676N>A | p.Glu226Lys | p.E226K | Q99518 | protein_coding | deleterious(0.05) | benign(0.015) | TCGA-FU-A3HY-01 | Cervix | cervical & endocervical cancer | Female | <65 | I/II | Chemotherapy | cisplatin | CR | |
| FMO2 | SNV | Missense_Mutation | rs759051184 | c.871C>T | p.Arg291Cys | p.R291C | Q99518 | protein_coding | tolerated(0.41) | benign(0.062) | TCGA-AA-3510-01 | Colorectum | colon adenocarcinoma | Male | >=65 | I/II | Unknown | Unknown | SD |
| Page: 1 2 3 4 5 6 7 8 9 10 |
Top |
Related drugs of malignant transformation related genes |
| Identification of chemicals and drugs interact with genes involved in malignant transfromation |
| (DGIdb 4.0) |
| Entrez ID | Symbol | Category | Interaction Types | Drug Claim Name | Drug Name | PMIDs |
| Page: 1 |

Copyright 2023-Present -The University of Texas Health Science Center at Houston |