Schematic overview of the cellular and molecular mechanisms involved in the cancer progression, including the proposed cellular and molecular mechanisms in cancer cells trajectory. AT1: alveolar type 1 cells; AT2: alveolar type 2 cells; AAH: atypical adenomatous hyperplasia; AIS: adenocarcinoma in situ; MIA: minimally invasive adenocarcinoma; IA: invasive adenocarcinoma; EMT: epithelial-mesenchymal transition

Home

Download

Statistics

Help

Contact

Center for Computational Systems Medicine
leaf

Gene summary

leaf

Malignant transformation analysis

leaf

Malignant transformation related pathway analysis

leaf

Cell-cell communication analysis

leaf

Single-cell gene regulatory network inference analysis

leaf

Somatic mutation of malignant transformation related genes

leaf

Related drugs of malignant transformation related genes

Gene: FMNL2

Gene summary for FMNL2

check button Gene summary.

Gene informationSpeciesHuman
Gene symbol

FMNL2

Gene ID

114793

Gene nameformin like 2
Gene AliasFHOD2
Cytomap2q23.3
Gene Typeprotein-coding
GO ID

GO:0000902

UniProtAcc

Q96PY5


Top

Malignant transformation analysis

check button Identification of the aberrant gene expression in precancerous and cancerous lesions by comparing the gene expression of stem-like cells in diseased tissues with normal stem cells
check button Malignant transformation involving gene list.
Entrez IDSymbolReplicatesSpeciesOrganTissueAdj P-valueLog2FCMalignancy
114793FMNL2CCI_1HumanCervixCC2.38e-077.18e-010.528
114793FMNL2CCI_2HumanCervixCC6.95e-091.02e+000.5249
114793FMNL2CCI_3HumanCervixCC1.77e-071.09e+000.516
114793FMNL2HTA11_3410_2000001011HumanColorectumAD6.28e-11-6.26e-010.0155
114793FMNL2HTA11_2487_2000001011HumanColorectumSER9.74e-14-7.91e-01-0.1808
114793FMNL2HTA11_78_2000001011HumanColorectumAD4.52e-02-4.67e-01-0.1088
114793FMNL2HTA11_2112_2000001011HumanColorectumSER4.96e-03-8.96e-01-0.2196
114793FMNL2HTA11_3361_2000001011HumanColorectumAD1.90e-07-7.25e-01-0.1207
114793FMNL2HTA11_696_2000001011HumanColorectumAD2.29e-13-5.60e-01-0.1464
114793FMNL2HTA11_866_2000001011HumanColorectumAD7.38e-05-3.91e-01-0.1001
114793FMNL2HTA11_5212_2000001011HumanColorectumAD2.39e-04-7.73e-01-0.2061
114793FMNL2HTA11_866_3004761011HumanColorectumAD2.96e-06-5.51e-010.096
114793FMNL2HTA11_10711_2000001011HumanColorectumAD3.28e-08-6.14e-010.0338
114793FMNL2HTA11_7696_3000711011HumanColorectumAD2.74e-08-3.79e-010.0674
114793FMNL2HTA11_11156_2000001011HumanColorectumAD3.61e-02-9.32e-010.0397
114793FMNL2HTA11_99999974143_84620HumanColorectumMSS1.61e-11-4.83e-010.3005
114793FMNL2A015-C-203HumanColorectumFAP1.78e-24-3.54e-01-0.1294
114793FMNL2A015-C-204HumanColorectumFAP1.12e-03-3.20e-01-0.0228
114793FMNL2A014-C-040HumanColorectumFAP1.43e-03-3.45e-01-0.1184
114793FMNL2A002-C-201HumanColorectumFAP1.42e-13-4.08e-010.0324
Page: 1 2 3 4 5 6 7 8 9 

check button Transcriptomic changes along malignancy continuum.
TissueExpression DynamicsAbbreviation
CervixThe image shows the transcriptomic changes along malignancy continuum.log2FC in expression of this searched gene in stem-like cells from each diseased tissue sample relative to stem-like cells in normal samples in each tissue plotted against the malignancy continuum. Samples are colored based on if they are from different disease stage.CC: Cervix cancer
HSIL_HPV: HPV-infected high-grade squamous intraepithelial lesions
N_HPV: HPV-infected normal cervix
Colorectum (GSE201348)The image shows the transcriptomic changes along malignancy continuum.log2FC in expression of this searched gene in stem-like cells from each diseased tissue sample relative to stem-like cells in normal samples in each tissue plotted against the malignancy continuum. Samples are colored based on if they are from different disease stage.FAP: Familial adenomatous polyposis
CRC: Colorectal cancer
Colorectum (HTA11)The image shows the transcriptomic changes along malignancy continuum.log2FC in expression of this searched gene in stem-like cells from each diseased tissue sample relative to stem-like cells in normal samples in each tissue plotted against the malignancy continuum. Samples are colored based on if they are from different disease stage.AD: Adenomas
SER: Sessile serrated lesions
MSI-H: Microsatellite-high colorectal cancer
MSS: Microsatellite stable colorectal cancer
EndometriumThe image shows the transcriptomic changes along malignancy continuum.log2FC in expression of this searched gene in stem-like cells from each diseased tissue sample relative to stem-like cells in normal samples in each tissue plotted against the malignancy continuum. Samples are colored based on if they are from different disease stage.AEH: Atypical endometrial hyperplasia
EEC: Endometrioid Cancer
EsophagusThe image shows the transcriptomic changes along malignancy continuum.log2FC in expression of this searched gene in stem-like cells from each diseased tissue sample relative to stem-like cells in normal samples in each tissue plotted against the malignancy continuum. Samples are colored based on if they are from different disease stage.
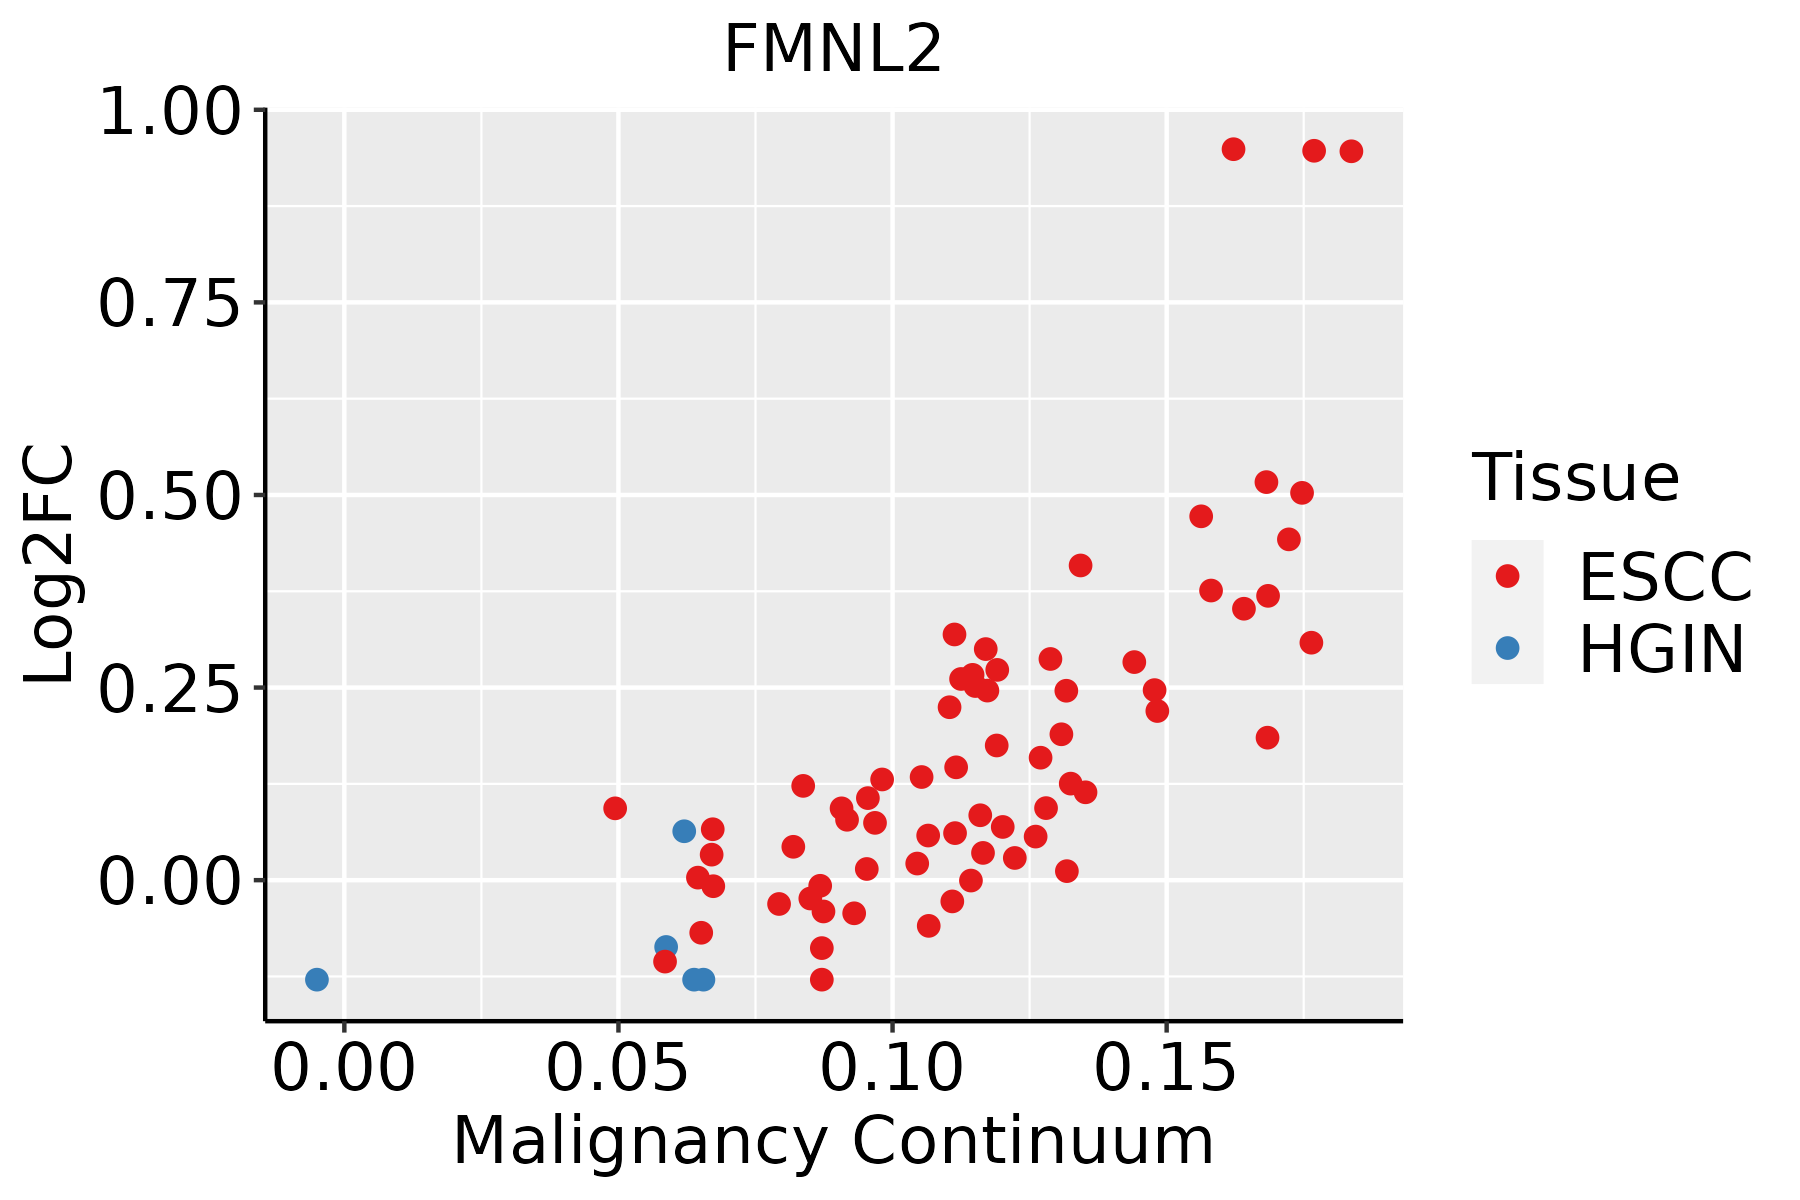
ESCC: Esophageal squamous cell carcinoma
HGIN: High-grade intraepithelial neoplasias
LGIN: Low-grade intraepithelial neoplasias
LiverThe image shows the transcriptomic changes along malignancy continuum.log2FC in expression of this searched gene in stem-like cells from each diseased tissue sample relative to stem-like cells in normal samples in each tissue plotted against the malignancy continuum. Samples are colored based on if they are from different disease stage.
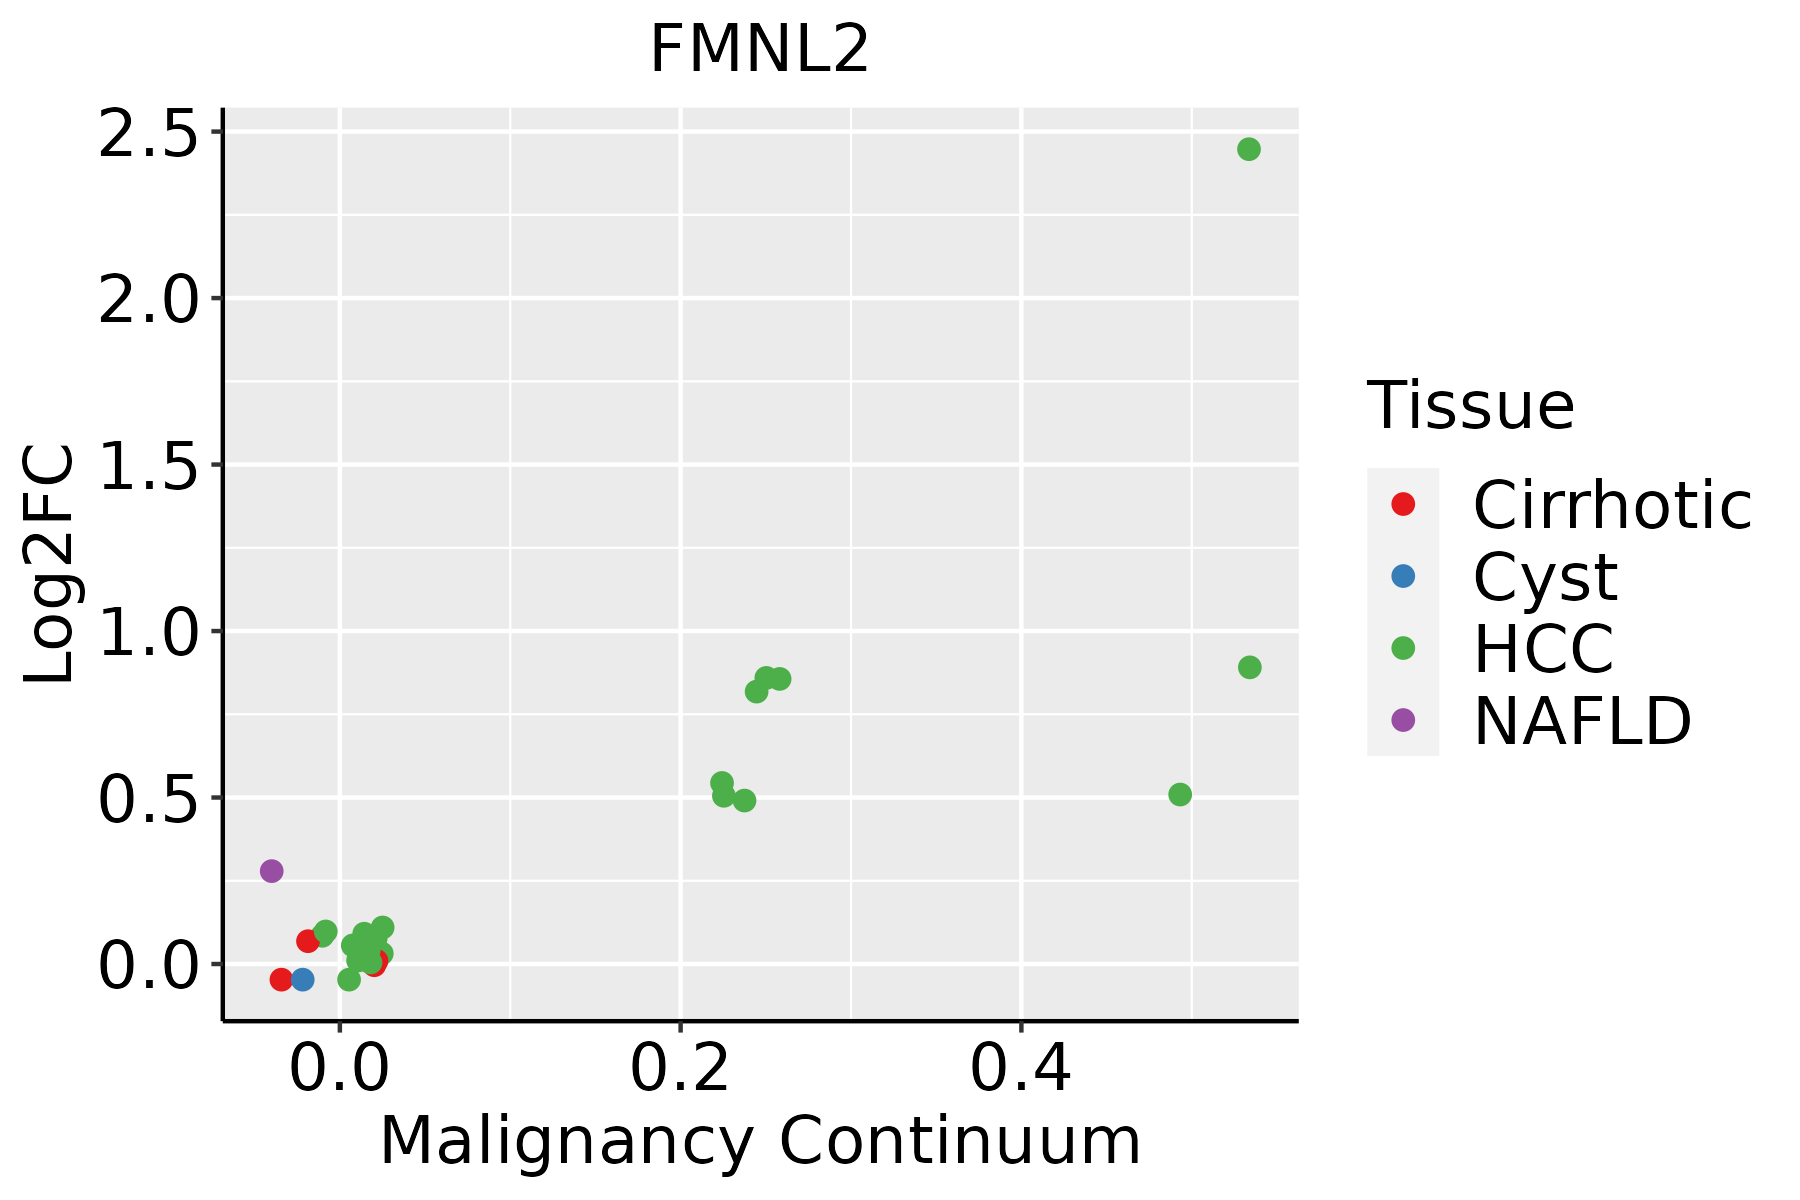
HCC: Hepatocellular carcinoma
NAFLD: Non-alcoholic fatty liver disease
LungThe image shows the transcriptomic changes along malignancy continuum.log2FC in expression of this searched gene in stem-like cells from each diseased tissue sample relative to stem-like cells in normal samples in each tissue plotted against the malignancy continuum. Samples are colored based on if they are from different disease stage.AAH: Atypical adenomatous hyperplasia
AIS: Adenocarcinoma in situ
IAC: Invasive lung adenocarcinoma
MIA: Minimally invasive adenocarcinoma
Oral CavityThe image shows the transcriptomic changes along malignancy continuum.log2FC in expression of this searched gene in stem-like cells from each diseased tissue sample relative to stem-like cells in normal samples in each tissue plotted against the malignancy continuum. Samples are colored based on if they are from different disease stage.
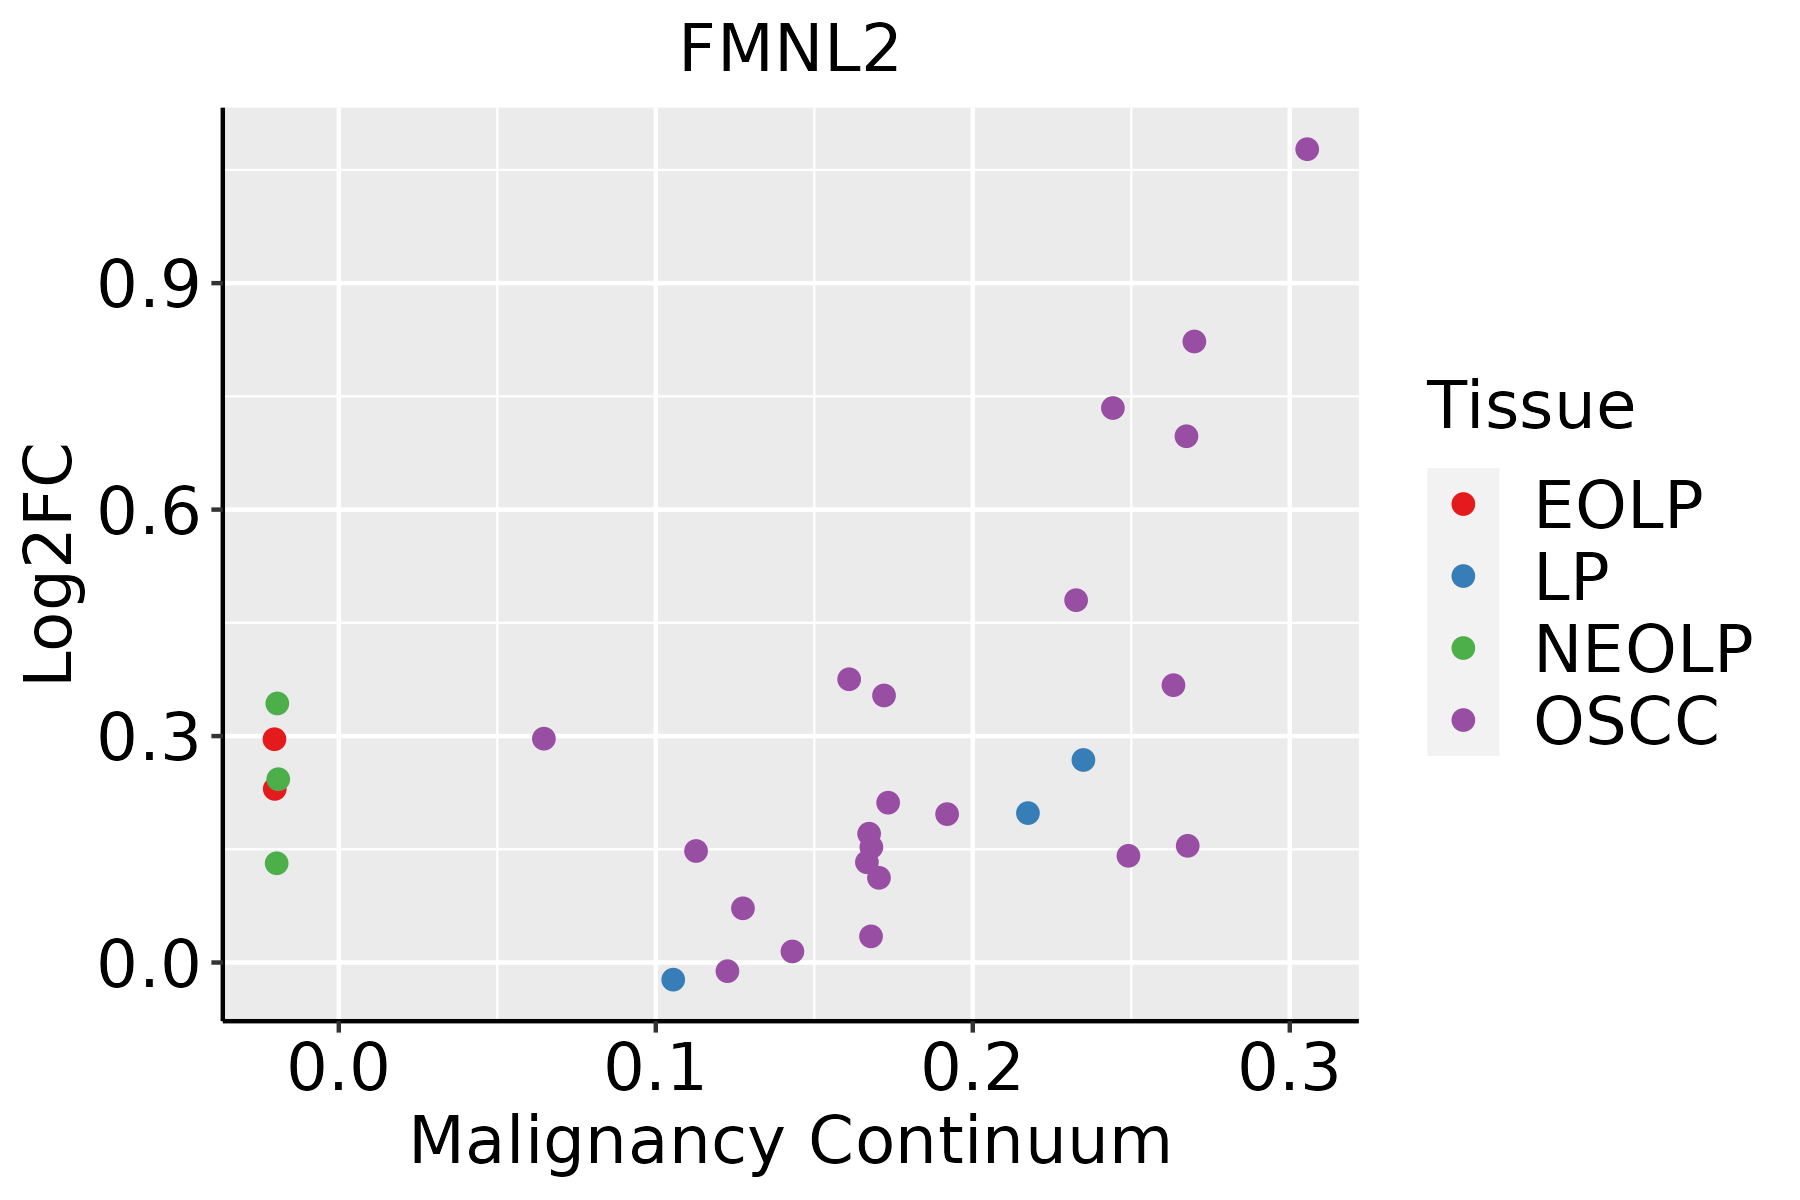
EOLP: Erosive Oral lichen planus
LP: leukoplakia
NEOLP: Non-erosive oral lichen planus
OSCC: Oral squamous cell carcinoma
ProstateThe image shows the transcriptomic changes along malignancy continuum.log2FC in expression of this searched gene in stem-like cells from each diseased tissue sample relative to stem-like cells in normal samples in each tissue plotted against the malignancy continuum. Samples are colored based on if they are from different disease stage.
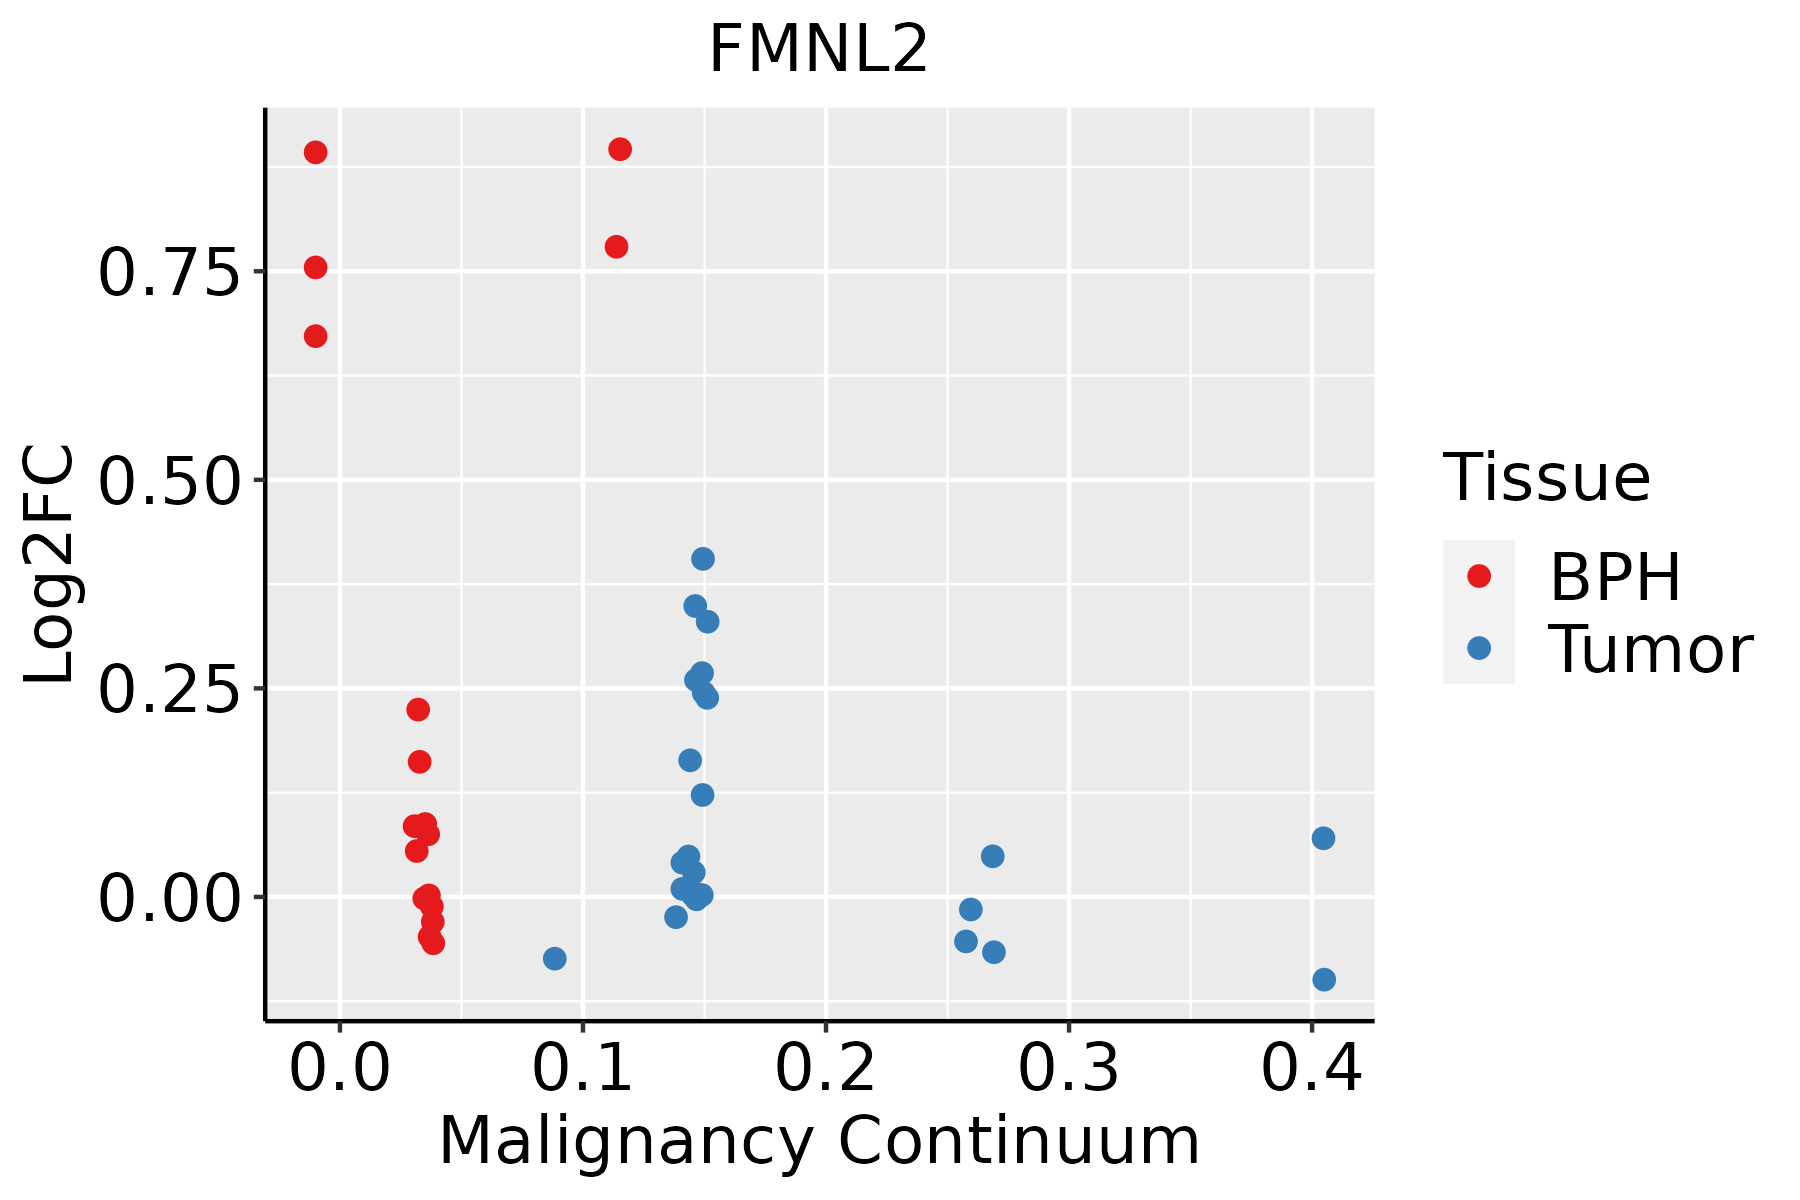
BPH: Benign Prostatic Hyperplasia
SkinThe image shows the transcriptomic changes along malignancy continuum.log2FC in expression of this searched gene in stem-like cells from each diseased tissue sample relative to stem-like cells in normal samples in each tissue plotted against the malignancy continuum. Samples are colored based on if they are from different disease stage.
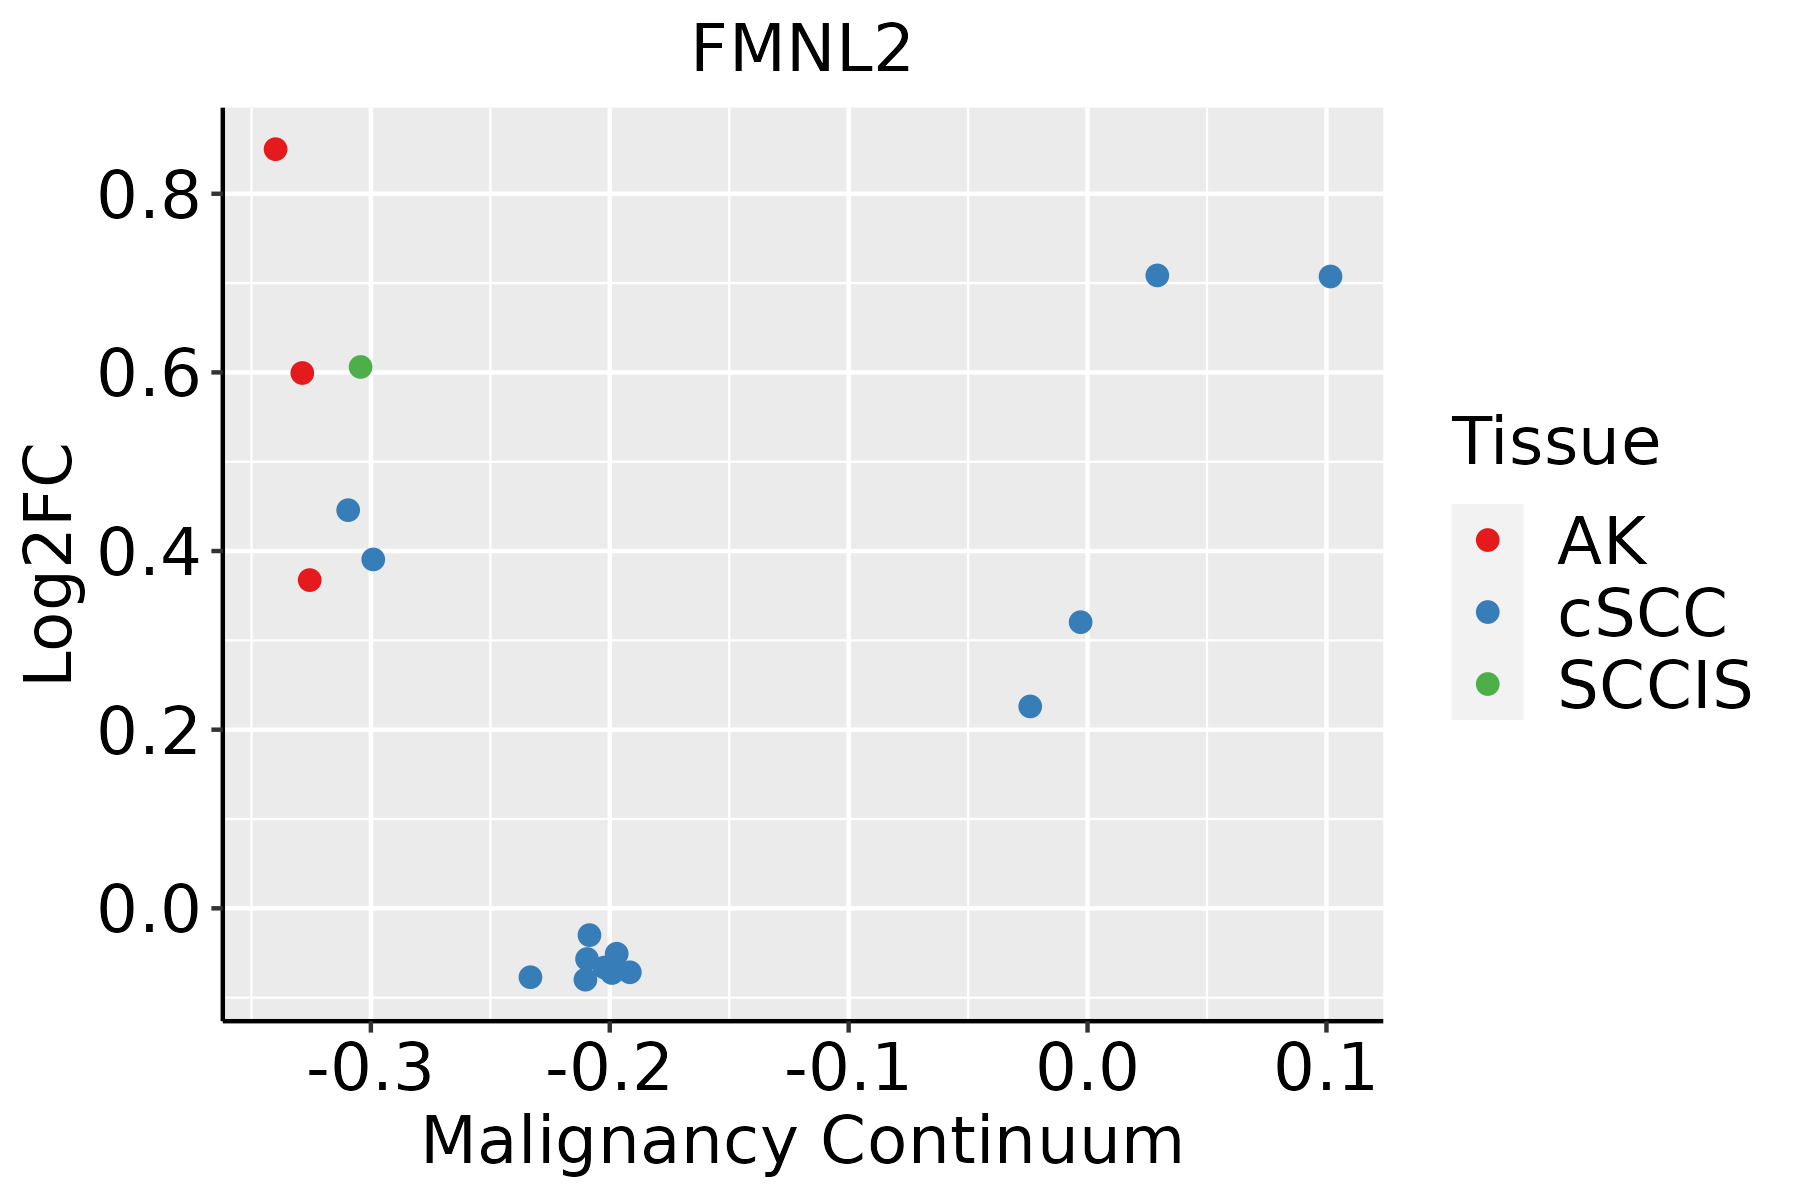
AK: Actinic keratosis
cSCC: Cutaneous squamous cell carcinoma
SCCIS:squamous cell carcinoma in situ
ThyroidThe image shows the transcriptomic changes along malignancy continuum.log2FC in expression of this searched gene in stem-like cells from each diseased tissue sample relative to stem-like cells in normal samples in each tissue plotted against the malignancy continuum. Samples are colored based on if they are from different disease stage.
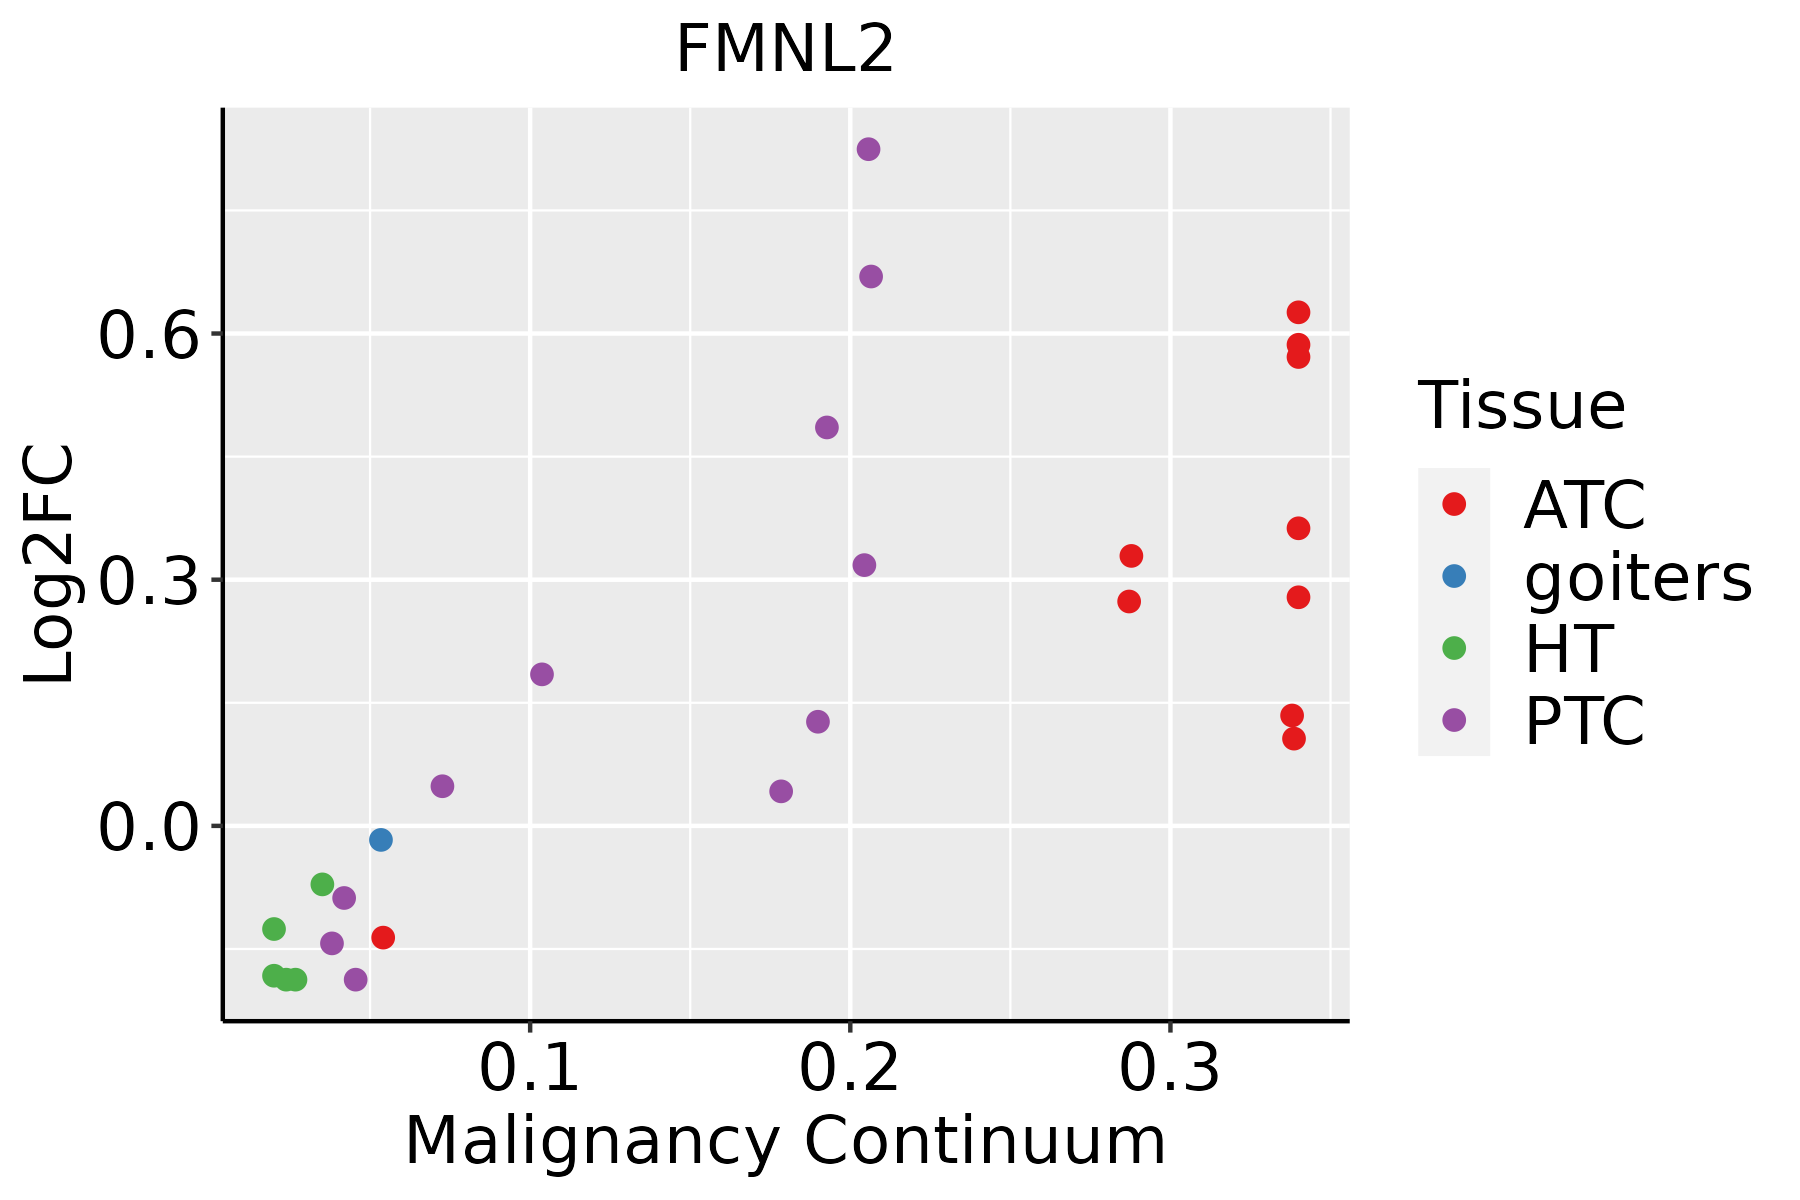
ATC: Anaplastic thyroid cancer
HT: Hashimoto's thyroiditis
PTC: Papillary thyroid cancer
∗log2FC in expression of this searched gene in stem-like cells from each diseased tissue sample relative to stem-like cells in normal samples in each tissue plotted against the malignancy continuum. Samples are colored based on if they are from different disease stage.

Top

Malignant transformation related pathway analysis

check buttonFind out the enriched GO biological processes and KEGG pathways involved in transition from healthy to precancer to cancer
check button Figure of enriched GO biological processes.
TissueDisease StageEnriched GO biological Processes
ColorectumADGO analysis - Figure of enriched GO biological processes: Top 15 enriched GO BP terms are showed in the bar plot of each disease state in each tissue. Each row represents a significant GO biological process which is colored according to the -log10(p.adjust).
ColorectumSERGO analysis - Figure of enriched GO biological processes: Top 15 enriched GO BP terms are showed in the bar plot of each disease state in each tissue. Each row represents a significant GO biological process which is colored according to the -log10(p.adjust).
ColorectumMSSGO analysis - Figure of enriched GO biological processes: Top 15 enriched GO BP terms are showed in the bar plot of each disease state in each tissue. Each row represents a significant GO biological process which is colored according to the -log10(p.adjust).
ColorectumMSI-HGO analysis - Figure of enriched GO biological processes: Top 15 enriched GO BP terms are showed in the bar plot of each disease state in each tissue. Each row represents a significant GO biological process which is colored according to the -log10(p.adjust).
ColorectumFAPGO analysis - Figure of enriched GO biological processes: Top 15 enriched GO BP terms are showed in the bar plot of each disease state in each tissue. Each row represents a significant GO biological process which is colored according to the -log10(p.adjust).
∗Top 15 enriched GO BP terms are showed in the bar plot of each disease state in each tissue. Each row represents a significant GO biological process which is colored according to the -log10(p.adjust).
Page: 1 2 3 4 5 6 7 8 9 

check button Enriched GO biological processes.
GO IDTissueDisease StageDescriptionGene RatioBg Ratiopvaluep.adjustCount
GO:002260410CervixCCregulation of cell morphogenesis84/2311309/187231.00e-124.29e-1084
GO:00083608CervixCCregulation of cell shape38/2311154/187231.86e-053.46e-0438
GO:00308657CervixCCcortical cytoskeleton organization19/231161/187238.72e-051.16e-0319
GO:00308667CervixCCcortical actin cytoskeleton organization12/231140/187232.44e-031.71e-0212
GO:0022604ColorectumADregulation of cell morphogenesis109/3918309/187233.08e-092.07e-07109
GO:0008360ColorectumADregulation of cell shape56/3918154/187237.01e-061.73e-0456
GO:0030866ColorectumADcortical actin cytoskeleton organization19/391840/187231.58e-042.20e-0319
GO:0030865ColorectumADcortical cytoskeleton organization25/391861/187232.96e-043.60e-0325
GO:00226041ColorectumSERregulation of cell morphogenesis89/2897309/187231.51e-091.52e-0789
GO:00083601ColorectumSERregulation of cell shape43/2897154/187235.47e-051.30e-0343
GO:00308651ColorectumSERcortical cytoskeleton organization19/289761/187231.59e-031.69e-0219
GO:00308661ColorectumSERcortical actin cytoskeleton organization14/289740/187231.88e-031.90e-0214
GO:00226042ColorectumMSSregulation of cell morphogenesis103/3467309/187232.70e-102.56e-08103
GO:00083602ColorectumMSSregulation of cell shape52/3467154/187234.40e-061.24e-0452
GO:00308652ColorectumMSScortical cytoskeleton organization24/346761/187231.16e-041.81e-0324
GO:00308662ColorectumMSScortical actin cytoskeleton organization17/346740/187233.87e-044.86e-0317
GO:00226044ColorectumFAPregulation of cell morphogenesis87/2622309/187234.89e-111.87e-0887
GO:00083603ColorectumFAPregulation of cell shape43/2622154/187234.55e-061.52e-0443
GO:00308663ColorectumFAPcortical actin cytoskeleton organization14/262240/187236.94e-047.50e-0314
GO:00308653ColorectumFAPcortical cytoskeleton organization18/262261/187231.30e-031.20e-0218
Page: 1 2 3 4 5 

check button Enriched KEGG pathways.
Pathway IDTissueDisease StageDescriptionGene RatioBg Ratiopvaluep.adjustqvalueCount
Page: 1 

Top

Cell-cell communication analysis

check buttonIdentification of potential cell-cell interactions between two cell types and their ligand-receptor pairs for different disease states
LigandReceptorLRpairPathwayTissueDisease Stage
Page: 1 

Top

Single-cell gene regulatory network inference analysis

check buttonFind out the significant the regulons (TFs) and the target genes of each regulon across cell types for different disease states
TFCell TypeTissueDisease StageTarget GeneRSSRegulon Activity
∗The dot plots of a searched regulon are shown for all cell subpopulations in each disease state of each tissue based on the regulon specific score inferred using pySCENIC and by calculating the average expression.
Page: 1 

Top

Somatic mutation of malignant transformation related genes

check buttonAnnotation of somatic variants for genes involved in malignant transformation
Hugo SymbolVariant ClassVariant ClassificationdbSNP RSHGVScHGVSpHGVSp ShortSWISSPROTBIOTYPESIFTPolyPhenTumor Sample BarcodeTissueHistologySexAgeStageTherapy TypesDrugsOutcome
FMNL2SNVMissense_Mutationc.2992N>Tp.Leu998Phep.L998FQ96PY5protein_codingtolerated(0.13)possibly_damaging(0.749)TCGA-A7-A26H-01Breastbreast invasive carcinomaFemale>=65I/IIHormone TherapyanastrozolePD
FMNL2SNVMissense_Mutationnovelc.1088N>Cp.Lys363Thrp.K363TQ96PY5protein_codingdeleterious(0.01)probably_damaging(0.994)TCGA-AN-A046-01Breastbreast invasive carcinomaFemale>=65I/IIUnknownUnknownSD
FMNL2SNVMissense_Mutationnovelc.1355N>Tp.Arg452Ilep.R452IQ96PY5protein_codingdeleterious(0)probably_damaging(0.994)TCGA-AN-A046-01Breastbreast invasive carcinomaFemale>=65I/IIUnknownUnknownSD
FMNL2SNVMissense_Mutationnovelc.3053N>Tp.Ser1018Phep.S1018FQ96PY5protein_codingdeleterious(0.02)benign(0.159)TCGA-BH-A1FC-01Breastbreast invasive carcinomaFemale>=65I/IIUnknownUnknownSD
FMNL2SNVMissense_Mutationrs377550607c.571N>Tp.Arg191Cysp.R191CQ96PY5protein_codingdeleterious(0.01)probably_damaging(0.992)TCGA-E9-A1R6-01Breastbreast invasive carcinomaFemale<65I/IIHormone TherapytamoxiphenSD
FMNL2SNVMissense_Mutationc.733N>Gp.Pro245Alap.P245AQ96PY5protein_codingtolerated(0.08)benign(0.187)TCGA-E9-A243-01Breastbreast invasive carcinomaFemale<65I/IIChemotherapy5-fluorouracilPD
FMNL2SNVMissense_Mutationc.2839G>Ap.Ala947Thrp.A947TQ96PY5protein_codingdeleterious(0)probably_damaging(0.963)TCGA-2W-A8YY-01Cervixcervical & endocervical cancerFemale<65I/IIChemotherapycisplatinCR
FMNL2SNVMissense_Mutationnovelc.1002G>Ap.Met334Ilep.M334IQ96PY5protein_codingdeleterious(0)probably_damaging(0.946)TCGA-HM-A4S6-01Cervixcervical & endocervical cancerFemale<65III/IVChemotherapycisplatinCR
FMNL2SNVMissense_Mutationnovelc.2956N>Ap.Glu986Lysp.E986KQ96PY5protein_codingtolerated(0.23)benign(0.159)TCGA-VS-A8EL-01Cervixcervical & endocervical cancerFemale<65I/IIChemotherapycisplatinCR
FMNL2SNVMissense_Mutationnovelc.1150N>Ap.Asp384Asnp.D384NQ96PY5protein_codingdeleterious(0)probably_damaging(0.993)TCGA-ZJ-AAXU-01Cervixcervical & endocervical cancerFemale<65I/IIUnknownUnknownSD
Page: 1 2 3 4 5 6 7 8 9 10 

Top

Related drugs of malignant transformation related genes

check buttonIdentification of chemicals and drugs interact with genes involved in malignant transfromation
(DGIdb 4.0)
Entrez IDSymbolCategoryInteraction TypesDrug Claim NameDrug NamePMIDs
Page: 1