
|
|||||
|
 | |
| |
| |
| |
| |
| |
|
Gene: FLT3LG |
Gene summary for FLT3LG |
| Gene information | Species | Human | Gene symbol | FLT3LG | Gene ID | 2323 |
| Gene name | fms related receptor tyrosine kinase 3 ligand | |
| Gene Alias | FL | |
| Cytomap | 19q13.33 | |
| Gene Type | protein-coding | GO ID | GO:0002376 | UniProtAcc | B7ZLY4 |
Top |
Malignant transformation analysis |
| Identification of the aberrant gene expression in precancerous and cancerous lesions by comparing the gene expression of stem-like cells in diseased tissues with normal stem cells |
| Entrez ID | Symbol | Replicates | Species | Organ | Tissue | Adj P-value | Log2FC | Malignancy |
| 2323 | FLT3LG | LZE7T | Human | Esophagus | ESCC | 3.28e-02 | 2.50e-01 | 0.0667 |
| 2323 | FLT3LG | LZE24T | Human | Esophagus | ESCC | 2.95e-10 | 3.19e-01 | 0.0596 |
| 2323 | FLT3LG | LZE6T | Human | Esophagus | ESCC | 1.87e-06 | 2.94e-01 | 0.0845 |
| 2323 | FLT3LG | P2T-E | Human | Esophagus | ESCC | 9.35e-10 | 2.16e-01 | 0.1177 |
| 2323 | FLT3LG | P4T-E | Human | Esophagus | ESCC | 2.41e-09 | 2.25e-01 | 0.1323 |
| 2323 | FLT3LG | P5T-E | Human | Esophagus | ESCC | 2.02e-06 | 1.33e-01 | 0.1327 |
| 2323 | FLT3LG | P8T-E | Human | Esophagus | ESCC | 3.95e-30 | 5.47e-01 | 0.0889 |
| 2323 | FLT3LG | P9T-E | Human | Esophagus | ESCC | 2.42e-02 | 1.32e-01 | 0.1131 |
| 2323 | FLT3LG | P11T-E | Human | Esophagus | ESCC | 1.83e-07 | 3.59e-01 | 0.1426 |
| 2323 | FLT3LG | P12T-E | Human | Esophagus | ESCC | 9.67e-18 | 2.98e-01 | 0.1122 |
| 2323 | FLT3LG | P15T-E | Human | Esophagus | ESCC | 3.51e-06 | 1.58e-01 | 0.1149 |
| 2323 | FLT3LG | P16T-E | Human | Esophagus | ESCC | 1.88e-04 | 1.11e-01 | 0.1153 |
| 2323 | FLT3LG | P20T-E | Human | Esophagus | ESCC | 8.51e-14 | 2.91e-01 | 0.1124 |
| 2323 | FLT3LG | P21T-E | Human | Esophagus | ESCC | 6.56e-15 | 2.83e-01 | 0.1617 |
| 2323 | FLT3LG | P22T-E | Human | Esophagus | ESCC | 8.56e-12 | 2.05e-01 | 0.1236 |
| 2323 | FLT3LG | P23T-E | Human | Esophagus | ESCC | 4.22e-14 | 3.52e-01 | 0.108 |
| 2323 | FLT3LG | P24T-E | Human | Esophagus | ESCC | 3.19e-23 | 4.25e-01 | 0.1287 |
| 2323 | FLT3LG | P26T-E | Human | Esophagus | ESCC | 3.16e-34 | 5.07e-01 | 0.1276 |
| 2323 | FLT3LG | P27T-E | Human | Esophagus | ESCC | 9.91e-09 | 1.73e-01 | 0.1055 |
| 2323 | FLT3LG | P28T-E | Human | Esophagus | ESCC | 3.50e-02 | 5.90e-02 | 0.1149 |
| Page: 1 2 3 |
| Tissue | Expression Dynamics | Abbreviation |
| Esophagus | 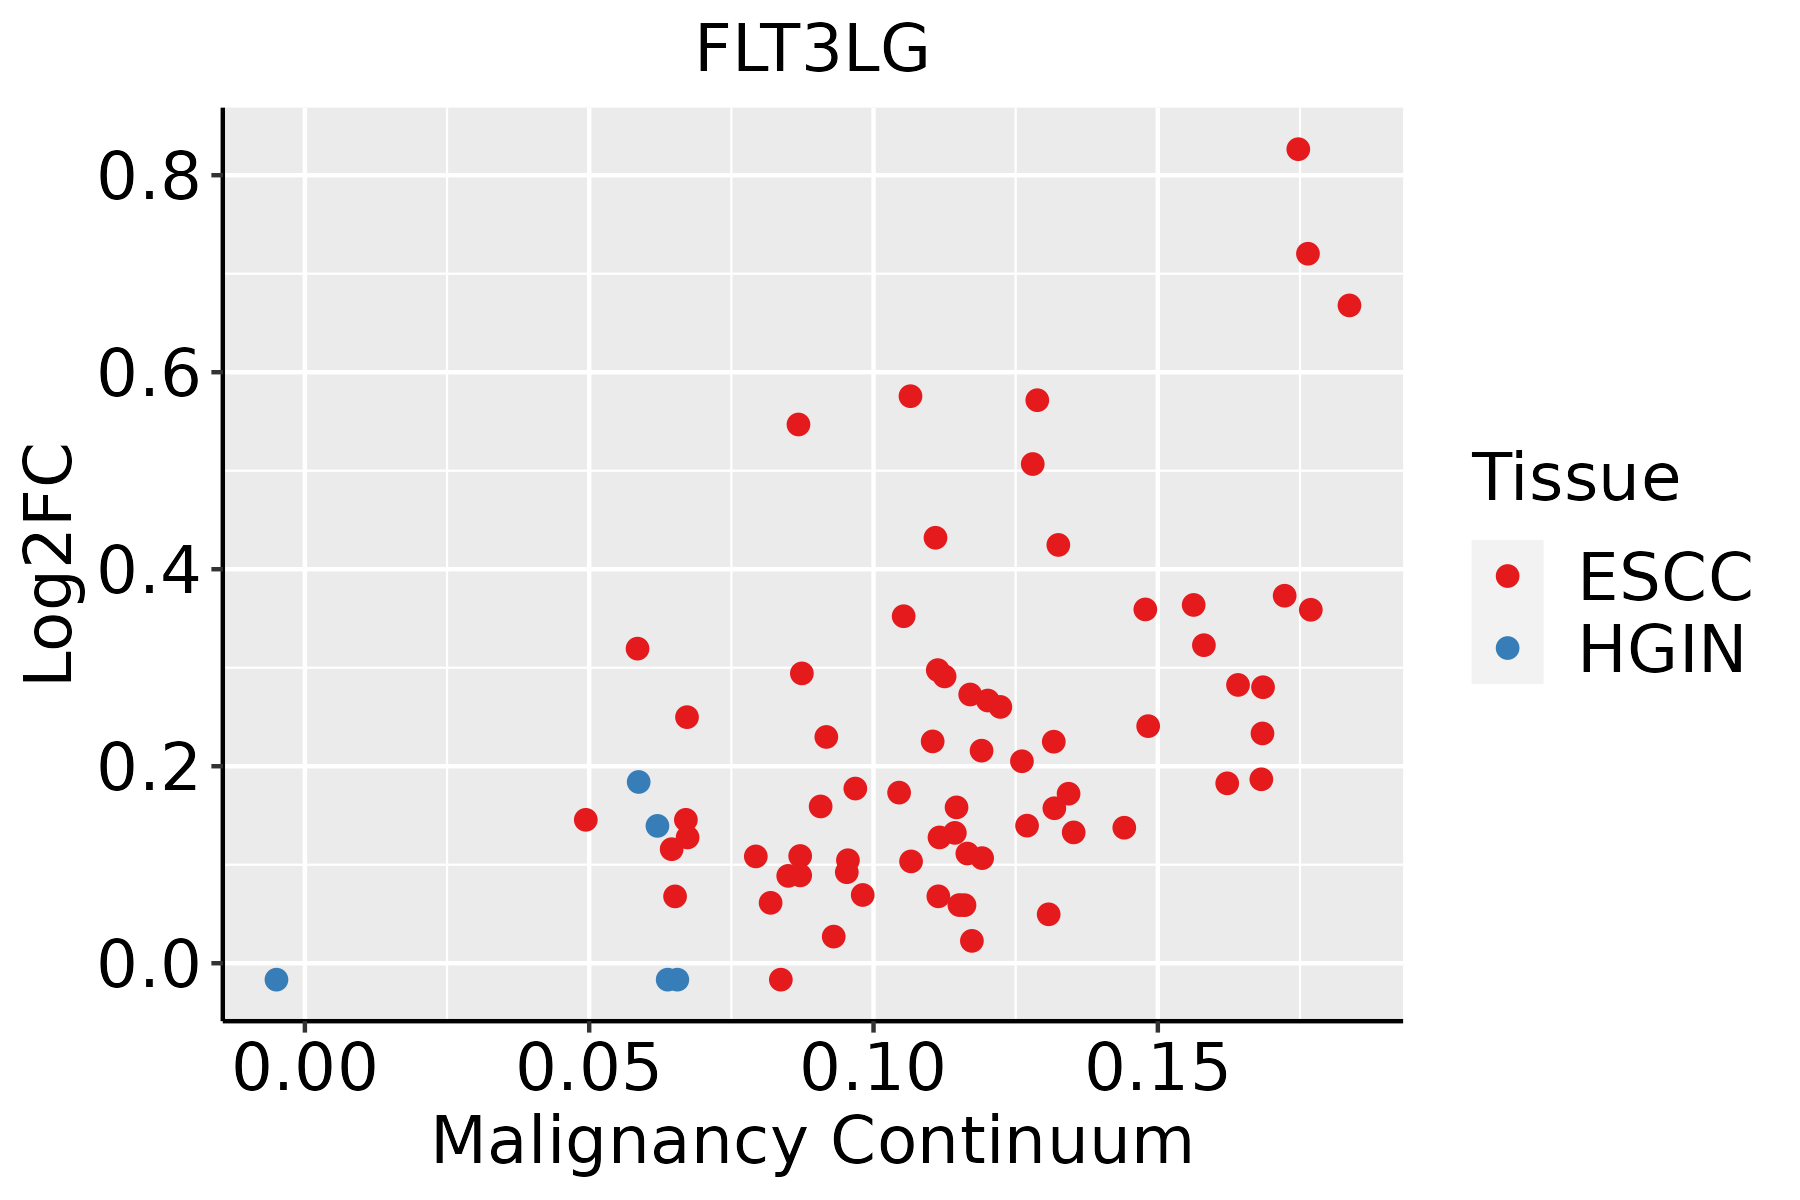 | ESCC: Esophageal squamous cell carcinoma |
| HGIN: High-grade intraepithelial neoplasias | ||
| LGIN: Low-grade intraepithelial neoplasias | ||
| Thyroid | 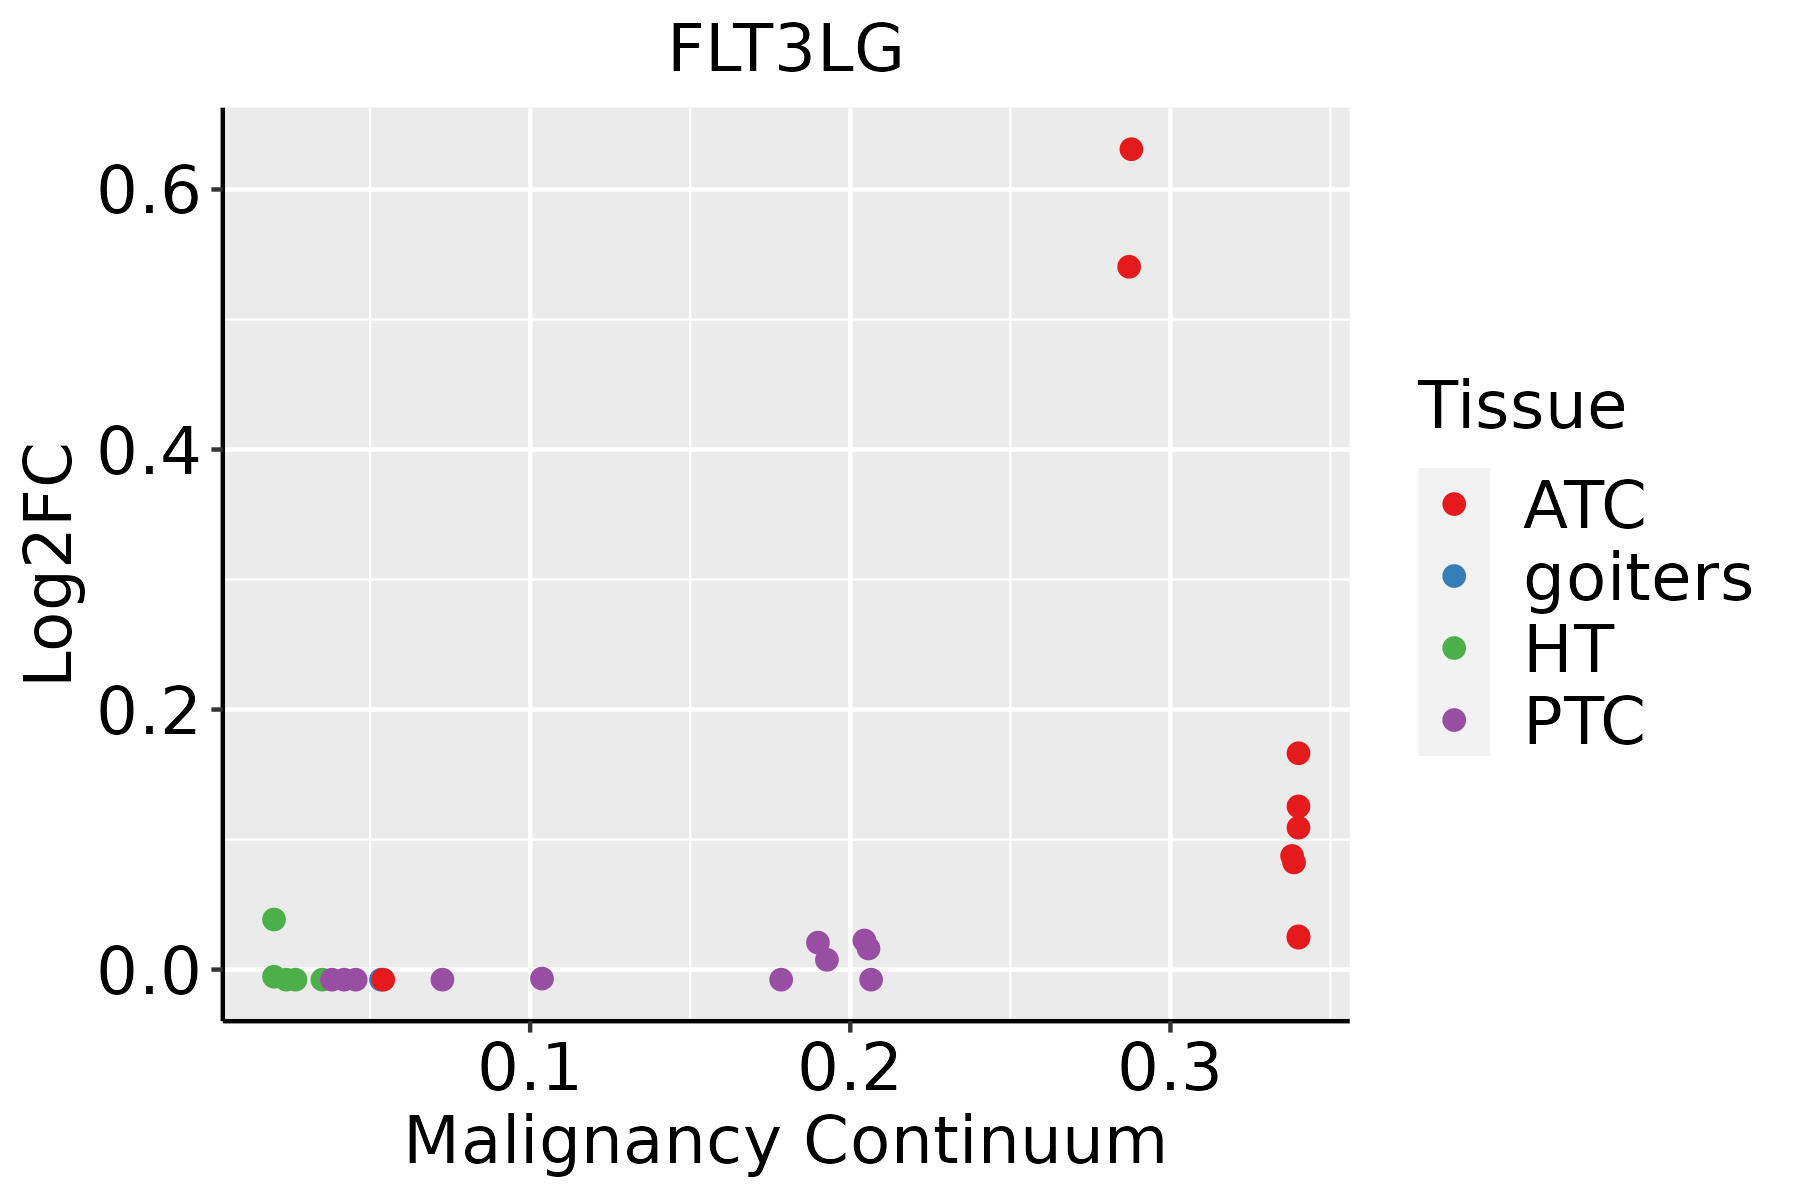 | ATC: Anaplastic thyroid cancer |
| HT: Hashimoto's thyroiditis | ||
| PTC: Papillary thyroid cancer |
| ∗log2FC in expression of this searched gene in stem-like cells from each diseased tissue sample relative to stem-like cells in normal samples in each tissue plotted against the malignancy continuum. Samples are colored based on if they are from different disease stage. |
Top |
Malignant transformation related pathway analysis |
| Find out the enriched GO biological processes and KEGG pathways involved in transition from healthy to precancer to cancer |
| Tissue | Disease Stage | Enriched GO biological Processes |
| Colorectum | AD |  |
| Colorectum | SER |  |
| Colorectum | MSS |  |
| Colorectum | MSI-H |  |
| Colorectum | FAP |  |
| ∗Top 15 enriched GO BP terms are showed in the bar plot of each disease state in each tissue. Each row represents a significant GO biological process which is colored according to the -log10(p.adjust). |
| Page: 1 2 3 4 5 6 7 8 9 |
| GO ID | Tissue | Disease Stage | Description | Gene Ratio | Bg Ratio | pvalue | p.adjust | Count |
| GO:00485687 | Esophagus | ESCC | embryonic organ development | 228/8552 | 427/18723 | 7.28e-04 | 3.79e-03 | 228 |
| GO:00485688 | Thyroid | ATC | embryonic organ development | 172/6293 | 427/18723 | 2.08e-03 | 9.84e-03 | 172 |
| Page: 1 |
| Pathway ID | Tissue | Disease Stage | Description | Gene Ratio | Bg Ratio | pvalue | p.adjust | qvalue | Count |
| hsa041517 | Esophagus | ESCC | PI3K-Akt signaling pathway | 197/4205 | 354/8465 | 1.24e-02 | 2.83e-02 | 1.45e-02 | 197 |
| hsa0415114 | Esophagus | ESCC | PI3K-Akt signaling pathway | 197/4205 | 354/8465 | 1.24e-02 | 2.83e-02 | 1.45e-02 | 197 |
| Page: 1 |
Top |
Cell-cell communication analysis |
| Identification of potential cell-cell interactions between two cell types and their ligand-receptor pairs for different disease states |
| Ligand | Receptor | LRpair | Pathway | Tissue | Disease Stage |
| FLT3LG | FLT3 | FLT3L_FLT3 | FLT3 | Breast | DCIS |
| FLT3LG | FLT3 | FLT3L_FLT3 | FLT3 | HNSCC | Precancer |
| FLT3LG | FLT3 | FLT3L_FLT3 | FLT3 | Lung | AAH |
| FLT3LG | FLT3 | FLT3L_FLT3 | FLT3 | Lung | Precancer |
| FLT3LG | FLT3 | FLT3L_FLT3 | FLT3 | Skin | ADJ |
| FLT3LG | FLT3 | FLT3L_FLT3 | FLT3 | Skin | cSCC |
| Page: 1 |
Top |
Single-cell gene regulatory network inference analysis |
| Find out the significant the regulons (TFs) and the target genes of each regulon across cell types for different disease states |
| TF | Cell Type | Tissue | Disease Stage | Target Gene | RSS | Regulon Activity |
| ∗The dot plots of a searched regulon are shown for all cell subpopulations in each disease state of each tissue based on the regulon specific score inferred using pySCENIC and by calculating the average expression. |
| Page: 1 |
Top |
Somatic mutation of malignant transformation related genes |
| Annotation of somatic variants for genes involved in malignant transformation |
| Hugo Symbol | Variant Class | Variant Classification | dbSNP RS | HGVSc | HGVSp | HGVSp Short | SWISSPROT | BIOTYPE | SIFT | PolyPhen | Tumor Sample Barcode | Tissue | Histology | Sex | Age | Stage | Therapy Types | Drugs | Outcome |
| FLT3LG | SNV | Missense_Mutation | c.178N>C | p.Val60Leu | p.V60L | P49771 | protein_coding | tolerated(0.17) | benign(0.141) | TCGA-D8-A1JA-01 | Breast | breast invasive carcinoma | Female | <65 | III/IV | Chemotherapy | adriamycin | PD | |
| FLT3LG | SNV | Missense_Mutation | novel | c.92C>G | p.Ser31Cys | p.S31C | P49771 | protein_coding | tolerated(0.06) | possibly_damaging(0.727) | TCGA-4J-AA1J-01 | Cervix | cervical & endocervical cancer | Female | <65 | I/II | Unknown | Unknown | SD |
| FLT3LG | SNV | Missense_Mutation | c.124G>A | p.Ala42Thr | p.A42T | P49771 | protein_coding | tolerated(0.48) | benign(0.091) | TCGA-AA-3973-01 | Colorectum | colon adenocarcinoma | Male | >=65 | III/IV | Targeted Molecular therapy | bevacizumab | SD | |
| FLT3LG | SNV | Missense_Mutation | c.536C>A | p.Pro179Gln | p.P179Q | P49771 | protein_coding | tolerated(0.1) | possibly_damaging(0.599) | TCGA-AD-5900-01 | Colorectum | colon adenocarcinoma | Male | >=65 | I/II | Unknown | Unknown | SD | |
| FLT3LG | SNV | Missense_Mutation | novel | c.31A>G | p.Thr11Ala | p.T11A | P49771 | protein_coding | tolerated_low_confidence(0.15) | benign(0.336) | TCGA-A5-A0G2-01 | Endometrium | uterine corpus endometrioid carcinoma | Female | <65 | III/IV | Unknown | Unknown | SD |
| FLT3LG | SNV | Missense_Mutation | rs368101323 | c.631N>T | p.Arg211Trp | p.R211W | P49771 | protein_coding | tolerated(0.08) | benign(0.001) | TCGA-AP-A059-01 | Endometrium | uterine corpus endometrioid carcinoma | Female | >=65 | I/II | Unknown | Unknown | SD |
| FLT3LG | SNV | Missense_Mutation | c.124G>A | p.Ala42Thr | p.A42T | P49771 | protein_coding | tolerated(0.48) | benign(0.091) | TCGA-AP-A1DK-01 | Endometrium | uterine corpus endometrioid carcinoma | Female | <65 | I/II | Unknown | Unknown | SD | |
| FLT3LG | SNV | Missense_Mutation | novel | c.598N>A | p.Ala200Thr | p.A200T | P49771 | protein_coding | tolerated(0.18) | benign(0.115) | TCGA-BK-A13B-01 | Endometrium | uterine corpus endometrioid carcinoma | Female | <65 | I/II | Unknown | Unknown | PD |
| FLT3LG | SNV | Missense_Mutation | novel | c.434T>C | p.Ile145Thr | p.I145T | P49771 | protein_coding | deleterious(0.02) | probably_damaging(1) | TCGA-EY-A2OP-01 | Endometrium | uterine corpus endometrioid carcinoma | Female | <65 | I/II | Unknown | Unknown | SD |
| FLT3LG | SNV | Missense_Mutation | rs79058858 | c.308N>T | p.Thr103Met | p.T103M | P49771 | protein_coding | deleterious(0) | probably_damaging(0.983) | TCGA-FI-A2D0-01 | Endometrium | uterine corpus endometrioid carcinoma | Female | <65 | I/II | Unknown | Unknown | SD |
| Page: 1 2 |
Top |
Related drugs of malignant transformation related genes |
| Identification of chemicals and drugs interact with genes involved in malignant transfromation |
| (DGIdb 4.0) |
| Entrez ID | Symbol | Category | Interaction Types | Drug Claim Name | Drug Name | PMIDs |
| Page: 1 |

Copyright 2023-Present -The University of Texas Health Science Center at Houston |