
|
|||||
|
 | |
| |
| |
| |
| |
| |
|
Gene: FLRT3 |
Gene summary for FLRT3 |
| Gene information | Species | Human | Gene symbol | FLRT3 | Gene ID | 23767 |
| Gene name | fibronectin leucine rich transmembrane protein 3 | |
| Gene Alias | HH21 | |
| Cytomap | 20p12.1 | |
| Gene Type | protein-coding | GO ID | GO:0000902 | UniProtAcc | Q9NZU0 |
Top |
Malignant transformation analysis |
| Identification of the aberrant gene expression in precancerous and cancerous lesions by comparing the gene expression of stem-like cells in diseased tissues with normal stem cells |
| Entrez ID | Symbol | Replicates | Species | Organ | Tissue | Adj P-value | Log2FC | Malignancy |
| 23767 | FLRT3 | LZE4T | Human | Esophagus | ESCC | 1.15e-13 | 7.05e-01 | 0.0811 |
| 23767 | FLRT3 | P2T-E | Human | Esophagus | ESCC | 4.53e-16 | 3.45e-01 | 0.1177 |
| 23767 | FLRT3 | P5T-E | Human | Esophagus | ESCC | 1.81e-05 | 6.35e-02 | 0.1327 |
| 23767 | FLRT3 | P8T-E | Human | Esophagus | ESCC | 1.58e-13 | 4.22e-01 | 0.0889 |
| 23767 | FLRT3 | P10T-E | Human | Esophagus | ESCC | 3.88e-48 | 9.35e-01 | 0.116 |
| 23767 | FLRT3 | P11T-E | Human | Esophagus | ESCC | 2.14e-16 | 8.97e-01 | 0.1426 |
| 23767 | FLRT3 | P21T-E | Human | Esophagus | ESCC | 1.44e-11 | 3.06e-01 | 0.1617 |
| 23767 | FLRT3 | P22T-E | Human | Esophagus | ESCC | 7.77e-03 | -5.30e-03 | 0.1236 |
| 23767 | FLRT3 | P26T-E | Human | Esophagus | ESCC | 5.17e-47 | 1.07e+00 | 0.1276 |
| 23767 | FLRT3 | P28T-E | Human | Esophagus | ESCC | 1.83e-02 | -1.02e-02 | 0.1149 |
| 23767 | FLRT3 | P30T-E | Human | Esophagus | ESCC | 2.51e-05 | 2.33e-01 | 0.137 |
| 23767 | FLRT3 | P32T-E | Human | Esophagus | ESCC | 1.07e-12 | 3.44e-01 | 0.1666 |
| 23767 | FLRT3 | P49T-E | Human | Esophagus | ESCC | 3.72e-04 | 6.82e-01 | 0.1768 |
| 23767 | FLRT3 | P61T-E | Human | Esophagus | ESCC | 8.94e-15 | 5.36e-01 | 0.099 |
| 23767 | FLRT3 | P62T-E | Human | Esophagus | ESCC | 1.55e-20 | 6.68e-01 | 0.1302 |
| 23767 | FLRT3 | P65T-E | Human | Esophagus | ESCC | 7.80e-11 | 3.00e-01 | 0.0978 |
| 23767 | FLRT3 | P79T-E | Human | Esophagus | ESCC | 1.36e-59 | 1.82e+00 | 0.1154 |
| 23767 | FLRT3 | P82T-E | Human | Esophagus | ESCC | 2.71e-06 | 5.21e-01 | 0.1072 |
| 23767 | FLRT3 | P91T-E | Human | Esophagus | ESCC | 4.92e-07 | 1.24e+00 | 0.1828 |
| 23767 | FLRT3 | P107T-E | Human | Esophagus | ESCC | 3.95e-04 | 2.94e-01 | 0.171 |
| Page: 1 2 3 4 |
| Tissue | Expression Dynamics | Abbreviation |
| Esophagus |  | ESCC: Esophageal squamous cell carcinoma |
| HGIN: High-grade intraepithelial neoplasias | ||
| LGIN: Low-grade intraepithelial neoplasias | ||
| Liver | 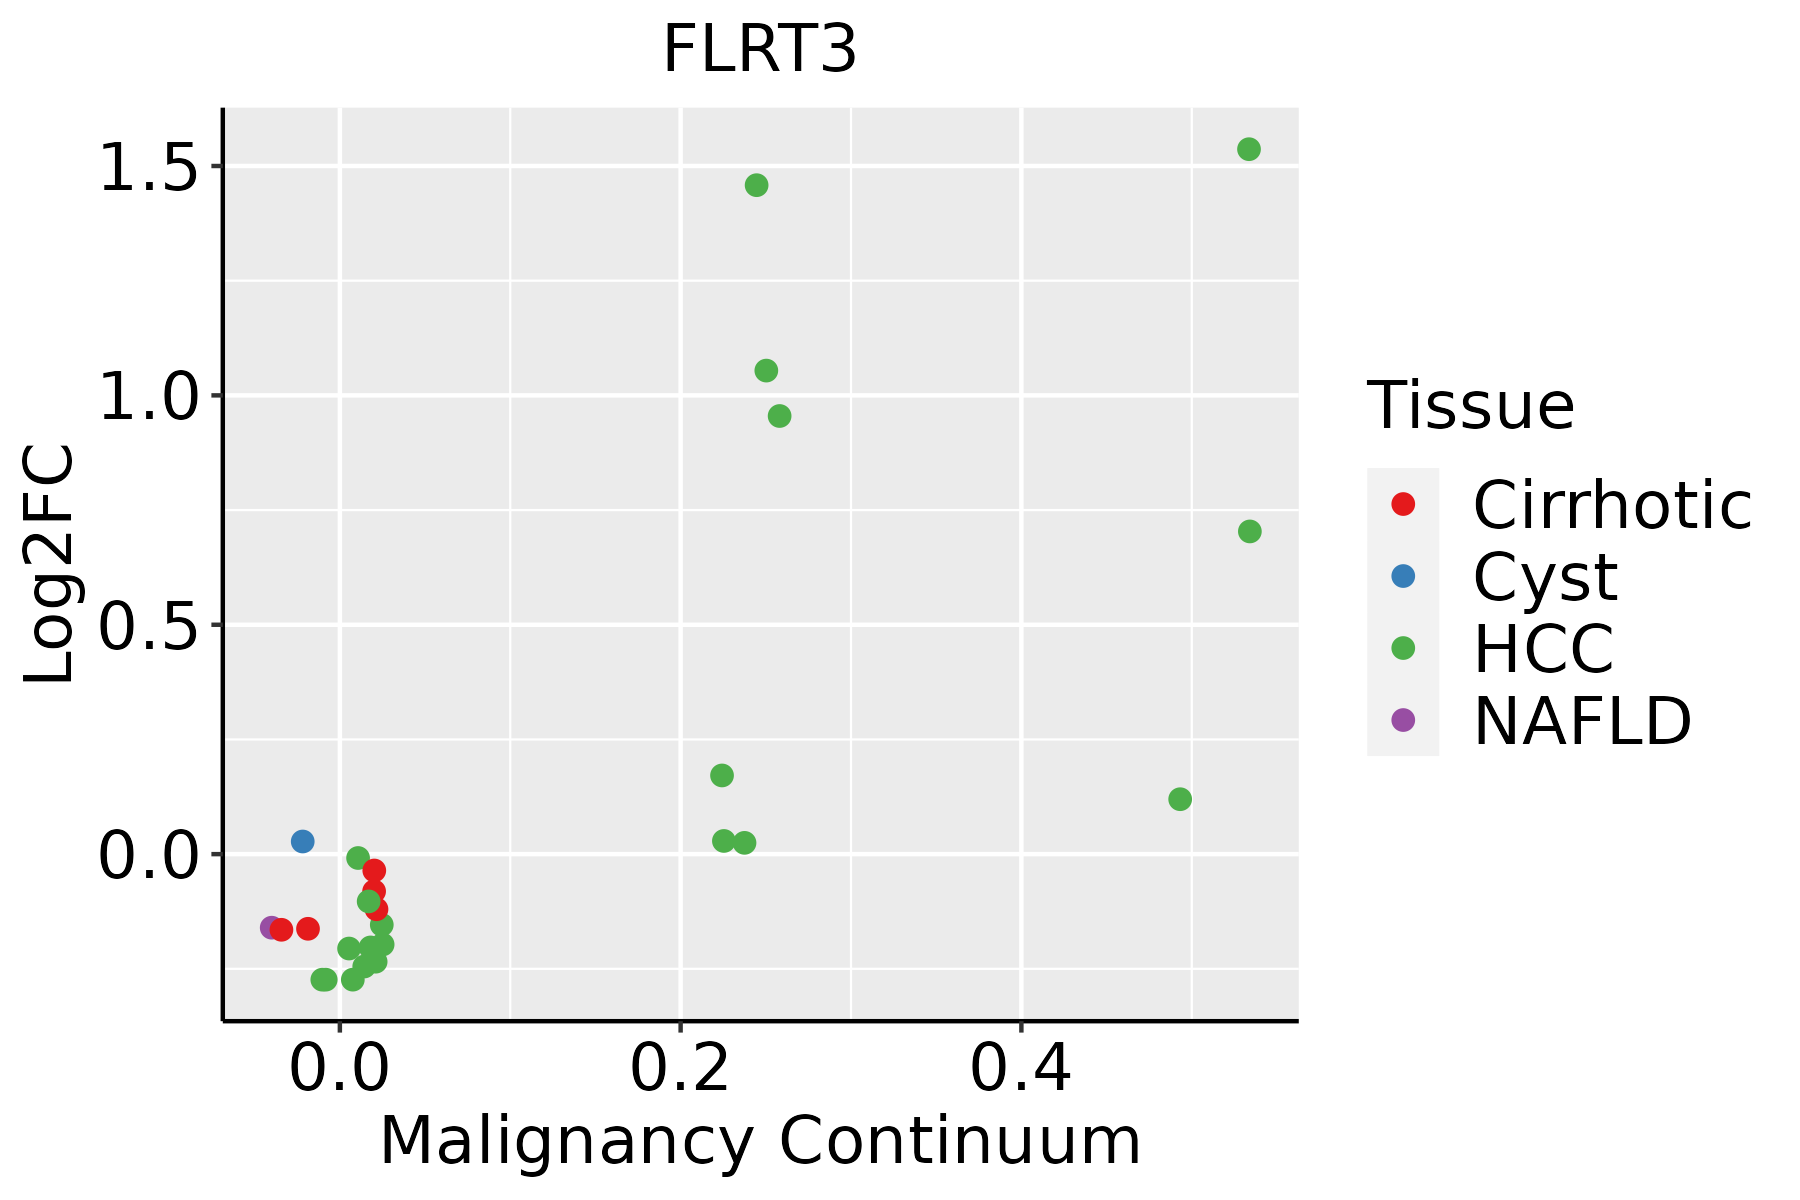 | HCC: Hepatocellular carcinoma |
| NAFLD: Non-alcoholic fatty liver disease | ||
| Oral Cavity | 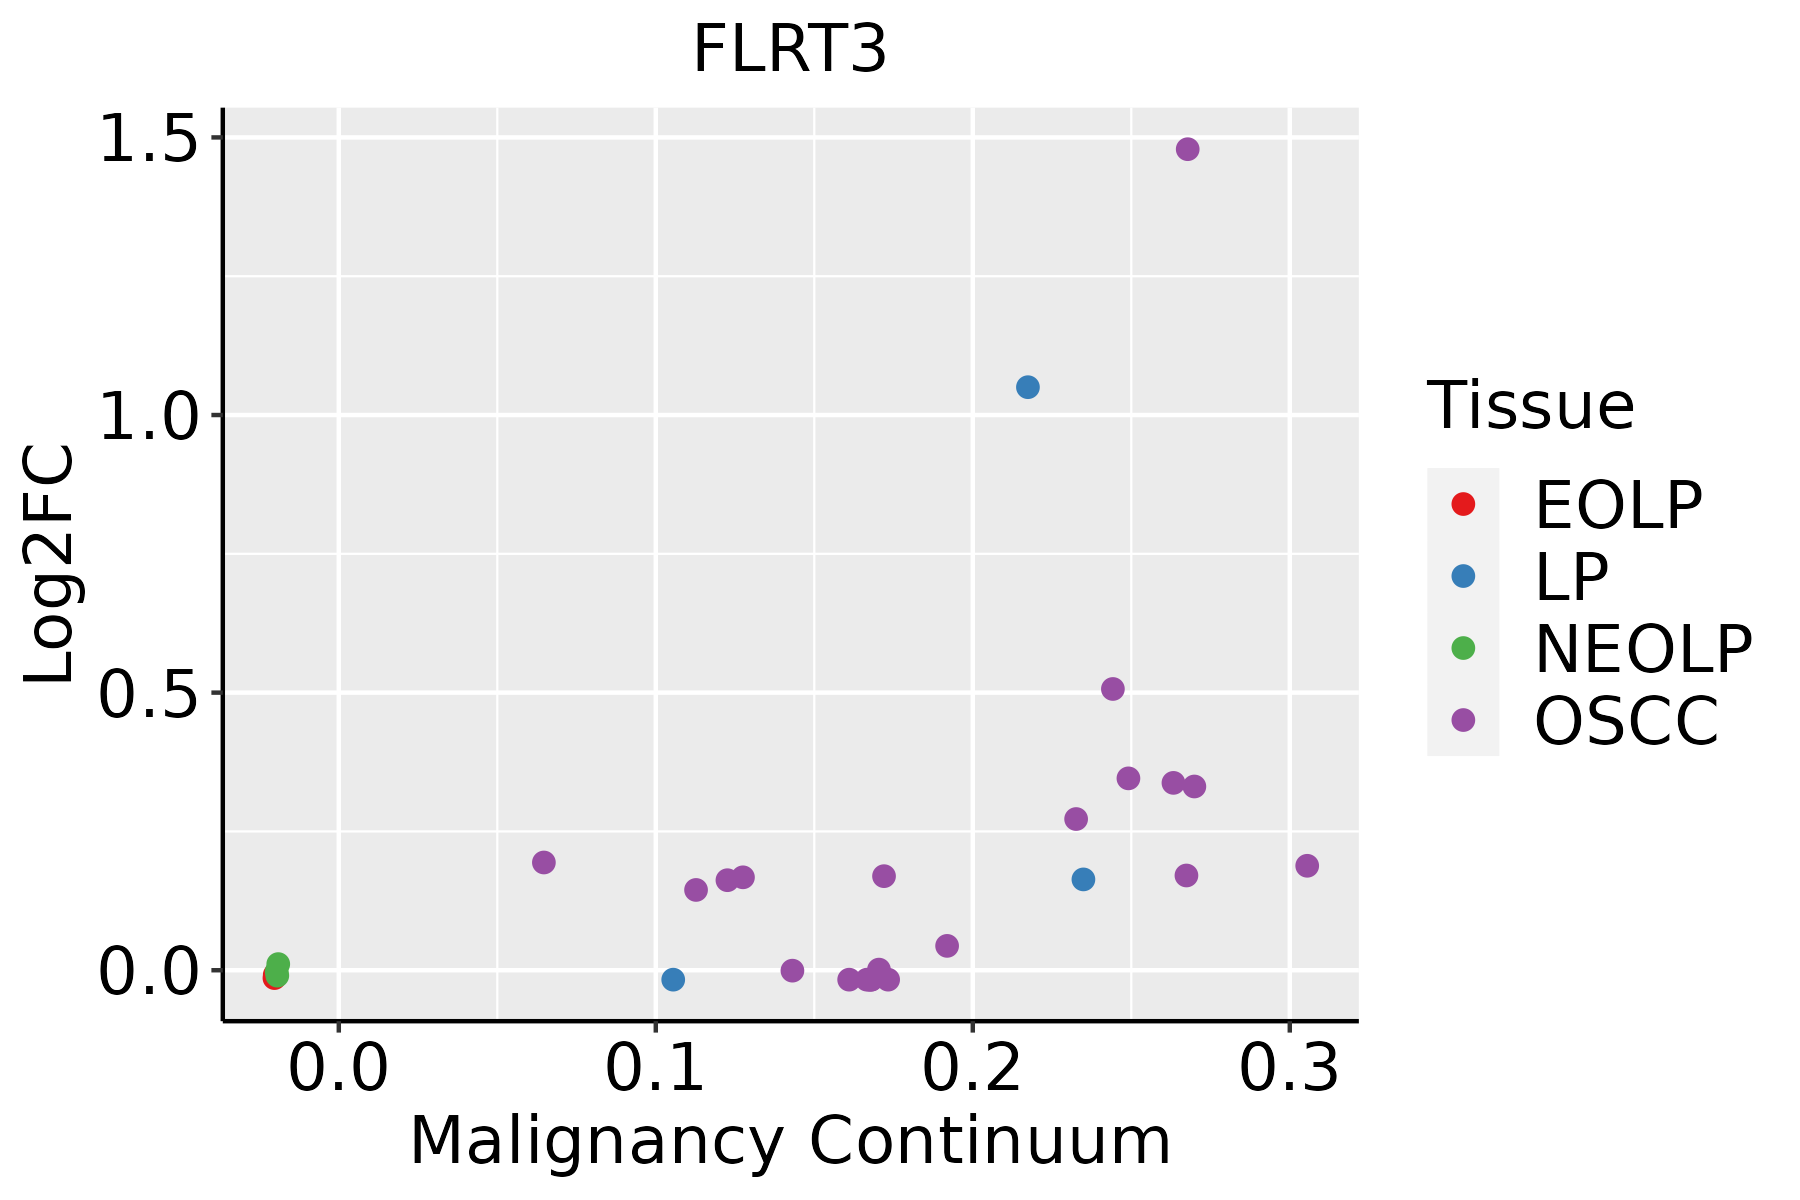 | EOLP: Erosive Oral lichen planus |
| LP: leukoplakia | ||
| NEOLP: Non-erosive oral lichen planus | ||
| OSCC: Oral squamous cell carcinoma | ||
| Prostate |  | BPH: Benign Prostatic Hyperplasia |
| Thyroid |  | ATC: Anaplastic thyroid cancer |
| HT: Hashimoto's thyroiditis | ||
| PTC: Papillary thyroid cancer |
| ∗log2FC in expression of this searched gene in stem-like cells from each diseased tissue sample relative to stem-like cells in normal samples in each tissue plotted against the malignancy continuum. Samples are colored based on if they are from different disease stage. |
Top |
Malignant transformation related pathway analysis |
| Find out the enriched GO biological processes and KEGG pathways involved in transition from healthy to precancer to cancer |
| Tissue | Disease Stage | Enriched GO biological Processes |
| Colorectum | AD |  |
| Colorectum | SER |  |
| Colorectum | MSS |  |
| Colorectum | MSI-H |  |
| Colorectum | FAP |  |
| ∗Top 15 enriched GO BP terms are showed in the bar plot of each disease state in each tissue. Each row represents a significant GO biological process which is colored according to the -log10(p.adjust). |
| Page: 1 2 3 4 5 6 7 8 9 |
| GO ID | Tissue | Disease Stage | Description | Gene Ratio | Bg Ratio | pvalue | p.adjust | Count |
| GO:0016049110 | Esophagus | ESCC | cell growth | 289/8552 | 482/18723 | 1.29e-10 | 3.77e-09 | 289 |
| GO:00020115 | Esophagus | ESCC | morphogenesis of an epithelial sheet | 42/8552 | 57/18723 | 1.62e-05 | 1.45e-04 | 42 |
| GO:006156415 | Esophagus | ESCC | axon development | 251/8552 | 467/18723 | 2.41e-04 | 1.49e-03 | 251 |
| GO:003432918 | Esophagus | ESCC | cell junction assembly | 227/8552 | 420/18723 | 3.06e-04 | 1.83e-03 | 227 |
| GO:00519606 | Esophagus | ESCC | regulation of nervous system development | 237/8552 | 443/18723 | 5.02e-04 | 2.78e-03 | 237 |
| GO:006056010 | Esophagus | ESCC | developmental growth involved in morphogenesis | 131/8552 | 234/18723 | 9.28e-04 | 4.73e-03 | 131 |
| GO:00519625 | Esophagus | ESCC | positive regulation of nervous system development | 149/8552 | 272/18723 | 1.50e-03 | 7.06e-03 | 149 |
| GO:00486785 | Esophagus | ESCC | response to axon injury | 51/8552 | 83/18723 | 2.74e-03 | 1.16e-02 | 51 |
| GO:000740915 | Esophagus | ESCC | axonogenesis | 219/8552 | 418/18723 | 3.14e-03 | 1.31e-02 | 219 |
| GO:004858810 | Esophagus | ESCC | developmental cell growth | 125/8552 | 234/18723 | 1.01e-02 | 3.46e-02 | 125 |
| GO:190188810 | Esophagus | ESCC | regulation of cell junction assembly | 109/8552 | 204/18723 | 1.53e-02 | 4.96e-02 | 109 |
| GO:001604911 | Liver | Cirrhotic | cell growth | 160/4634 | 482/18723 | 1.50e-05 | 2.07e-04 | 160 |
| GO:001604921 | Liver | HCC | cell growth | 269/7958 | 482/18723 | 1.84e-09 | 5.35e-08 | 269 |
| GO:006056011 | Liver | HCC | developmental growth involved in morphogenesis | 124/7958 | 234/18723 | 7.37e-04 | 4.47e-03 | 124 |
| GO:199013811 | Liver | HCC | neuron projection extension | 92/7958 | 172/18723 | 2.31e-03 | 1.14e-02 | 92 |
| GO:004858811 | Liver | HCC | developmental cell growth | 121/7958 | 234/18723 | 2.68e-03 | 1.28e-02 | 121 |
| GO:001604917 | Oral cavity | OSCC | cell growth | 268/7305 | 482/18723 | 6.55e-14 | 3.51e-12 | 268 |
| GO:00020114 | Oral cavity | OSCC | morphogenesis of an epithelial sheet | 37/7305 | 57/18723 | 6.66e-05 | 5.38e-04 | 37 |
| GO:00519624 | Oral cavity | OSCC | positive regulation of nervous system development | 135/7305 | 272/18723 | 2.20e-04 | 1.44e-03 | 135 |
| GO:00485889 | Oral cavity | OSCC | developmental cell growth | 116/7305 | 234/18723 | 6.20e-04 | 3.50e-03 | 116 |
| Page: 1 2 3 4 5 |
| Pathway ID | Tissue | Disease Stage | Description | Gene Ratio | Bg Ratio | pvalue | p.adjust | qvalue | Count |
| Page: 1 |
Top |
Cell-cell communication analysis |
| Identification of potential cell-cell interactions between two cell types and their ligand-receptor pairs for different disease states |
| Ligand | Receptor | LRpair | Pathway | Tissue | Disease Stage |
| Page: 1 |
Top |
Single-cell gene regulatory network inference analysis |
| Find out the significant the regulons (TFs) and the target genes of each regulon across cell types for different disease states |
| TF | Cell Type | Tissue | Disease Stage | Target Gene | RSS | Regulon Activity |
| ∗The dot plots of a searched regulon are shown for all cell subpopulations in each disease state of each tissue based on the regulon specific score inferred using pySCENIC and by calculating the average expression. |
| Page: 1 |
Top |
Somatic mutation of malignant transformation related genes |
| Annotation of somatic variants for genes involved in malignant transformation |
| Hugo Symbol | Variant Class | Variant Classification | dbSNP RS | HGVSc | HGVSp | HGVSp Short | SWISSPROT | BIOTYPE | SIFT | PolyPhen | Tumor Sample Barcode | Tissue | Histology | Sex | Age | Stage | Therapy Types | Drugs | Outcome |
| FLRT3 | SNV | Missense_Mutation | rs760038366 | c.1514N>A | p.Arg505Gln | p.R505Q | Q9NZU0 | protein_coding | tolerated(0.61) | benign(0) | TCGA-AN-A046-01 | Breast | breast invasive carcinoma | Female | >=65 | I/II | Unknown | Unknown | SD |
| FLRT3 | SNV | Missense_Mutation | c.557G>A | p.Arg186His | p.R186H | Q9NZU0 | protein_coding | deleterious(0) | probably_damaging(0.999) | TCGA-BH-A0HA-01 | Breast | breast invasive carcinoma | Female | <65 | I/II | Unknown | Unknown | SD | |
| FLRT3 | SNV | Missense_Mutation | c.1783N>A | p.Gln595Lys | p.Q595K | Q9NZU0 | protein_coding | deleterious(0.01) | possibly_damaging(0.834) | TCGA-D8-A27G-01 | Breast | breast invasive carcinoma | Female | >=65 | I/II | Unknown | Unknown | SD | |
| FLRT3 | SNV | Missense_Mutation | c.700C>T | p.Arg234Trp | p.R234W | Q9NZU0 | protein_coding | deleterious(0) | probably_damaging(1) | TCGA-E9-A243-01 | Breast | breast invasive carcinoma | Female | <65 | I/II | Chemotherapy | 5-fluorouracil | PD | |
| FLRT3 | SNV | Missense_Mutation | rs751955471 | c.701N>A | p.Arg234Gln | p.R234Q | Q9NZU0 | protein_coding | deleterious(0) | probably_damaging(0.997) | TCGA-EW-A1P4-01 | Breast | breast invasive carcinoma | Female | <65 | I/II | Chemotherapy | docetaxel | SD |
| FLRT3 | insertion | Frame_Shift_Ins | novel | c.1261_1262insGA | p.Asp421GlyfsTer14 | p.D421Gfs*14 | Q9NZU0 | protein_coding | TCGA-AR-A0U0-01 | Breast | breast invasive carcinoma | Female | >=65 | I/II | Unknown | Unknown | SD | ||
| FLRT3 | SNV | Missense_Mutation | rs564318429 | c.781N>T | p.Arg261Trp | p.R261W | Q9NZU0 | protein_coding | deleterious(0.01) | possibly_damaging(0.697) | TCGA-C5-A2LV-01 | Cervix | cervical & endocervical cancer | Female | <65 | I/II | Unknown | Unknown | SD |
| FLRT3 | SNV | Missense_Mutation | c.1100C>A | p.Thr367Asn | p.T367N | Q9NZU0 | protein_coding | tolerated(0.17) | benign(0.147) | TCGA-EX-A69M-01 | Cervix | cervical & endocervical cancer | Female | <65 | I/II | Unknown | Unknown | PD | |
| FLRT3 | SNV | Missense_Mutation | rs537766361 | c.488G>A | p.Arg163His | p.R163H | Q9NZU0 | protein_coding | deleterious(0) | probably_damaging(0.985) | TCGA-VS-A8EH-01 | Cervix | cervical & endocervical cancer | Female | <65 | III/IV | Chemotherapy | cisplatin | CR |
| FLRT3 | SNV | Missense_Mutation | rs142379846 | c.10N>A | p.Ala4Thr | p.A4T | Q9NZU0 | protein_coding | tolerated_low_confidence(0.56) | benign(0) | TCGA-AA-3715-01 | Colorectum | colon adenocarcinoma | Male | >=65 | I/II | Unknown | Unknown | PD |
| Page: 1 2 3 4 5 6 7 8 9 |
Top |
Related drugs of malignant transformation related genes |
| Identification of chemicals and drugs interact with genes involved in malignant transfromation |
| (DGIdb 4.0) |
| Entrez ID | Symbol | Category | Interaction Types | Drug Claim Name | Drug Name | PMIDs |
| Page: 1 |

Copyright 2023-Present -The University of Texas Health Science Center at Houston |