
|
|||||
|
 | |
| |
| |
| |
| |
| |
|
Gene: FLOT2 |
Gene summary for FLOT2 |
| Gene information | Species | Human | Gene symbol | FLOT2 | Gene ID | 2319 |
| Gene name | flotillin 2 | |
| Gene Alias | ECS-1 | |
| Cytomap | 17q11.2 | |
| Gene Type | protein-coding | GO ID | GO:0001765 | UniProtAcc | J3QLD9 |
Top |
Malignant transformation analysis |
| Identification of the aberrant gene expression in precancerous and cancerous lesions by comparing the gene expression of stem-like cells in diseased tissues with normal stem cells |
| Entrez ID | Symbol | Replicates | Species | Organ | Tissue | Adj P-value | Log2FC | Malignancy |
| 2319 | FLOT2 | LZE4T | Human | Esophagus | ESCC | 1.38e-08 | 2.78e-01 | 0.0811 |
| 2319 | FLOT2 | LZE5T | Human | Esophagus | ESCC | 3.85e-03 | 5.37e-01 | 0.0514 |
| 2319 | FLOT2 | LZE7T | Human | Esophagus | ESCC | 1.21e-08 | 5.49e-01 | 0.0667 |
| 2319 | FLOT2 | LZE8T | Human | Esophagus | ESCC | 6.11e-09 | 3.79e-01 | 0.067 |
| 2319 | FLOT2 | LZE22T | Human | Esophagus | ESCC | 5.43e-04 | 5.15e-01 | 0.068 |
| 2319 | FLOT2 | LZE24T | Human | Esophagus | ESCC | 5.77e-16 | 3.47e-01 | 0.0596 |
| 2319 | FLOT2 | LZE21T | Human | Esophagus | ESCC | 5.85e-04 | 5.38e-01 | 0.0655 |
| 2319 | FLOT2 | LZE6T | Human | Esophagus | ESCC | 1.52e-04 | 5.48e-01 | 0.0845 |
| 2319 | FLOT2 | P1T-E | Human | Esophagus | ESCC | 6.06e-08 | 4.48e-01 | 0.0875 |
| 2319 | FLOT2 | P2T-E | Human | Esophagus | ESCC | 6.11e-42 | 6.71e-01 | 0.1177 |
| 2319 | FLOT2 | P4T-E | Human | Esophagus | ESCC | 9.62e-14 | 4.13e-01 | 0.1323 |
| 2319 | FLOT2 | P5T-E | Human | Esophagus | ESCC | 2.02e-09 | 1.48e-01 | 0.1327 |
| 2319 | FLOT2 | P8T-E | Human | Esophagus | ESCC | 4.62e-24 | 4.50e-01 | 0.0889 |
| 2319 | FLOT2 | P9T-E | Human | Esophagus | ESCC | 4.66e-21 | 5.14e-01 | 0.1131 |
| 2319 | FLOT2 | P10T-E | Human | Esophagus | ESCC | 3.18e-31 | 5.80e-01 | 0.116 |
| 2319 | FLOT2 | P11T-E | Human | Esophagus | ESCC | 2.42e-08 | 7.09e-01 | 0.1426 |
| 2319 | FLOT2 | P12T-E | Human | Esophagus | ESCC | 1.39e-20 | 4.04e-01 | 0.1122 |
| 2319 | FLOT2 | P15T-E | Human | Esophagus | ESCC | 1.23e-35 | 9.53e-01 | 0.1149 |
| 2319 | FLOT2 | P16T-E | Human | Esophagus | ESCC | 1.65e-24 | 5.28e-01 | 0.1153 |
| 2319 | FLOT2 | P17T-E | Human | Esophagus | ESCC | 1.58e-18 | 9.61e-01 | 0.1278 |
| Page: 1 2 3 4 5 6 |
| Tissue | Expression Dynamics | Abbreviation |
| Esophagus | 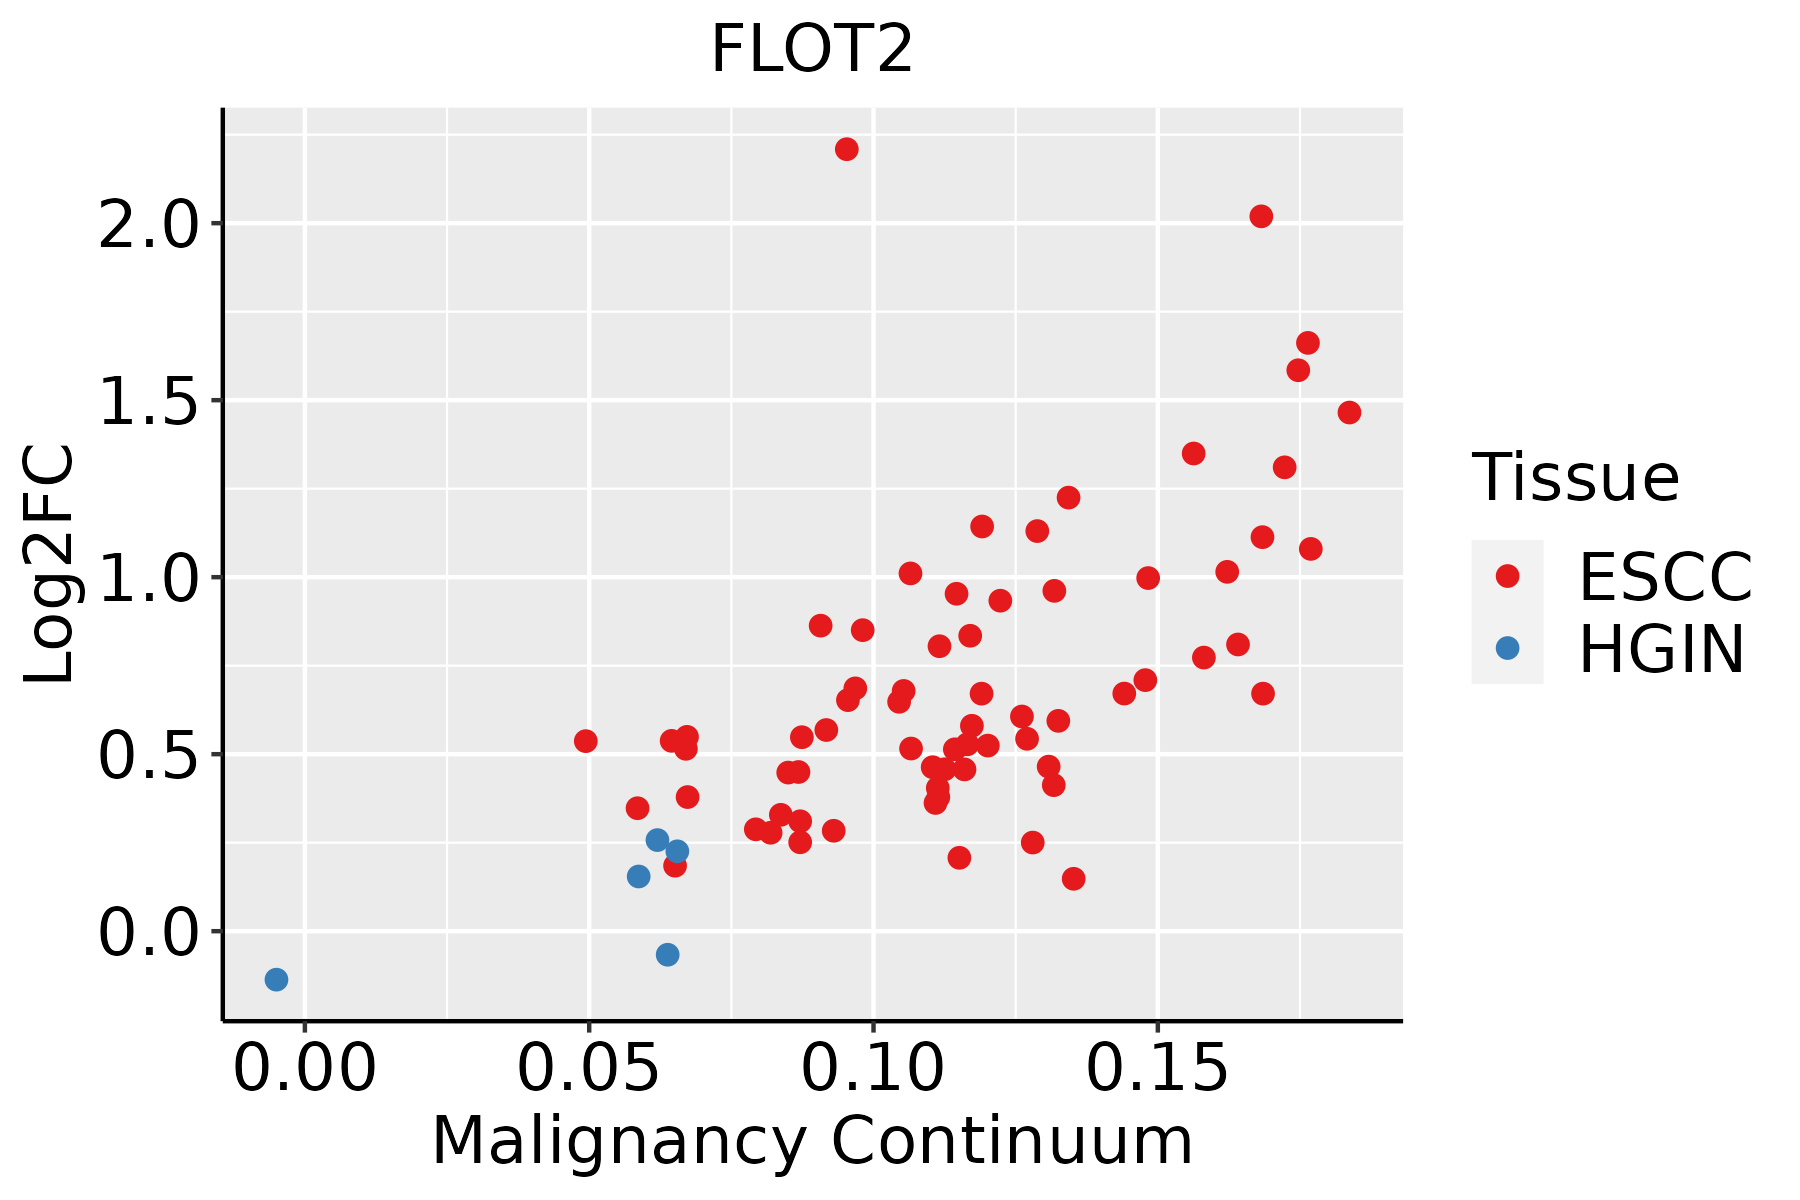 | ESCC: Esophageal squamous cell carcinoma |
| HGIN: High-grade intraepithelial neoplasias | ||
| LGIN: Low-grade intraepithelial neoplasias | ||
| Liver | 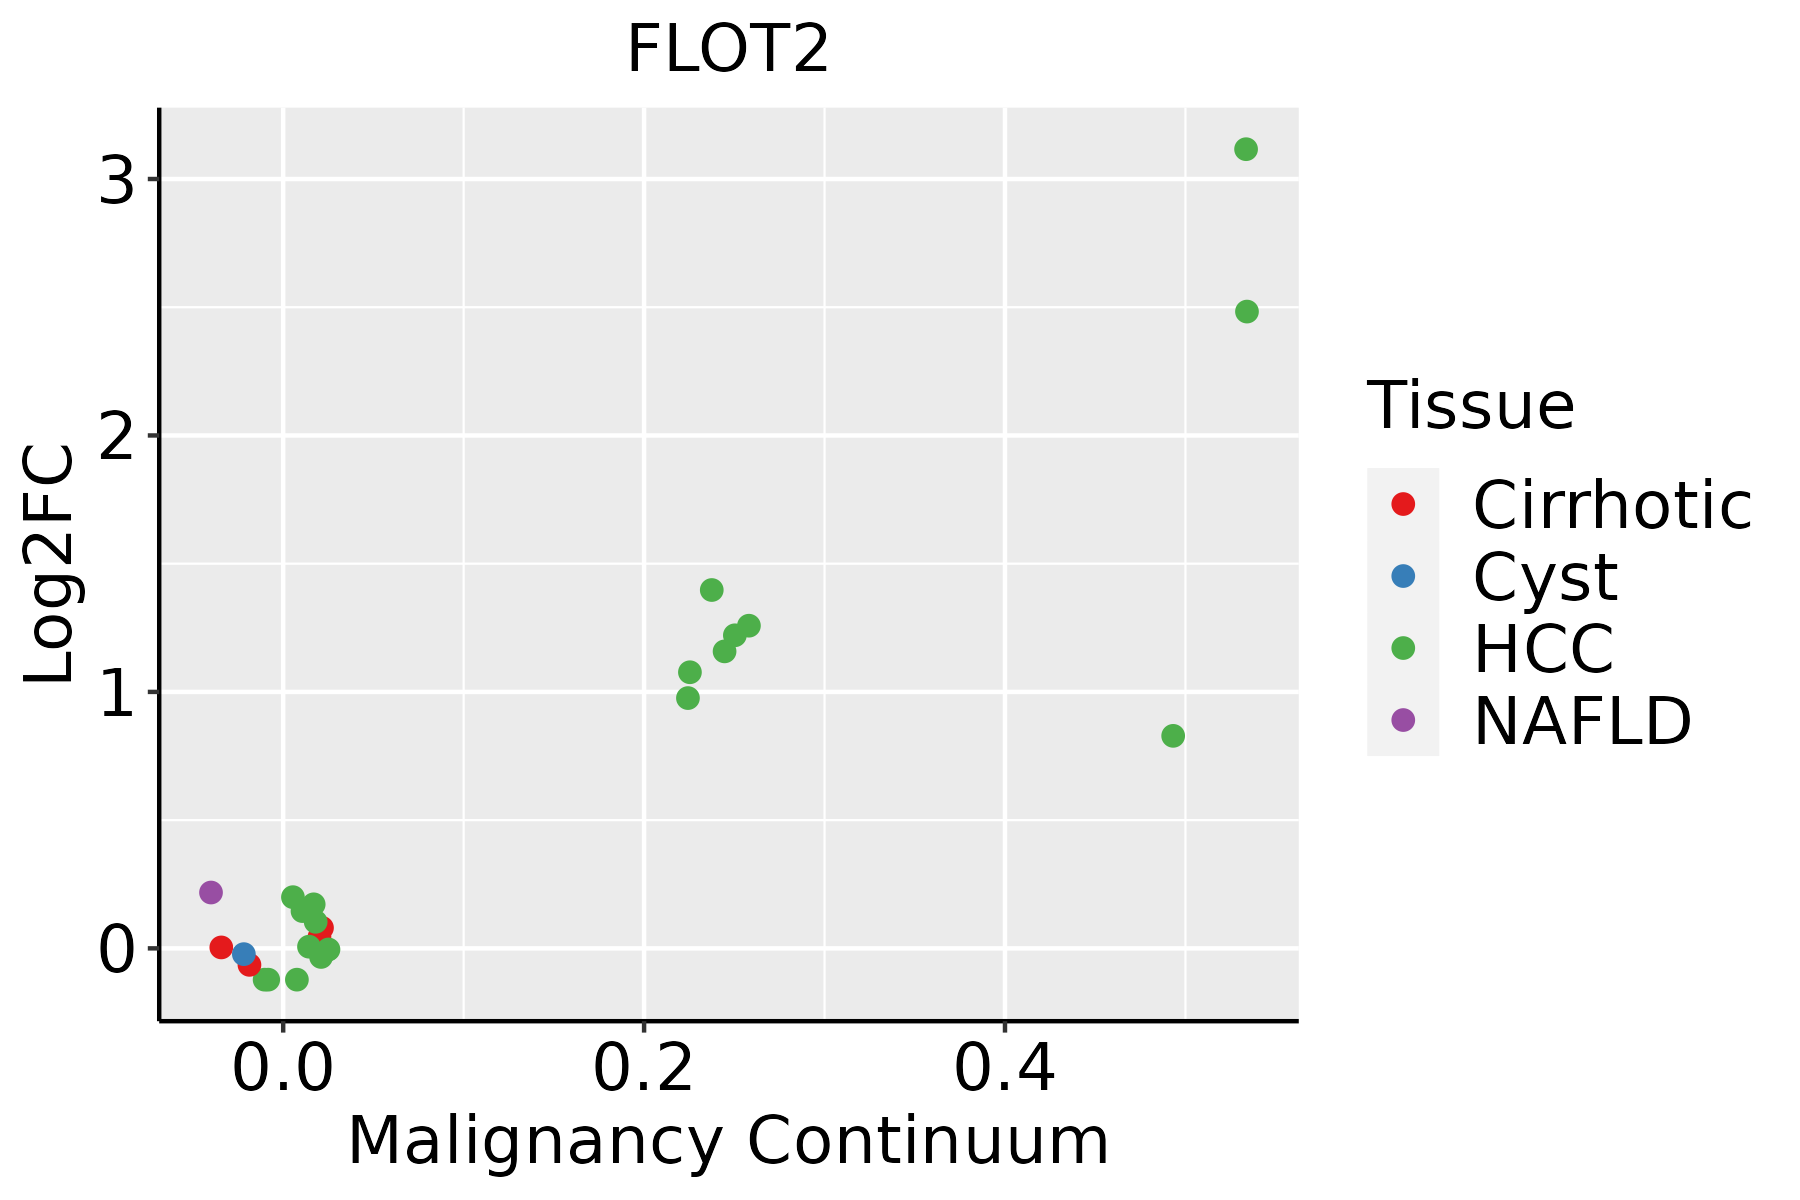 | HCC: Hepatocellular carcinoma |
| NAFLD: Non-alcoholic fatty liver disease | ||
| Oral Cavity | 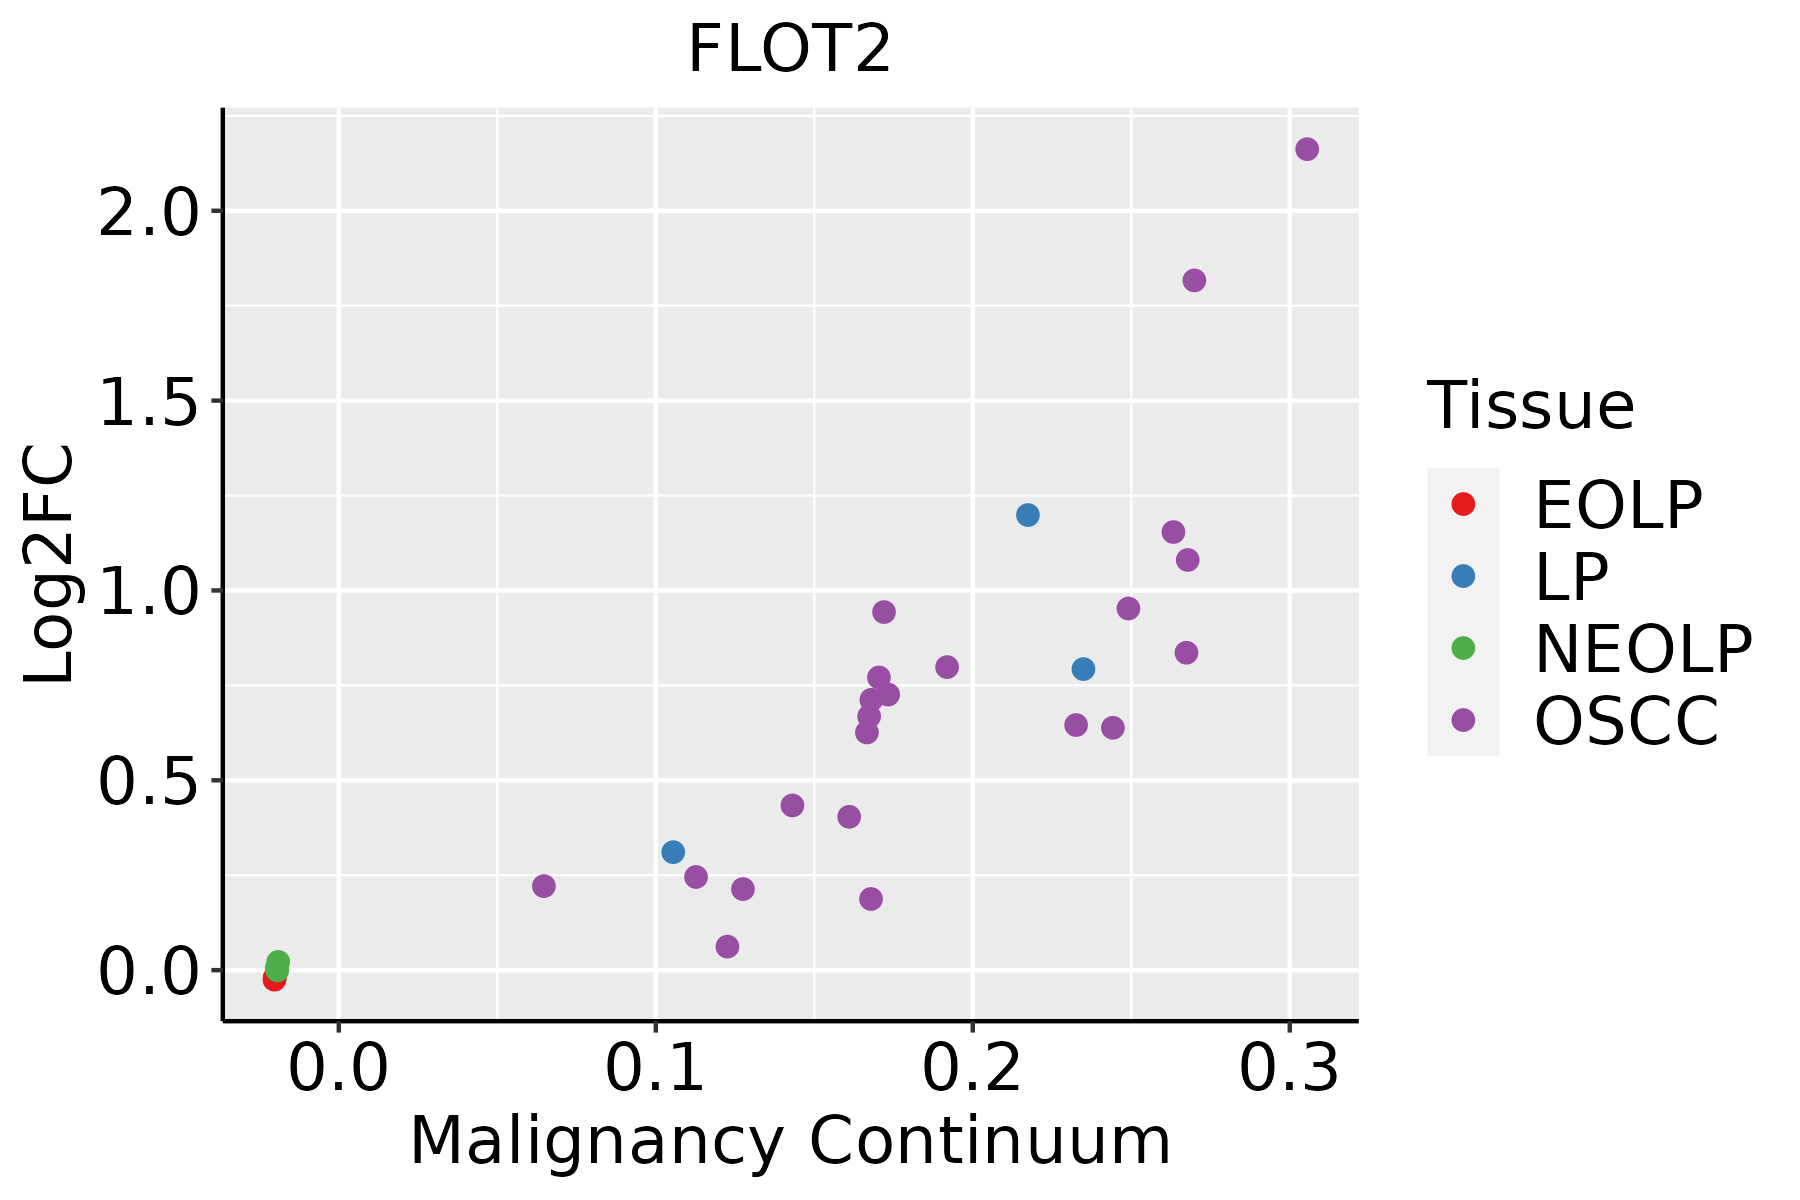 | EOLP: Erosive Oral lichen planus |
| LP: leukoplakia | ||
| NEOLP: Non-erosive oral lichen planus | ||
| OSCC: Oral squamous cell carcinoma | ||
| Prostate | 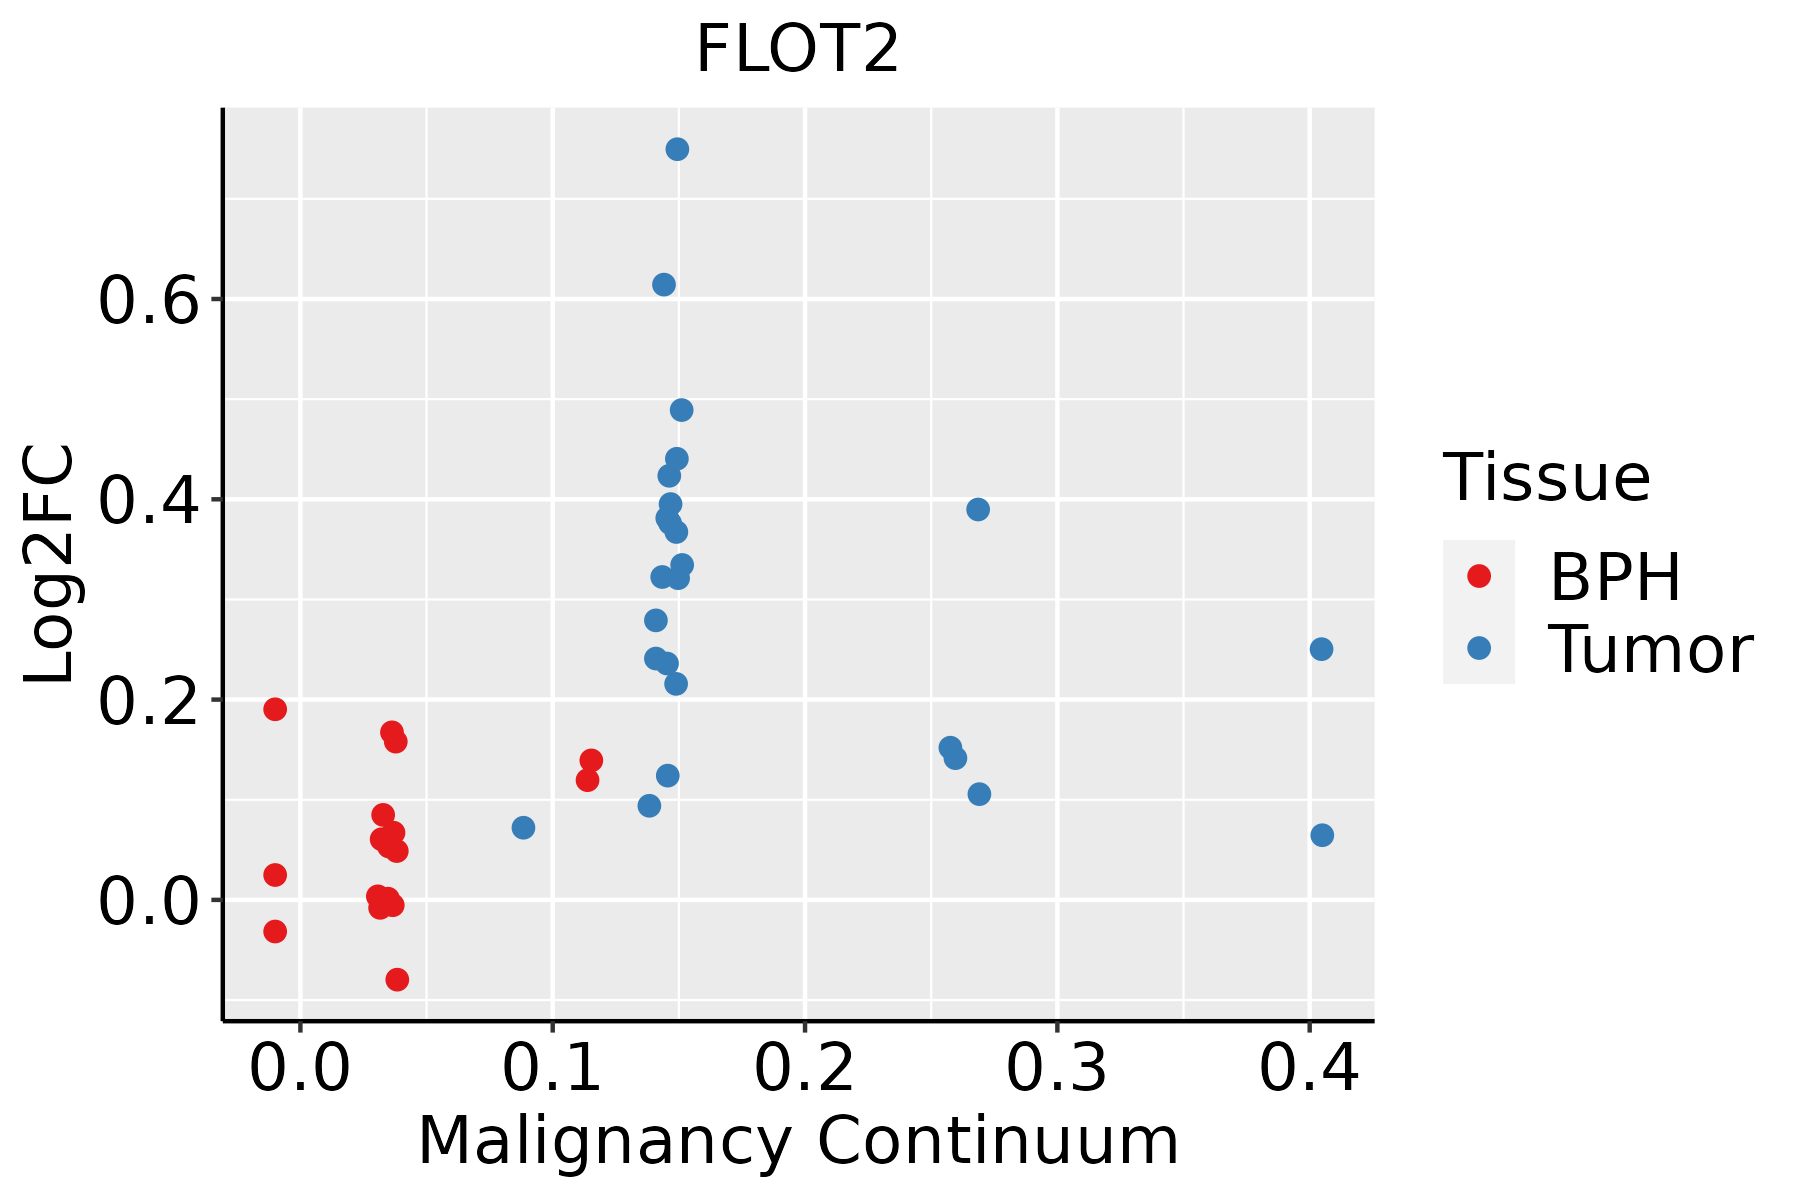 | BPH: Benign Prostatic Hyperplasia |
| Skin |  | AK: Actinic keratosis |
| cSCC: Cutaneous squamous cell carcinoma | ||
| SCCIS:squamous cell carcinoma in situ |
| ∗log2FC in expression of this searched gene in stem-like cells from each diseased tissue sample relative to stem-like cells in normal samples in each tissue plotted against the malignancy continuum. Samples are colored based on if they are from different disease stage. |
Top |
Malignant transformation related pathway analysis |
| Find out the enriched GO biological processes and KEGG pathways involved in transition from healthy to precancer to cancer |
| Tissue | Disease Stage | Enriched GO biological Processes |
| Colorectum | AD |  |
| Colorectum | SER |  |
| Colorectum | MSS |  |
| Colorectum | MSI-H |  |
| Colorectum | FAP |  |
| ∗Top 15 enriched GO BP terms are showed in the bar plot of each disease state in each tissue. Each row represents a significant GO biological process which is colored according to the -log10(p.adjust). |
| Page: 1 2 3 4 5 6 7 8 9 |
| GO ID | Tissue | Disease Stage | Description | Gene Ratio | Bg Ratio | pvalue | p.adjust | Count |
| GO:0031647111 | Esophagus | ESCC | regulation of protein stability | 223/8552 | 298/18723 | 5.76e-25 | 1.52e-22 | 223 |
| GO:0050821111 | Esophagus | ESCC | protein stabilization | 140/8552 | 191/18723 | 6.50e-15 | 3.61e-13 | 140 |
| GO:0072659110 | Esophagus | ESCC | protein localization to plasma membrane | 193/8552 | 284/18723 | 1.95e-14 | 1.03e-12 | 193 |
| GO:199077819 | Esophagus | ESCC | protein localization to cell periphery | 217/8552 | 333/18723 | 4.08e-13 | 1.88e-11 | 217 |
| GO:003070518 | Esophagus | ESCC | cytoskeleton-dependent intracellular transport | 133/8552 | 195/18723 | 1.48e-10 | 4.27e-09 | 133 |
| GO:000716320 | Esophagus | ESCC | establishment or maintenance of cell polarity | 143/8552 | 218/18723 | 2.05e-09 | 4.65e-08 | 143 |
| GO:001097013 | Esophagus | ESCC | transport along microtubule | 107/8552 | 155/18723 | 3.17e-09 | 6.80e-08 | 107 |
| GO:000808810 | Esophagus | ESCC | axo-dendritic transport | 58/8552 | 75/18723 | 2.09e-08 | 4.02e-07 | 58 |
| GO:004578527 | Esophagus | ESCC | positive regulation of cell adhesion | 255/8552 | 437/18723 | 5.07e-08 | 9.11e-07 | 255 |
| GO:003001018 | Esophagus | ESCC | establishment of cell polarity | 96/8552 | 143/18723 | 1.69e-07 | 2.67e-06 | 96 |
| GO:000854410 | Esophagus | ESCC | epidermis development | 193/8552 | 324/18723 | 2.87e-07 | 4.19e-06 | 193 |
| GO:00510908 | Esophagus | ESCC | regulation of DNA-binding transcription factor activity | 252/8552 | 440/18723 | 5.22e-07 | 6.97e-06 | 252 |
| GO:00510918 | Esophagus | ESCC | positive regulation of DNA-binding transcription factor activity | 155/8552 | 260/18723 | 3.83e-06 | 4.14e-05 | 155 |
| GO:00991114 | Esophagus | ESCC | microtubule-based transport | 115/8552 | 190/18723 | 2.54e-05 | 2.15e-04 | 115 |
| GO:00510926 | Esophagus | ESCC | positive regulation of NF-kappaB transcription factor activity | 91/8552 | 152/18723 | 2.91e-04 | 1.75e-03 | 91 |
| GO:00440918 | Esophagus | ESCC | membrane biogenesis | 38/8552 | 55/18723 | 3.78e-04 | 2.19e-03 | 38 |
| GO:00717099 | Esophagus | ESCC | membrane assembly | 35/8552 | 50/18723 | 4.33e-04 | 2.44e-03 | 35 |
| GO:002240720 | Esophagus | ESCC | regulation of cell-cell adhesion | 239/8552 | 448/18723 | 5.88e-04 | 3.19e-03 | 239 |
| GO:004211018 | Esophagus | ESCC | T cell activation | 256/8552 | 487/18723 | 1.18e-03 | 5.87e-03 | 256 |
| GO:002240919 | Esophagus | ESCC | positive regulation of cell-cell adhesion | 155/8552 | 284/18723 | 1.50e-03 | 7.06e-03 | 155 |
| Page: 1 2 3 4 5 6 7 8 |
| Pathway ID | Tissue | Disease Stage | Description | Gene Ratio | Bg Ratio | pvalue | p.adjust | qvalue | Count |
| hsa049109 | Esophagus | ESCC | Insulin signaling pathway | 89/4205 | 137/8465 | 1.97e-04 | 7.32e-04 | 3.75e-04 | 89 |
| hsa0491014 | Esophagus | ESCC | Insulin signaling pathway | 89/4205 | 137/8465 | 1.97e-04 | 7.32e-04 | 3.75e-04 | 89 |
| hsa0491021 | Liver | Cirrhotic | Insulin signaling pathway | 56/2530 | 137/8465 | 3.74e-03 | 1.50e-02 | 9.26e-03 | 56 |
| hsa0491031 | Liver | Cirrhotic | Insulin signaling pathway | 56/2530 | 137/8465 | 3.74e-03 | 1.50e-02 | 9.26e-03 | 56 |
| hsa0491041 | Liver | HCC | Insulin signaling pathway | 95/4020 | 137/8465 | 1.53e-07 | 1.97e-06 | 1.10e-06 | 95 |
| hsa0491051 | Liver | HCC | Insulin signaling pathway | 95/4020 | 137/8465 | 1.53e-07 | 1.97e-06 | 1.10e-06 | 95 |
| hsa049108 | Oral cavity | OSCC | Insulin signaling pathway | 83/3704 | 137/8465 | 4.83e-05 | 2.00e-04 | 1.02e-04 | 83 |
| hsa0491013 | Oral cavity | OSCC | Insulin signaling pathway | 83/3704 | 137/8465 | 4.83e-05 | 2.00e-04 | 1.02e-04 | 83 |
| hsa0491022 | Prostate | Tumor | Insulin signaling pathway | 44/1791 | 137/8465 | 1.69e-03 | 7.10e-03 | 4.40e-03 | 44 |
| hsa0491032 | Prostate | Tumor | Insulin signaling pathway | 44/1791 | 137/8465 | 1.69e-03 | 7.10e-03 | 4.40e-03 | 44 |
| Page: 1 |
Top |
Cell-cell communication analysis |
| Identification of potential cell-cell interactions between two cell types and their ligand-receptor pairs for different disease states |
| Ligand | Receptor | LRpair | Pathway | Tissue | Disease Stage |
| Page: 1 |
Top |
Single-cell gene regulatory network inference analysis |
| Find out the significant the regulons (TFs) and the target genes of each regulon across cell types for different disease states |
| TF | Cell Type | Tissue | Disease Stage | Target Gene | RSS | Regulon Activity |
| ∗The dot plots of a searched regulon are shown for all cell subpopulations in each disease state of each tissue based on the regulon specific score inferred using pySCENIC and by calculating the average expression. |
| Page: 1 |
Top |
Somatic mutation of malignant transformation related genes |
| Annotation of somatic variants for genes involved in malignant transformation |
| Hugo Symbol | Variant Class | Variant Classification | dbSNP RS | HGVSc | HGVSp | HGVSp Short | SWISSPROT | BIOTYPE | SIFT | PolyPhen | Tumor Sample Barcode | Tissue | Histology | Sex | Age | Stage | Therapy Types | Drugs | Outcome |
| FLOT2 | SNV | Missense_Mutation | rs751666905 | c.1009N>A | p.Glu337Lys | p.E337K | Q14254 | protein_coding | deleterious(0) | possibly_damaging(0.87) | TCGA-A2-A25A-01 | Breast | breast invasive carcinoma | Female | <65 | I/II | Unspecific | Cytoxan | SD |
| FLOT2 | SNV | Missense_Mutation | c.151N>G | p.Thr51Ala | p.T51A | Q14254 | protein_coding | deleterious(0) | probably_damaging(0.992) | TCGA-A8-A09Z-01 | Breast | breast invasive carcinoma | Female | >=65 | I/II | Unknown | Unknown | SD | |
| FLOT2 | SNV | Missense_Mutation | rs376080270 | c.82N>A | p.Val28Met | p.V28M | Q14254 | protein_coding | deleterious(0.02) | benign(0.378) | TCGA-D8-A1Y1-01 | Breast | breast invasive carcinoma | Female | >=65 | III/IV | Hormone Therapy | tamoxiphen | PD |
| FLOT2 | SNV | Missense_Mutation | rs374807903 | c.163N>T | p.Arg55Cys | p.R55C | Q14254 | protein_coding | deleterious(0.02) | possibly_damaging(0.835) | TCGA-2W-A8YY-01 | Cervix | cervical & endocervical cancer | Female | <65 | I/II | Chemotherapy | cisplatin | CR |
| FLOT2 | SNV | Missense_Mutation | c.706N>A | p.Glu236Lys | p.E236K | Q14254 | protein_coding | deleterious(0.05) | possibly_damaging(0.627) | TCGA-EK-A2RN-01 | Cervix | cervical & endocervical cancer | Female | <65 | I/II | Unknown | Unknown | SD | |
| FLOT2 | SNV | Missense_Mutation | c.142G>C | p.Glu48Gln | p.E48Q | Q14254 | protein_coding | deleterious(0.02) | probably_damaging(0.91) | TCGA-EK-A3GK-01 | Cervix | cervical & endocervical cancer | Female | <65 | I/II | Unknown | Unknown | SD | |
| FLOT2 | SNV | Missense_Mutation | c.902N>T | p.Ala301Val | p.A301V | Q14254 | protein_coding | deleterious(0) | probably_damaging(0.96) | TCGA-AD-5900-01 | Colorectum | colon adenocarcinoma | Male | >=65 | I/II | Unknown | Unknown | SD | |
| FLOT2 | SNV | Missense_Mutation | rs376080270 | c.82N>A | p.Val28Met | p.V28M | Q14254 | protein_coding | deleterious(0.02) | benign(0.378) | TCGA-AZ-4615-01 | Colorectum | colon adenocarcinoma | Male | >=65 | III/IV | Chemotherapy | xeloda | PD |
| FLOT2 | SNV | Missense_Mutation | c.945G>T | p.Glu315Asp | p.E315D | Q14254 | protein_coding | tolerated(0.11) | benign(0.011) | TCGA-D5-6930-01 | Colorectum | colon adenocarcinoma | Male | >=65 | I/II | Unknown | Unknown | SD | |
| FLOT2 | SNV | Missense_Mutation | c.1251N>G | p.Ile417Met | p.I417M | Q14254 | protein_coding | tolerated(0.06) | benign(0.005) | TCGA-G4-6586-01 | Colorectum | colon adenocarcinoma | Female | >=65 | I/II | Unknown | Unknown | SD |
| Page: 1 2 3 4 5 |
Top |
Related drugs of malignant transformation related genes |
| Identification of chemicals and drugs interact with genes involved in malignant transfromation |
| (DGIdb 4.0) |
| Entrez ID | Symbol | Category | Interaction Types | Drug Claim Name | Drug Name | PMIDs |
| Page: 1 |

Copyright 2023-Present -The University of Texas Health Science Center at Houston |