
|
|||||
|
 | |
| |
| |
| |
| |
| |
|
Gene: FLAD1 |
Gene summary for FLAD1 |
| Gene information | Species | Human | Gene symbol | FLAD1 | Gene ID | 80308 |
| Gene name | flavin adenine dinucleotide synthetase 1 | |
| Gene Alias | FAD1 | |
| Cytomap | 1q21.3 | |
| Gene Type | protein-coding | GO ID | GO:0006139 | UniProtAcc | Q8NFF5 |
Top |
Malignant transformation analysis |
| Identification of the aberrant gene expression in precancerous and cancerous lesions by comparing the gene expression of stem-like cells in diseased tissues with normal stem cells |
| Entrez ID | Symbol | Replicates | Species | Organ | Tissue | Adj P-value | Log2FC | Malignancy |
| 80308 | FLAD1 | LZE2T | Human | Esophagus | ESCC | 2.92e-02 | 6.84e-01 | 0.082 |
| 80308 | FLAD1 | LZE4T | Human | Esophagus | ESCC | 6.23e-11 | 4.21e-01 | 0.0811 |
| 80308 | FLAD1 | LZE7T | Human | Esophagus | ESCC | 1.62e-20 | 9.05e-01 | 0.0667 |
| 80308 | FLAD1 | LZE8T | Human | Esophagus | ESCC | 1.23e-05 | 2.44e-01 | 0.067 |
| 80308 | FLAD1 | LZE22T | Human | Esophagus | ESCC | 3.81e-09 | 7.05e-01 | 0.068 |
| 80308 | FLAD1 | LZE24T | Human | Esophagus | ESCC | 1.17e-24 | 6.46e-01 | 0.0596 |
| 80308 | FLAD1 | LZE21T | Human | Esophagus | ESCC | 2.52e-03 | 5.14e-01 | 0.0655 |
| 80308 | FLAD1 | LZE6T | Human | Esophagus | ESCC | 9.42e-09 | 5.14e-01 | 0.0845 |
| 80308 | FLAD1 | P1T-E | Human | Esophagus | ESCC | 8.23e-15 | 6.31e-01 | 0.0875 |
| 80308 | FLAD1 | P2T-E | Human | Esophagus | ESCC | 9.45e-43 | 6.04e-01 | 0.1177 |
| 80308 | FLAD1 | P4T-E | Human | Esophagus | ESCC | 1.69e-31 | 7.72e-01 | 0.1323 |
| 80308 | FLAD1 | P5T-E | Human | Esophagus | ESCC | 3.34e-43 | 8.96e-01 | 0.1327 |
| 80308 | FLAD1 | P8T-E | Human | Esophagus | ESCC | 5.82e-23 | 3.39e-01 | 0.0889 |
| 80308 | FLAD1 | P9T-E | Human | Esophagus | ESCC | 7.66e-23 | 6.77e-01 | 0.1131 |
| 80308 | FLAD1 | P10T-E | Human | Esophagus | ESCC | 3.86e-43 | 7.20e-01 | 0.116 |
| 80308 | FLAD1 | P11T-E | Human | Esophagus | ESCC | 3.50e-09 | 3.88e-01 | 0.1426 |
| 80308 | FLAD1 | P12T-E | Human | Esophagus | ESCC | 9.33e-24 | 3.92e-01 | 0.1122 |
| 80308 | FLAD1 | P15T-E | Human | Esophagus | ESCC | 4.63e-34 | 7.92e-01 | 0.1149 |
| 80308 | FLAD1 | P16T-E | Human | Esophagus | ESCC | 5.10e-15 | 3.53e-01 | 0.1153 |
| 80308 | FLAD1 | P17T-E | Human | Esophagus | ESCC | 1.67e-13 | 5.45e-01 | 0.1278 |
| Page: 1 2 3 4 5 6 |
| Tissue | Expression Dynamics | Abbreviation |
| Esophagus |  | ESCC: Esophageal squamous cell carcinoma |
| HGIN: High-grade intraepithelial neoplasias | ||
| LGIN: Low-grade intraepithelial neoplasias | ||
| Liver | 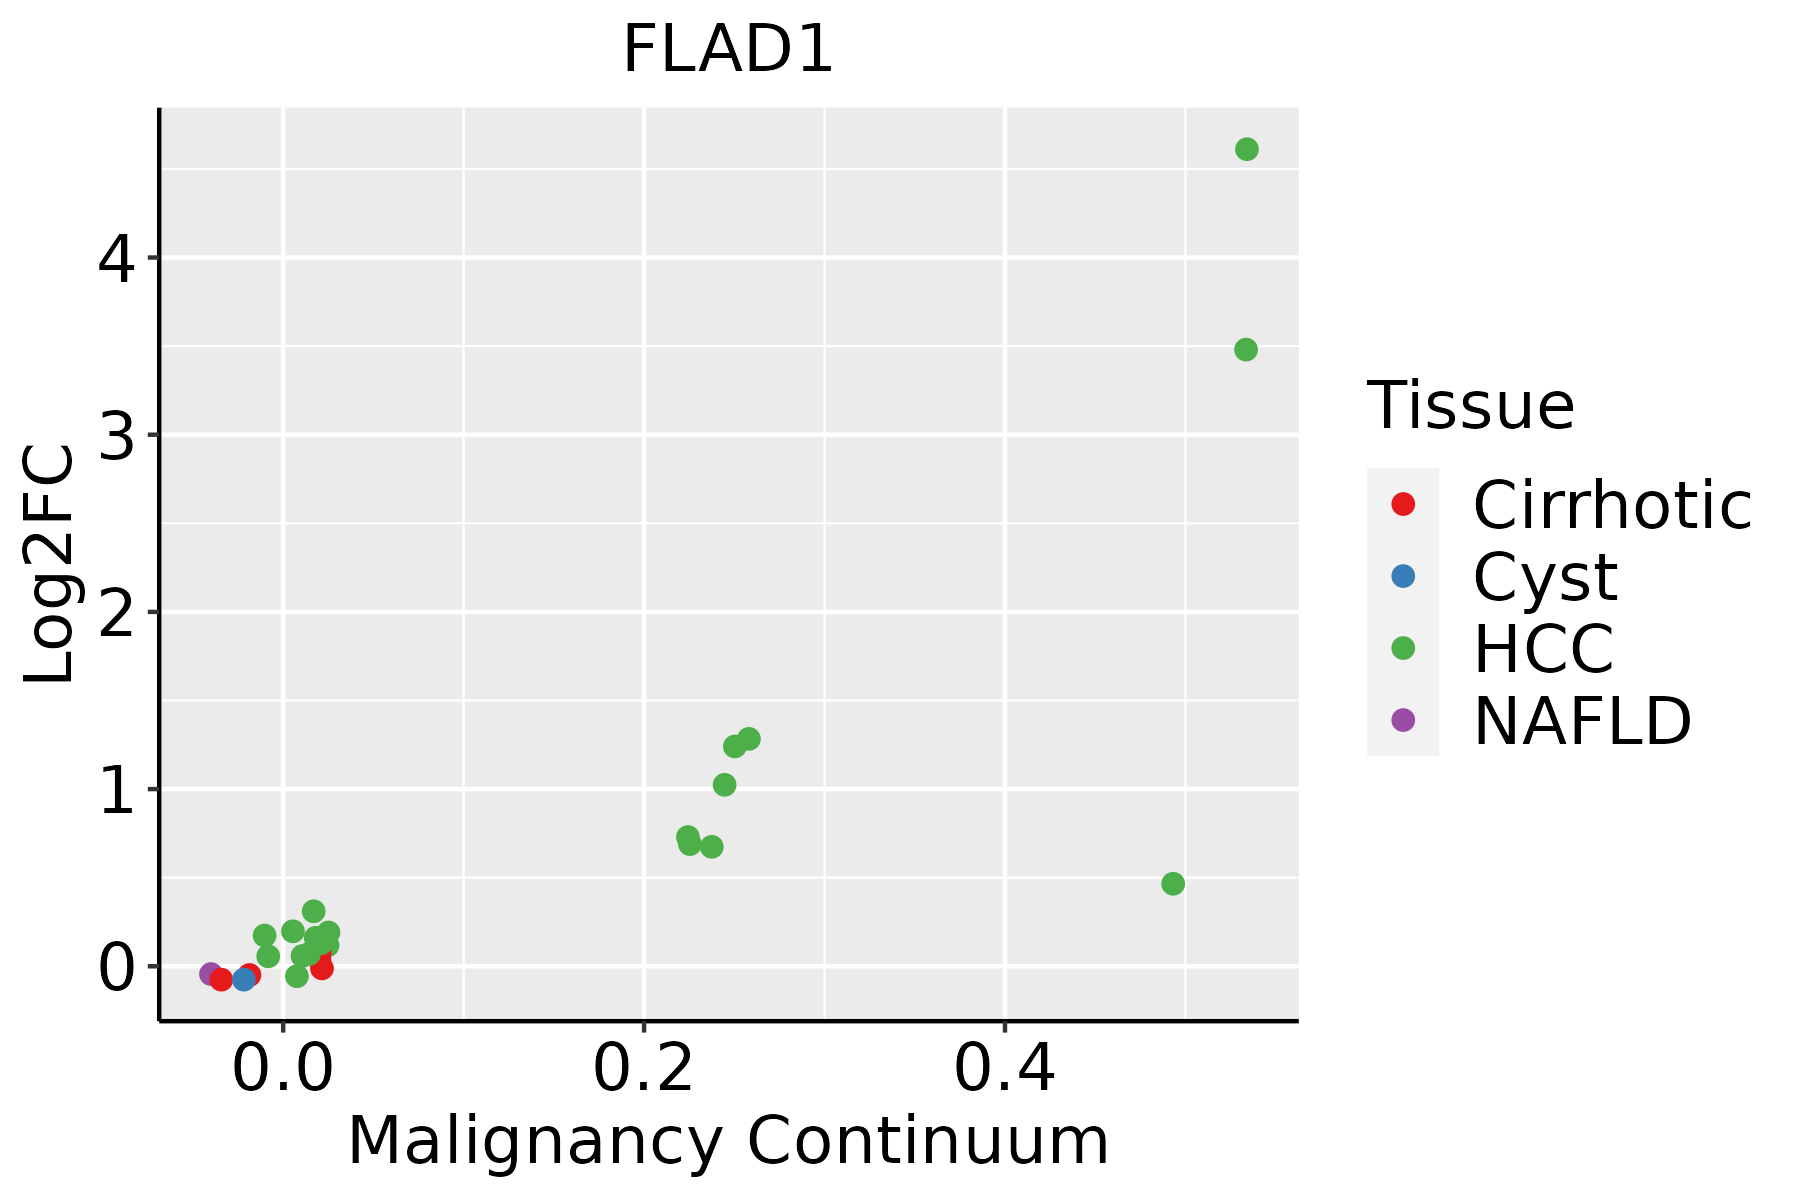 | HCC: Hepatocellular carcinoma |
| NAFLD: Non-alcoholic fatty liver disease | ||
| Oral Cavity | 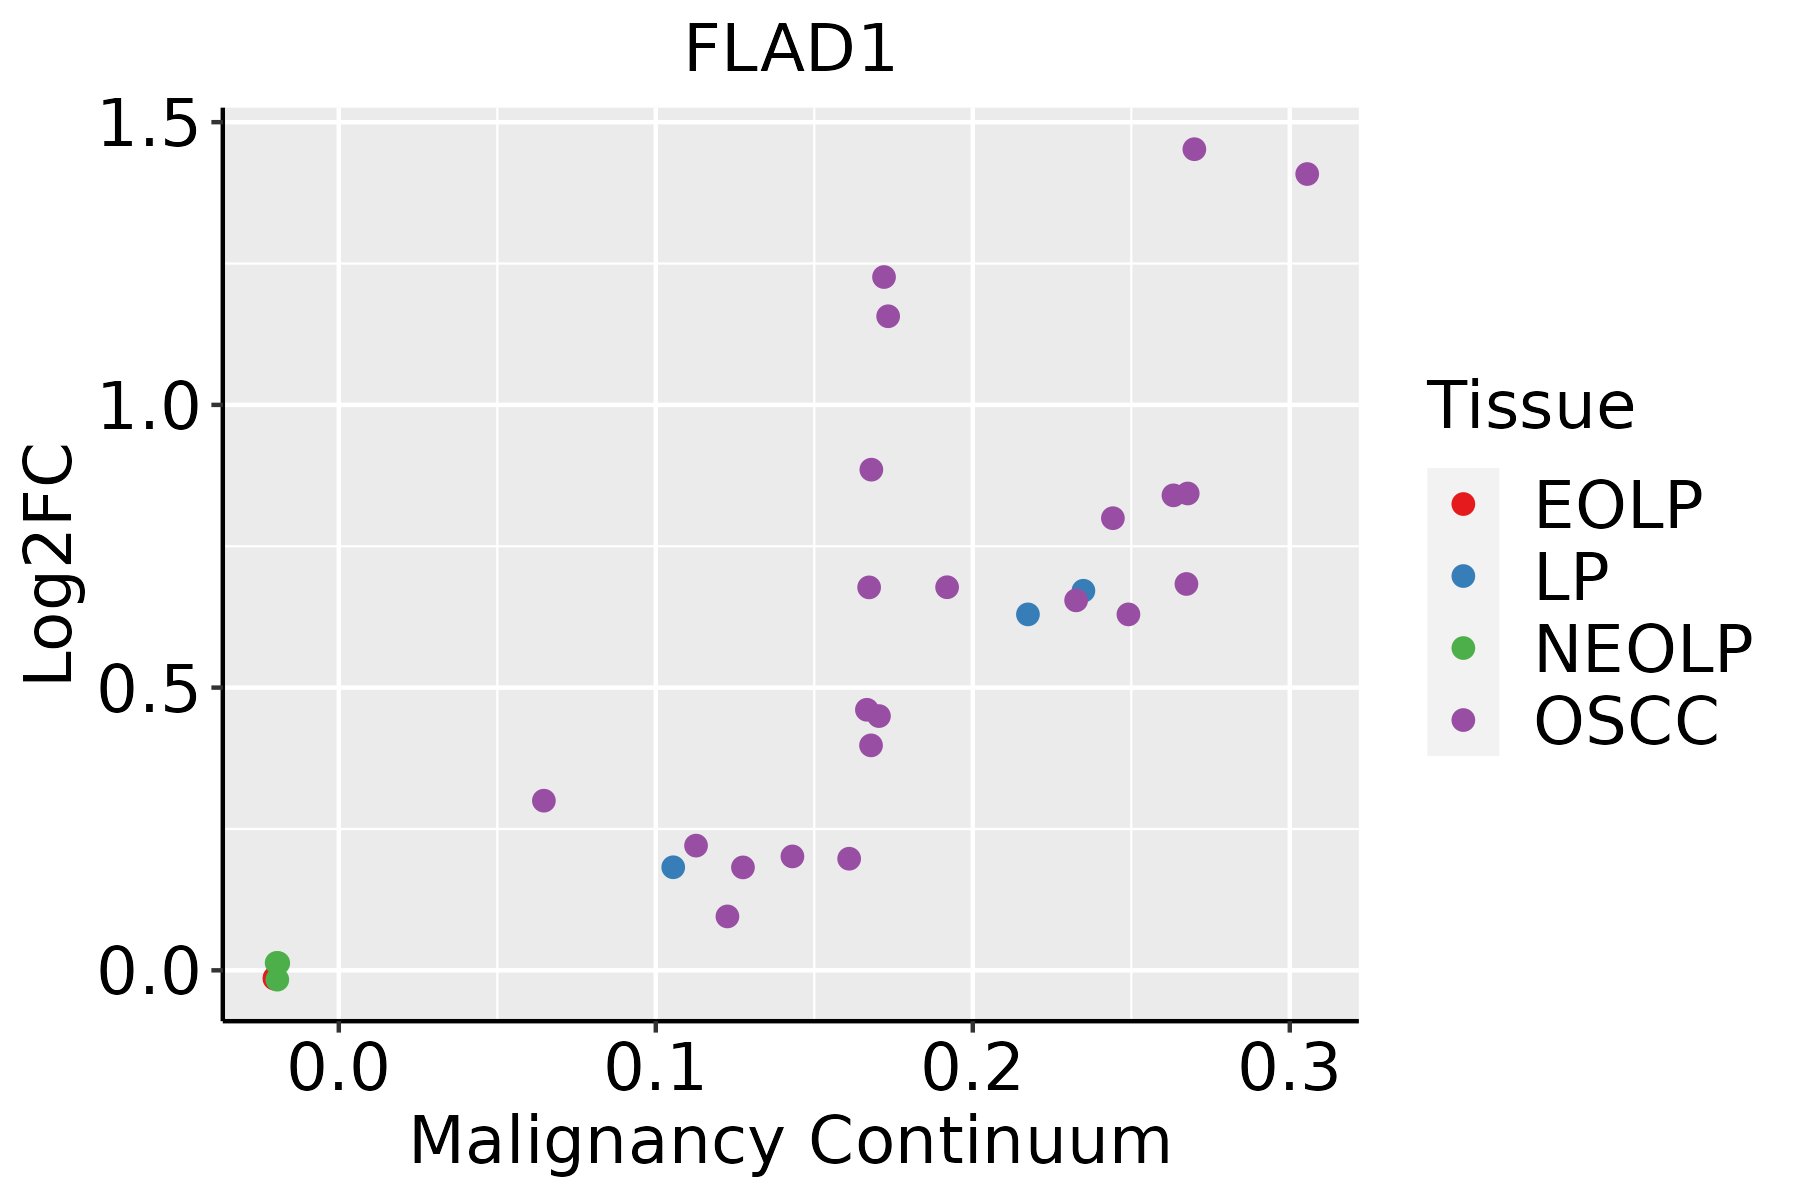 | EOLP: Erosive Oral lichen planus |
| LP: leukoplakia | ||
| NEOLP: Non-erosive oral lichen planus | ||
| OSCC: Oral squamous cell carcinoma | ||
| Skin | 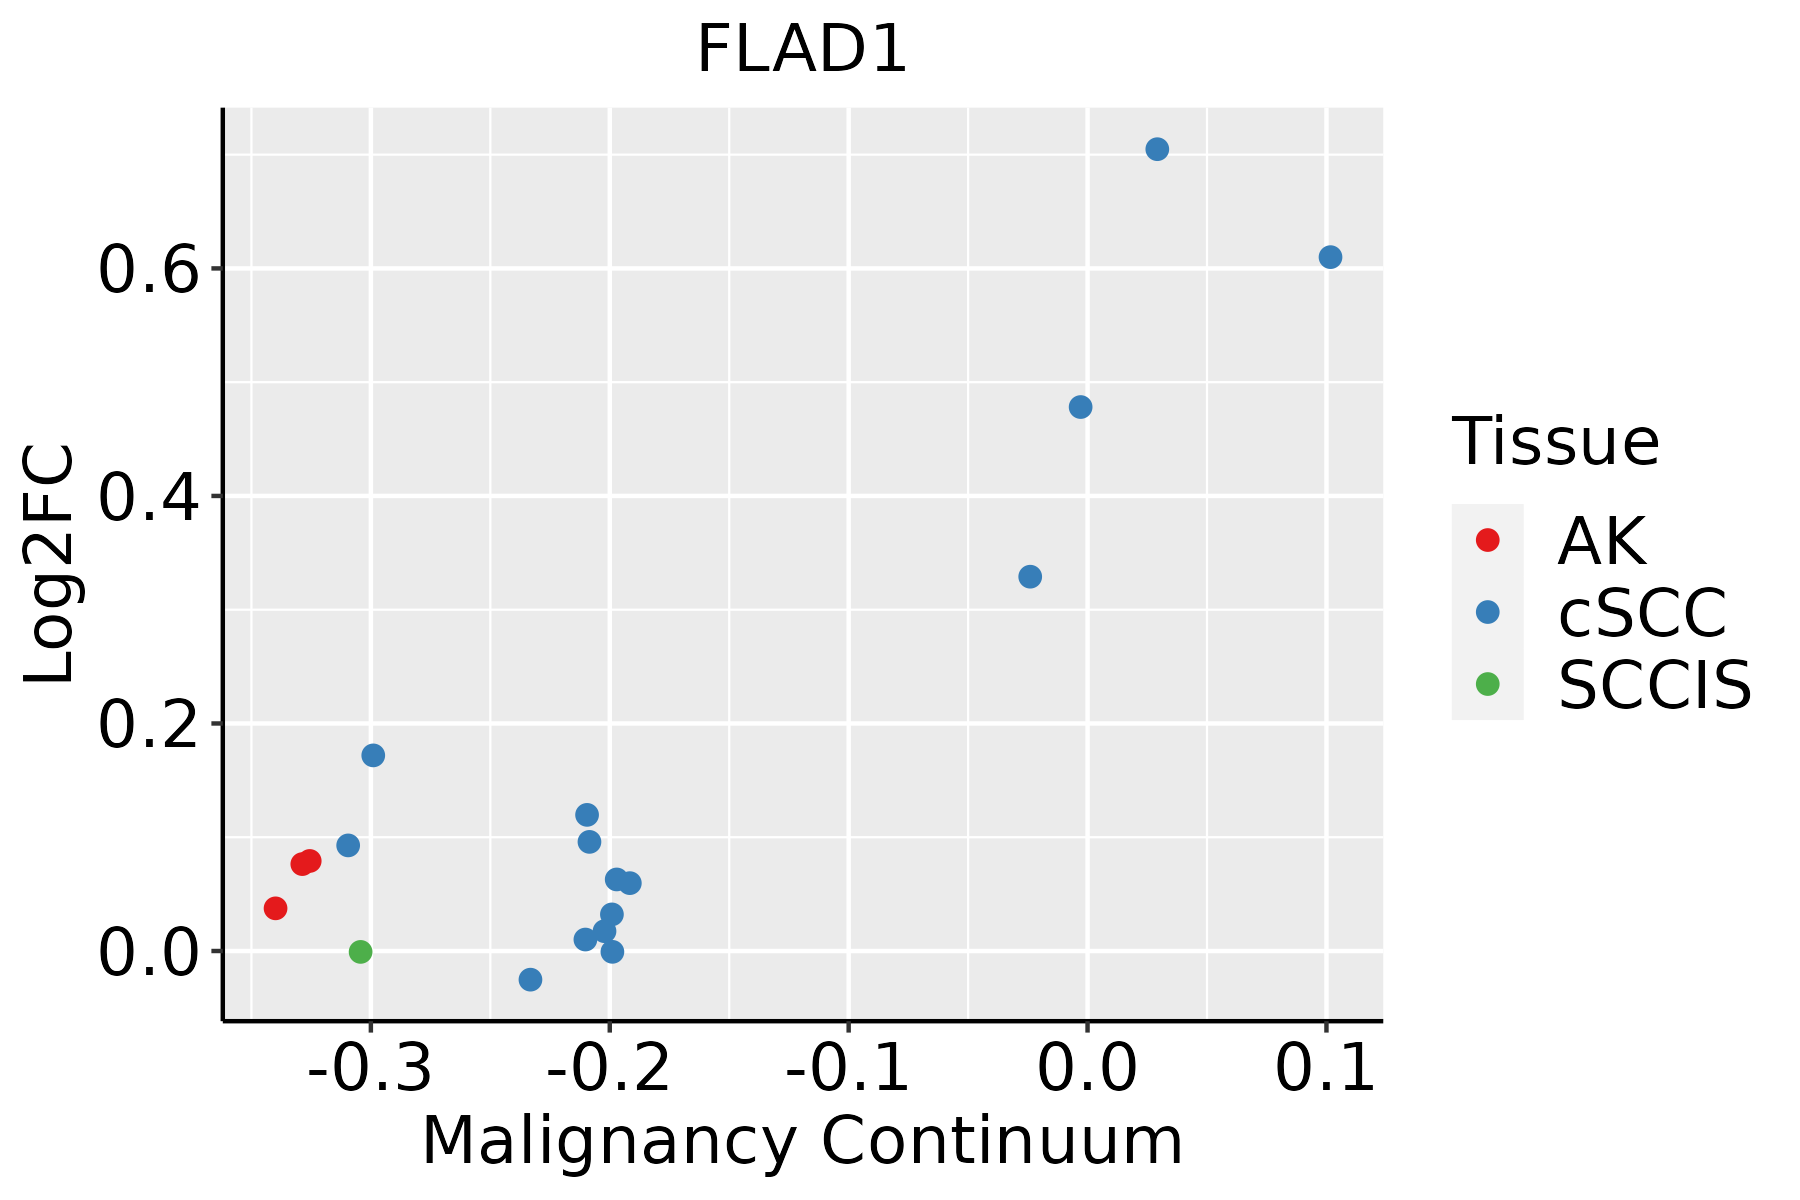 | AK: Actinic keratosis |
| cSCC: Cutaneous squamous cell carcinoma | ||
| SCCIS:squamous cell carcinoma in situ |
| ∗log2FC in expression of this searched gene in stem-like cells from each diseased tissue sample relative to stem-like cells in normal samples in each tissue plotted against the malignancy continuum. Samples are colored based on if they are from different disease stage. |
Top |
Malignant transformation related pathway analysis |
| Find out the enriched GO biological processes and KEGG pathways involved in transition from healthy to precancer to cancer |
| Tissue | Disease Stage | Enriched GO biological Processes |
| Colorectum | AD |  |
| Colorectum | SER |  |
| Colorectum | MSS |  |
| Colorectum | MSI-H |  |
| Colorectum | FAP |  |
| ∗Top 15 enriched GO BP terms are showed in the bar plot of each disease state in each tissue. Each row represents a significant GO biological process which is colored according to the -log10(p.adjust). |
| Page: 1 2 3 4 5 6 7 8 9 |
| GO ID | Tissue | Disease Stage | Description | Gene Ratio | Bg Ratio | pvalue | p.adjust | Count |
| GO:0006753110 | Esophagus | ESCC | nucleoside phosphate metabolic process | 288/8552 | 497/18723 | 1.80e-08 | 3.50e-07 | 288 |
| GO:0009117111 | Esophagus | ESCC | nucleotide metabolic process | 282/8552 | 489/18723 | 4.70e-08 | 8.50e-07 | 282 |
| GO:000916516 | Esophagus | ESCC | nucleotide biosynthetic process | 150/8552 | 254/18723 | 1.12e-05 | 1.06e-04 | 150 |
| GO:190129316 | Esophagus | ESCC | nucleoside phosphate biosynthetic process | 151/8552 | 256/18723 | 1.15e-05 | 1.08e-04 | 151 |
| GO:00067671 | Esophagus | ESCC | water-soluble vitamin metabolic process | 41/8552 | 59/18723 | 1.84e-04 | 1.17e-03 | 41 |
| GO:00067661 | Esophagus | ESCC | vitamin metabolic process | 67/8552 | 106/18723 | 2.03e-04 | 1.28e-03 | 67 |
| GO:000911722 | Liver | HCC | nucleotide metabolic process | 300/7958 | 489/18723 | 1.61e-17 | 1.71e-15 | 300 |
| GO:000675322 | Liver | HCC | nucleoside phosphate metabolic process | 304/7958 | 497/18723 | 1.78e-17 | 1.85e-15 | 304 |
| GO:000916512 | Liver | HCC | nucleotide biosynthetic process | 150/7958 | 254/18723 | 6.79e-08 | 1.40e-06 | 150 |
| GO:190129312 | Liver | HCC | nucleoside phosphate biosynthetic process | 151/7958 | 256/18723 | 6.84e-08 | 1.41e-06 | 151 |
| GO:0006767 | Liver | HCC | water-soluble vitamin metabolic process | 39/7958 | 59/18723 | 2.14e-04 | 1.63e-03 | 39 |
| GO:0006766 | Liver | HCC | vitamin metabolic process | 57/7958 | 106/18723 | 1.25e-02 | 4.53e-02 | 57 |
| GO:000675318 | Oral cavity | OSCC | nucleoside phosphate metabolic process | 247/7305 | 497/18723 | 6.28e-07 | 8.96e-06 | 247 |
| GO:000911719 | Oral cavity | OSCC | nucleotide metabolic process | 243/7305 | 489/18723 | 7.80e-07 | 1.09e-05 | 243 |
| GO:19012938 | Oral cavity | OSCC | nucleoside phosphate biosynthetic process | 125/7305 | 256/18723 | 8.32e-04 | 4.41e-03 | 125 |
| GO:00091658 | Oral cavity | OSCC | nucleotide biosynthetic process | 124/7305 | 254/18723 | 8.79e-04 | 4.63e-03 | 124 |
| GO:000675319 | Oral cavity | LP | nucleoside phosphate metabolic process | 161/4623 | 497/18723 | 5.31e-05 | 7.39e-04 | 161 |
| GO:0009117110 | Oral cavity | LP | nucleotide metabolic process | 158/4623 | 489/18723 | 7.17e-05 | 9.49e-04 | 158 |
| GO:190129315 | Oral cavity | LP | nucleoside phosphate biosynthetic process | 84/4623 | 256/18723 | 1.98e-03 | 1.47e-02 | 84 |
| GO:000916515 | Oral cavity | LP | nucleotide biosynthetic process | 83/4623 | 254/18723 | 2.38e-03 | 1.71e-02 | 83 |
| Page: 1 2 |
| Pathway ID | Tissue | Disease Stage | Description | Gene Ratio | Bg Ratio | pvalue | p.adjust | qvalue | Count |
| hsa012405 | Esophagus | ESCC | Biosynthesis of cofactors | 97/4205 | 153/8465 | 3.88e-04 | 1.35e-03 | 6.94e-04 | 97 |
| hsa0124012 | Esophagus | ESCC | Biosynthesis of cofactors | 97/4205 | 153/8465 | 3.88e-04 | 1.35e-03 | 6.94e-04 | 97 |
| hsa012402 | Liver | HCC | Biosynthesis of cofactors | 103/4020 | 153/8465 | 4.67e-07 | 5.05e-06 | 2.81e-06 | 103 |
| hsa012403 | Liver | HCC | Biosynthesis of cofactors | 103/4020 | 153/8465 | 4.67e-07 | 5.05e-06 | 2.81e-06 | 103 |
| hsa012404 | Oral cavity | OSCC | Biosynthesis of cofactors | 88/3704 | 153/8465 | 3.84e-04 | 1.20e-03 | 6.12e-04 | 88 |
| hsa0124011 | Oral cavity | OSCC | Biosynthesis of cofactors | 88/3704 | 153/8465 | 3.84e-04 | 1.20e-03 | 6.12e-04 | 88 |
| hsa0124021 | Oral cavity | LP | Biosynthesis of cofactors | 57/2418 | 153/8465 | 1.17e-02 | 3.91e-02 | 2.52e-02 | 57 |
| hsa0124031 | Oral cavity | LP | Biosynthesis of cofactors | 57/2418 | 153/8465 | 1.17e-02 | 3.91e-02 | 2.52e-02 | 57 |
| Page: 1 |
Top |
Cell-cell communication analysis |
| Identification of potential cell-cell interactions between two cell types and their ligand-receptor pairs for different disease states |
| Ligand | Receptor | LRpair | Pathway | Tissue | Disease Stage |
| Page: 1 |
Top |
Single-cell gene regulatory network inference analysis |
| Find out the significant the regulons (TFs) and the target genes of each regulon across cell types for different disease states |
| TF | Cell Type | Tissue | Disease Stage | Target Gene | RSS | Regulon Activity |
| ∗The dot plots of a searched regulon are shown for all cell subpopulations in each disease state of each tissue based on the regulon specific score inferred using pySCENIC and by calculating the average expression. |
| Page: 1 |
Top |
Somatic mutation of malignant transformation related genes |
| Annotation of somatic variants for genes involved in malignant transformation |
| Hugo Symbol | Variant Class | Variant Classification | dbSNP RS | HGVSc | HGVSp | HGVSp Short | SWISSPROT | BIOTYPE | SIFT | PolyPhen | Tumor Sample Barcode | Tissue | Histology | Sex | Age | Stage | Therapy Types | Drugs | Outcome |
| FLAD1 | SNV | Missense_Mutation | c.796N>C | p.Glu266Gln | p.E266Q | Q8NFF5 | protein_coding | tolerated(0.19) | benign(0.082) | TCGA-5L-AAT1-01 | Breast | breast invasive carcinoma | Female | <65 | III/IV | Hormone Therapy | letrozol | SD | |
| FLAD1 | SNV | Missense_Mutation | novel | c.463N>A | p.Glu155Lys | p.E155K | Q8NFF5 | protein_coding | tolerated(0.18) | possibly_damaging(0.739) | TCGA-A2-A4RX-01 | Breast | breast invasive carcinoma | Female | >=65 | I/II | Unknown | Unknown | SD |
| FLAD1 | SNV | Missense_Mutation | novel | c.83N>C | p.Arg28Thr | p.R28T | Q8NFF5 | protein_coding | benign(0) | TCGA-A2-A4S2-01 | Breast | breast invasive carcinoma | Female | <65 | III/IV | Chemotherapy | adriamycin | CR | |
| FLAD1 | SNV | Missense_Mutation | novel | c.1398C>A | p.Ser466Arg | p.S466R | Q8NFF5 | protein_coding | tolerated(0.55) | benign(0.038) | TCGA-AC-A3QP-01 | Breast | breast invasive carcinoma | Female | >=65 | I/II | Hormone Therapy | femara | SD |
| FLAD1 | SNV | Missense_Mutation | novel | c.1696G>C | p.Gly566Arg | p.G566R | Q8NFF5 | protein_coding | deleterious(0) | probably_damaging(0.994) | TCGA-AC-A3W6-01 | Breast | breast invasive carcinoma | Female | >=65 | III/IV | Unknown | Unknown | SD |
| FLAD1 | SNV | Missense_Mutation | rs771466122 | c.1588N>T | p.Arg530Cys | p.R530C | Q8NFF5 | protein_coding | deleterious(0) | probably_damaging(0.986) | TCGA-AN-A0AK-01 | Breast | breast invasive carcinoma | Female | >=65 | I/II | Unknown | Unknown | SD |
| FLAD1 | SNV | Missense_Mutation | rs554142608 | c.1034G>A | p.Arg345His | p.R345H | Q8NFF5 | protein_coding | tolerated(0.41) | benign(0) | TCGA-AR-A5QN-01 | Breast | breast invasive carcinoma | Female | >=65 | III/IV | Chemotherapy | taxotere | SD |
| FLAD1 | SNV | Missense_Mutation | novel | c.553N>C | p.Asp185His | p.D185H | Q8NFF5 | protein_coding | deleterious(0) | probably_damaging(1) | TCGA-C8-A27B-01 | Breast | breast invasive carcinoma | Female | <65 | I/II | Chemotherapy | 5-fluorouracil | CR |
| FLAD1 | SNV | Missense_Mutation | c.361N>C | p.Glu121Gln | p.E121Q | Q8NFF5 | protein_coding | deleterious(0) | probably_damaging(1) | TCGA-D8-A1JA-01 | Breast | breast invasive carcinoma | Female | <65 | III/IV | Chemotherapy | adriamycin | PD | |
| FLAD1 | SNV | Missense_Mutation | novel | c.1398N>A | p.Ser466Arg | p.S466R | Q8NFF5 | protein_coding | tolerated(0.55) | benign(0.038) | TCGA-E9-A295-01 | Breast | breast invasive carcinoma | Female | >=65 | I/II | Hormone Therapy | tamoxiphen | SD |
| Page: 1 2 3 4 5 6 7 |
Top |
Related drugs of malignant transformation related genes |
| Identification of chemicals and drugs interact with genes involved in malignant transfromation |
| (DGIdb 4.0) |
| Entrez ID | Symbol | Category | Interaction Types | Drug Claim Name | Drug Name | PMIDs |
| Page: 1 |

Copyright 2023-Present -The University of Texas Health Science Center at Houston |