Schematic overview of the cellular and molecular mechanisms involved in the cancer progression, including the proposed cellular and molecular mechanisms in cancer cells trajectory. AT1: alveolar type 1 cells; AT2: alveolar type 2 cells; AAH: atypical adenomatous hyperplasia; AIS: adenocarcinoma in situ; MIA: minimally invasive adenocarcinoma; IA: invasive adenocarcinoma; EMT: epithelial-mesenchymal transition

Home

Download

Statistics

Help

Contact

Center for Computational Systems Medicine
leaf

Gene summary

leaf

Malignant transformation analysis

leaf

Malignant transformation related pathway analysis

leaf

Cell-cell communication analysis

leaf

Single-cell gene regulatory network inference analysis

leaf

Somatic mutation of malignant transformation related genes

leaf

Related drugs of malignant transformation related genes

Gene: FKBP8

Gene summary for FKBP8

check button Gene summary.

Gene informationSpeciesHuman
Gene symbol

FKBP8

Gene ID

23770

Gene nameFKBP prolyl isomerase 8
Gene AliasFKBP38
Cytomap19p13.11
Gene Typeprotein-coding
GO ID

GO:0000413

UniProtAcc

A0A024R7P2


Top

Malignant transformation analysis

check button Identification of the aberrant gene expression in precancerous and cancerous lesions by comparing the gene expression of stem-like cells in diseased tissues with normal stem cells
check button Malignant transformation involving gene list.
Entrez IDSymbolReplicatesSpeciesOrganTissueAdj P-valueLog2FCMalignancy
23770FKBP8GSM4909280HumanBreastPrecancer4.16e-02-4.46e-010.0305
23770FKBP8GSM4909285HumanBreastIDC4.53e-083.32e-010.21
23770FKBP8GSM4909294HumanBreastIDC6.51e-06-1.68e-010.2022
23770FKBP8GSM4909296HumanBreastIDC1.37e-10-3.12e-010.1524
23770FKBP8GSM4909297HumanBreastIDC7.53e-16-2.96e-010.1517
23770FKBP8GSM4909301HumanBreastIDC6.05e-03-1.41e-010.1577
23770FKBP8GSM4909309HumanBreastIDC8.27e-04-2.31e-010.0483
23770FKBP8GSM4909311HumanBreastIDC3.32e-34-2.39e-010.1534
23770FKBP8GSM4909312HumanBreastIDC2.59e-158.29e-020.1552
23770FKBP8GSM4909316HumanBreastIDC2.74e-051.38e-020.21
23770FKBP8GSM4909319HumanBreastIDC1.44e-52-9.80e-020.1563
23770FKBP8GSM4909320HumanBreastIDC2.06e-132.96e-010.1575
23770FKBP8GSM4909321HumanBreastIDC4.75e-567.64e-010.1559
23770FKBP8NCCBC14HumanBreastDCIS3.36e-10-1.73e-010.2021
23770FKBP8NCCBC2HumanBreastDCIS1.57e-06-2.67e-010.1554
23770FKBP8NCCBC3HumanBreastDCIS3.82e-02-1.02e-020.1198
23770FKBP8NCCBC5HumanBreastDCIS7.19e-151.08e-020.2046
23770FKBP8P1HumanBreastIDC2.95e-19-2.44e-010.1527
23770FKBP8P2HumanBreastIDC1.59e-02-6.85e-020.21
23770FKBP8DCIS2HumanBreastDCIS1.24e-504.56e-020.0085
Page: 1 2 3 4 5 6 7 8 9 10 

check button Transcriptomic changes along malignancy continuum.
TissueExpression DynamicsAbbreviation
BreastThe image shows the transcriptomic changes along malignancy continuum.log2FC in expression of this searched gene in stem-like cells from each diseased tissue sample relative to stem-like cells in normal samples in each tissue plotted against the malignancy continuum. Samples are colored based on if they are from different disease stage.
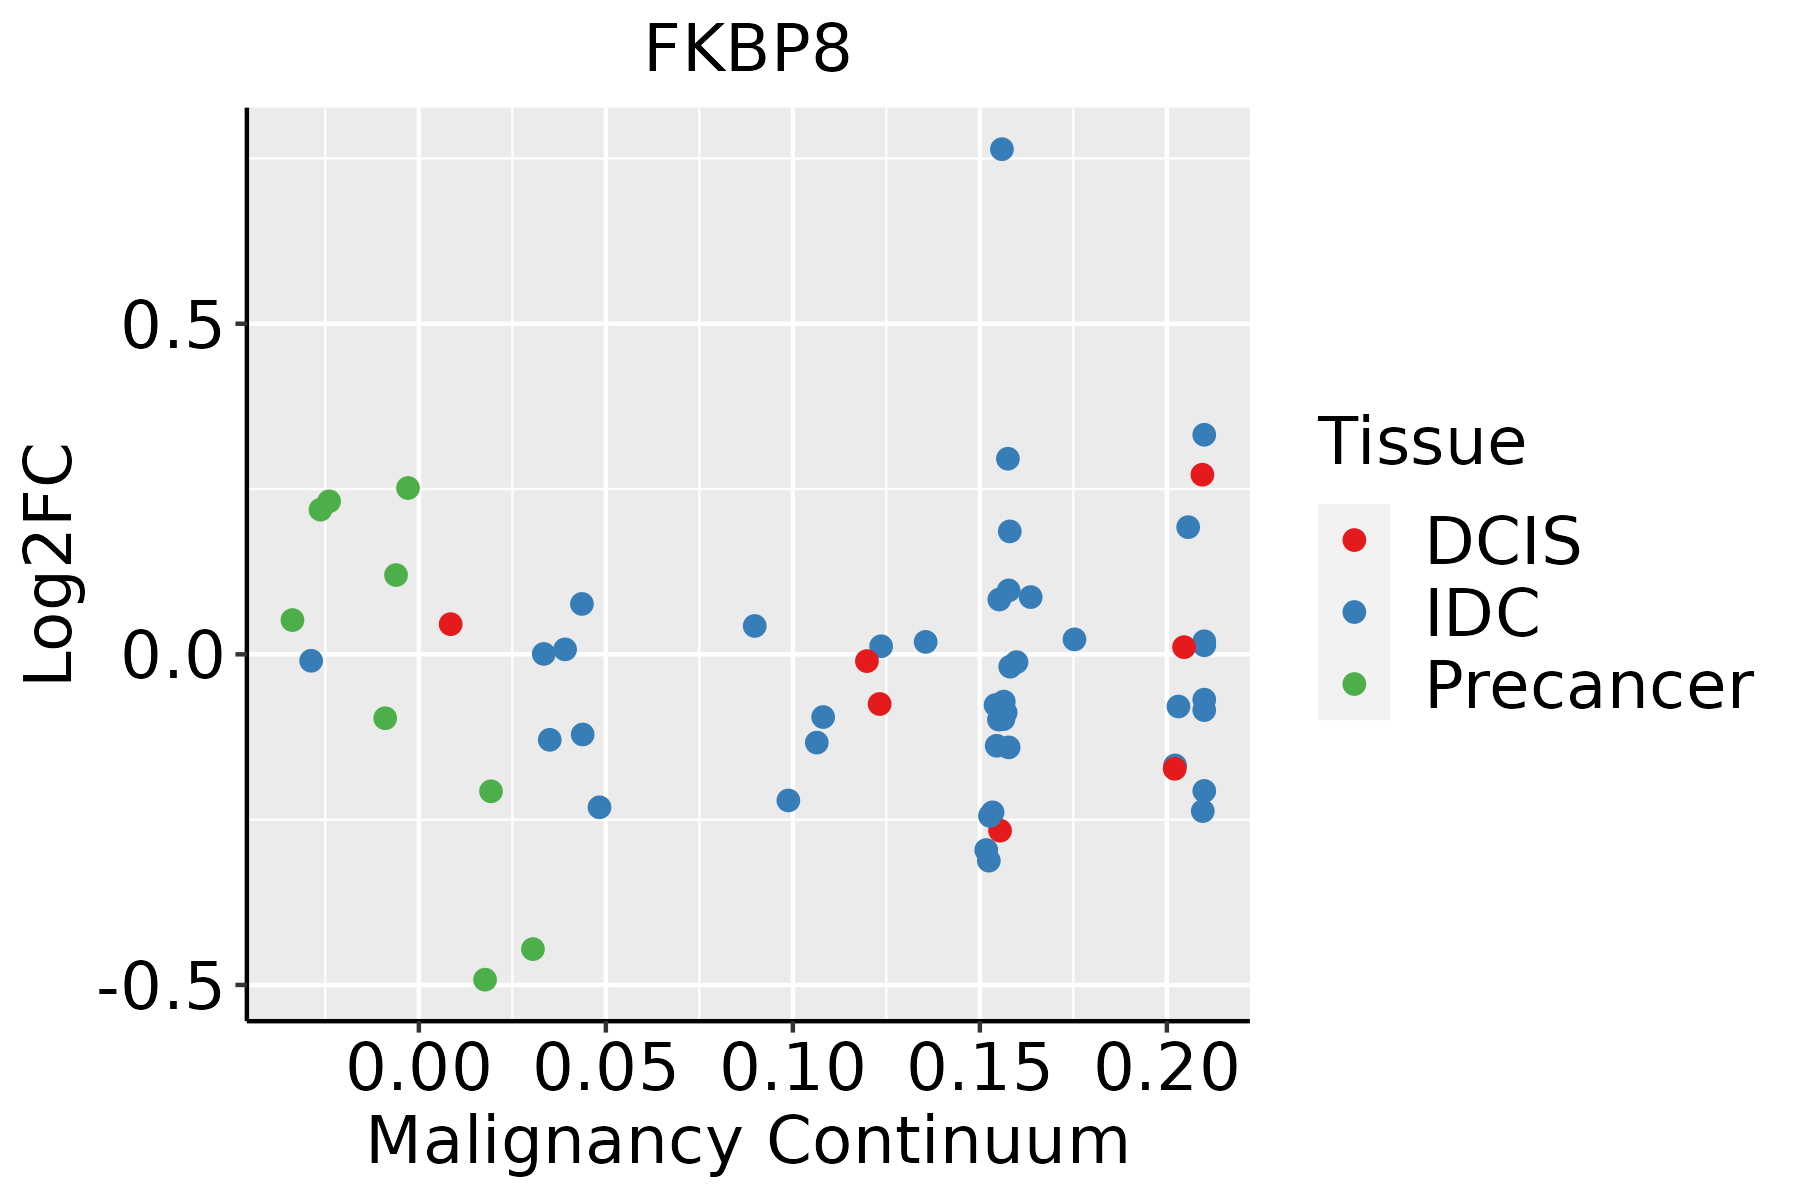
IDC: Invasive ductal carcinoma
DCIS: Ductal carcinoma in situ
Precancer(BRCA1-mut): Precancerous lesion from BRCA1 mutation carriers
EndometriumThe image shows the transcriptomic changes along malignancy continuum.log2FC in expression of this searched gene in stem-like cells from each diseased tissue sample relative to stem-like cells in normal samples in each tissue plotted against the malignancy continuum. Samples are colored based on if they are from different disease stage.
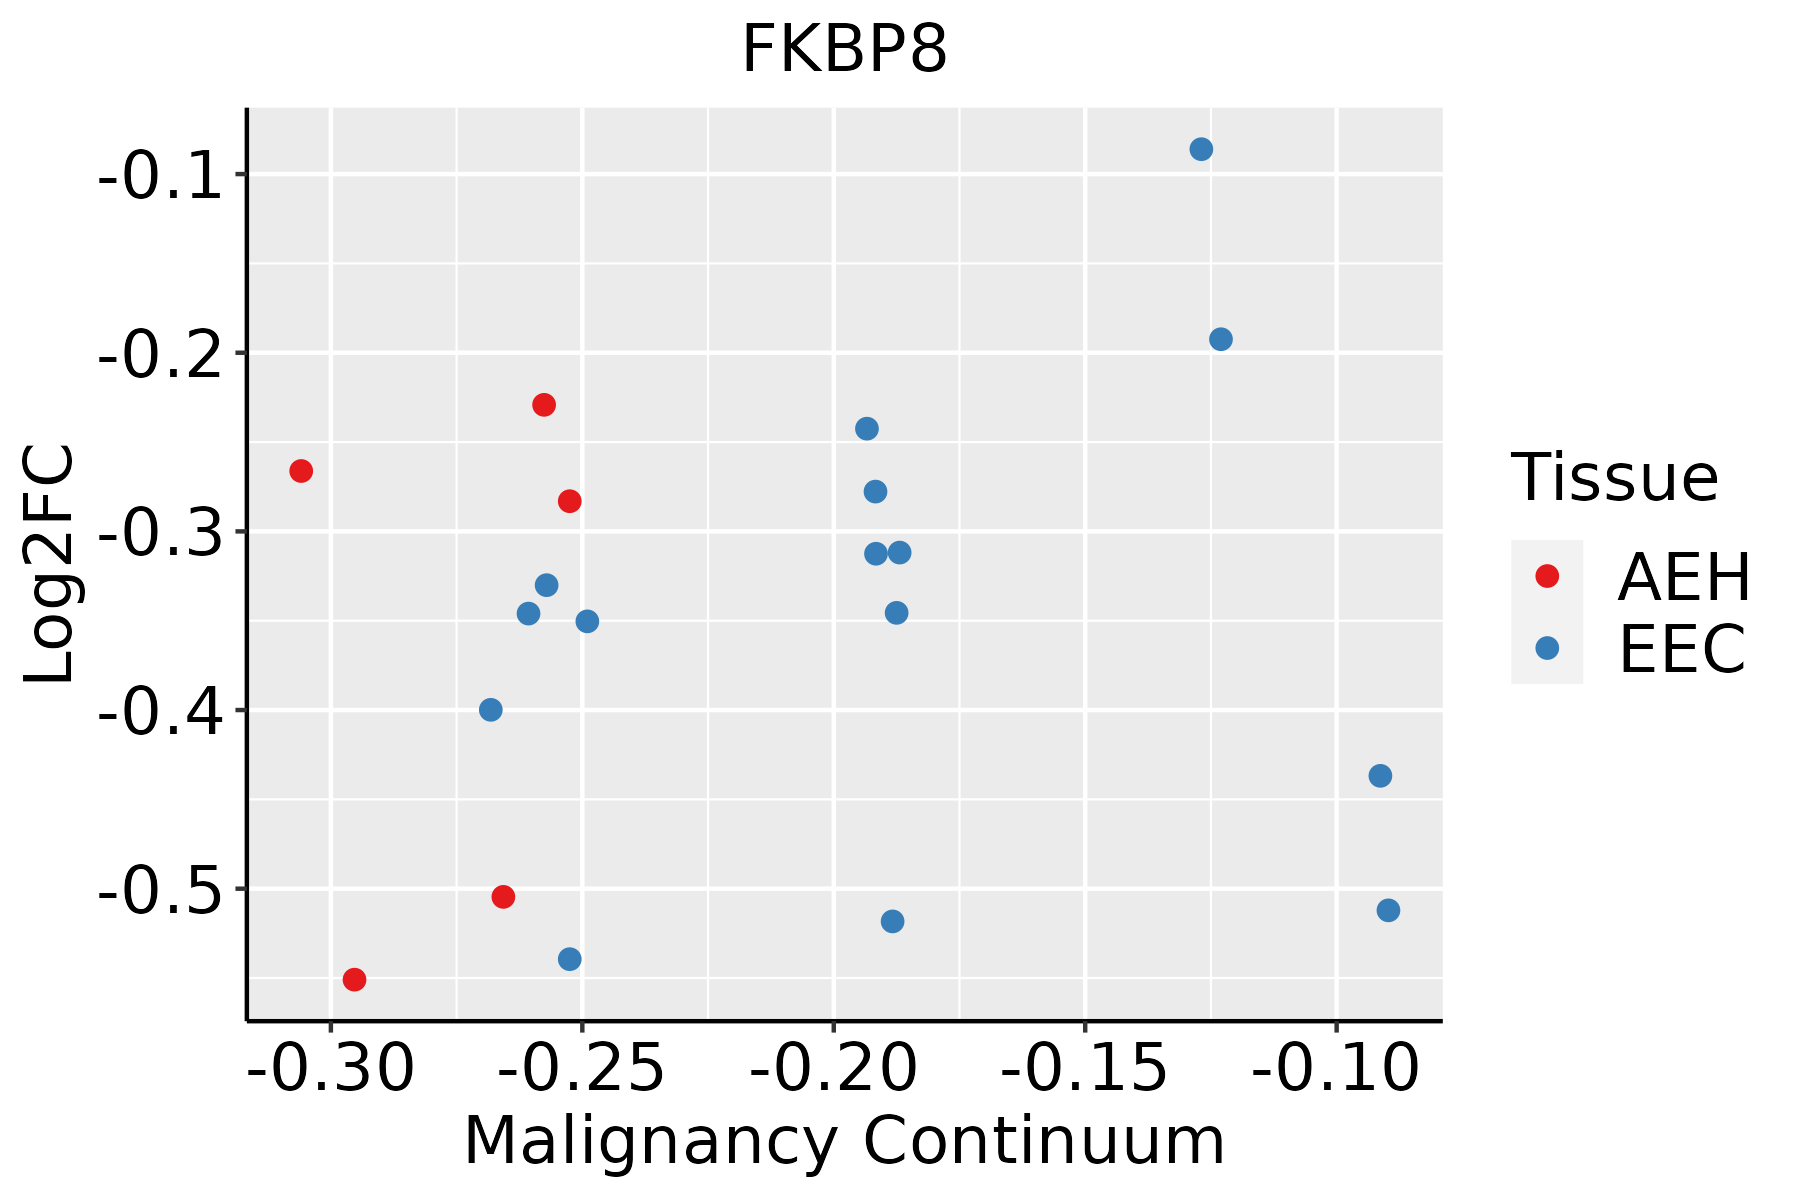
AEH: Atypical endometrial hyperplasia
EEC: Endometrioid Cancer
EsophagusThe image shows the transcriptomic changes along malignancy continuum.log2FC in expression of this searched gene in stem-like cells from each diseased tissue sample relative to stem-like cells in normal samples in each tissue plotted against the malignancy continuum. Samples are colored based on if they are from different disease stage.
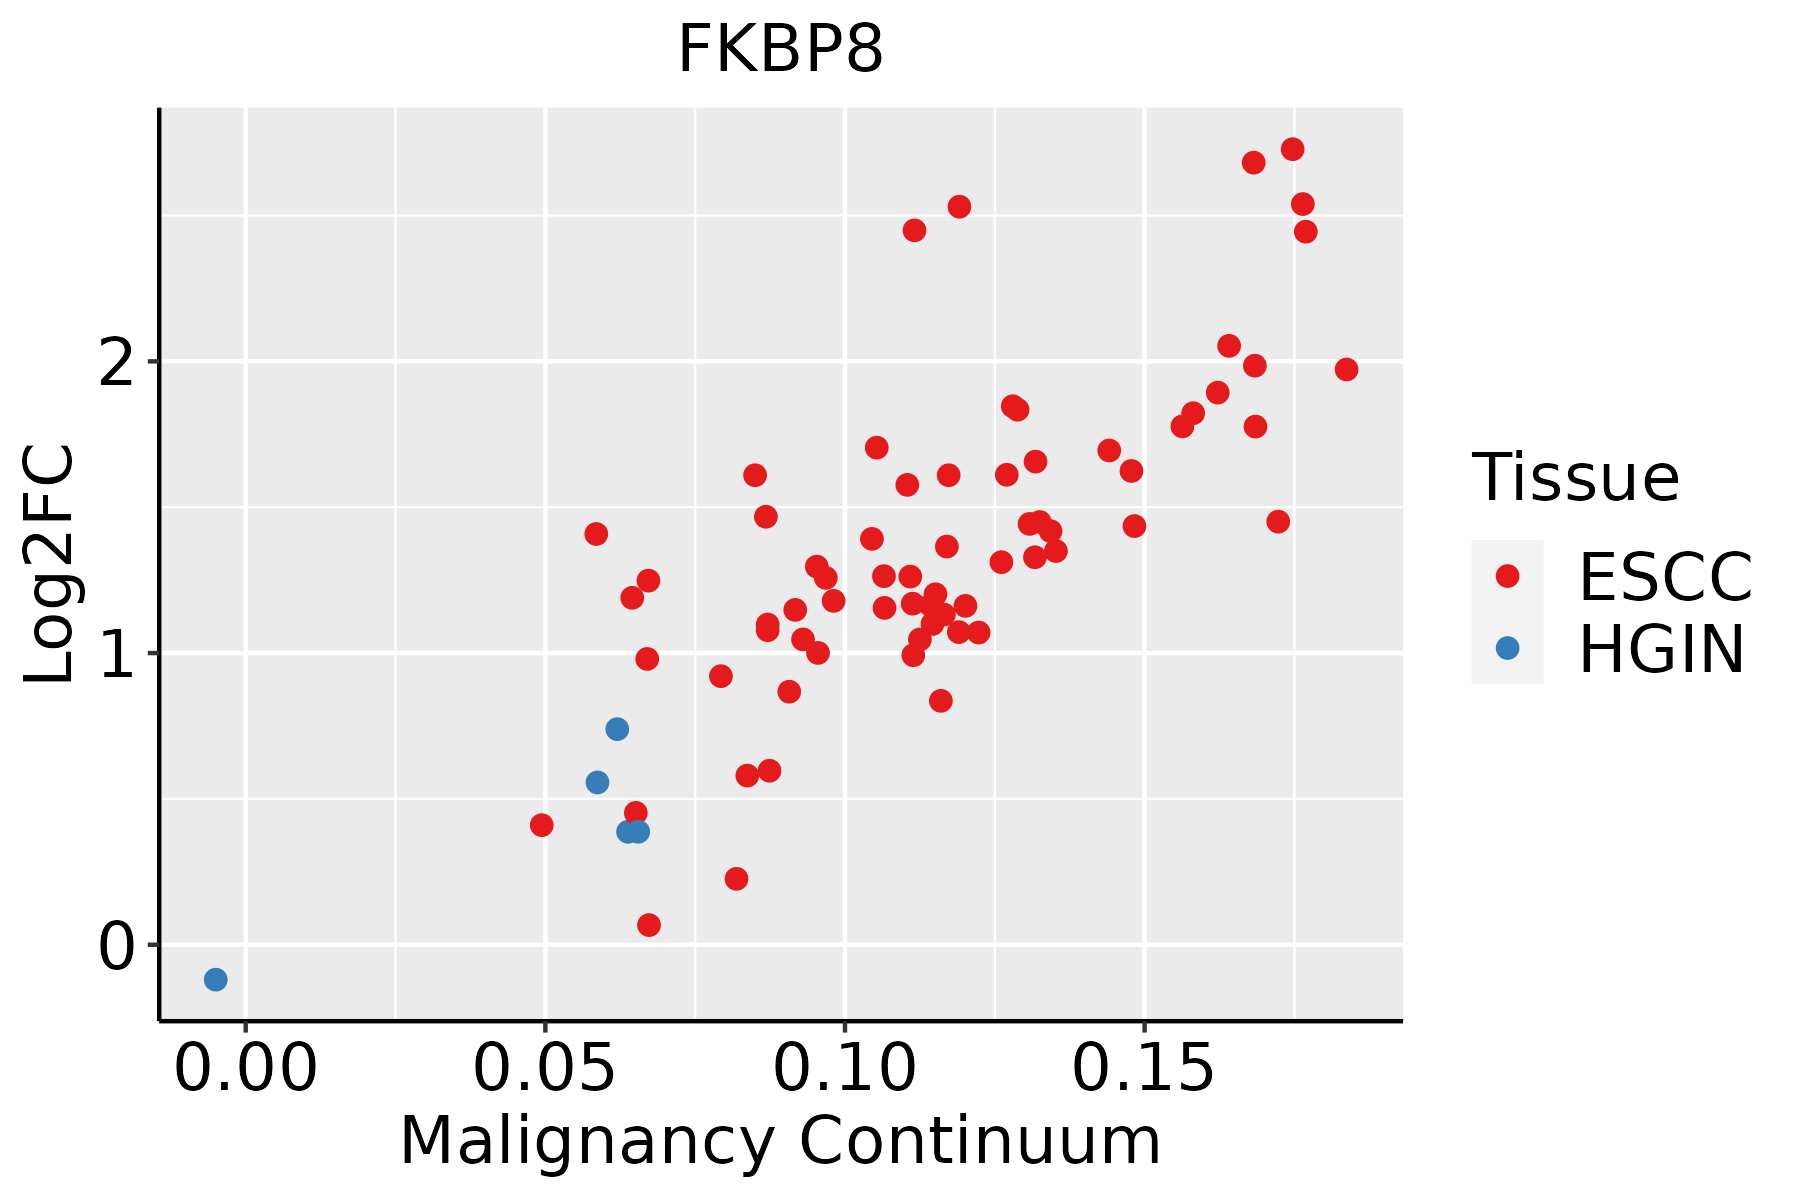
ESCC: Esophageal squamous cell carcinoma
HGIN: High-grade intraepithelial neoplasias
LGIN: Low-grade intraepithelial neoplasias
GCThe image shows the transcriptomic changes along malignancy continuum.log2FC in expression of this searched gene in stem-like cells from each diseased tissue sample relative to stem-like cells in normal samples in each tissue plotted against the malignancy continuum. Samples are colored based on if they are from different disease stage.
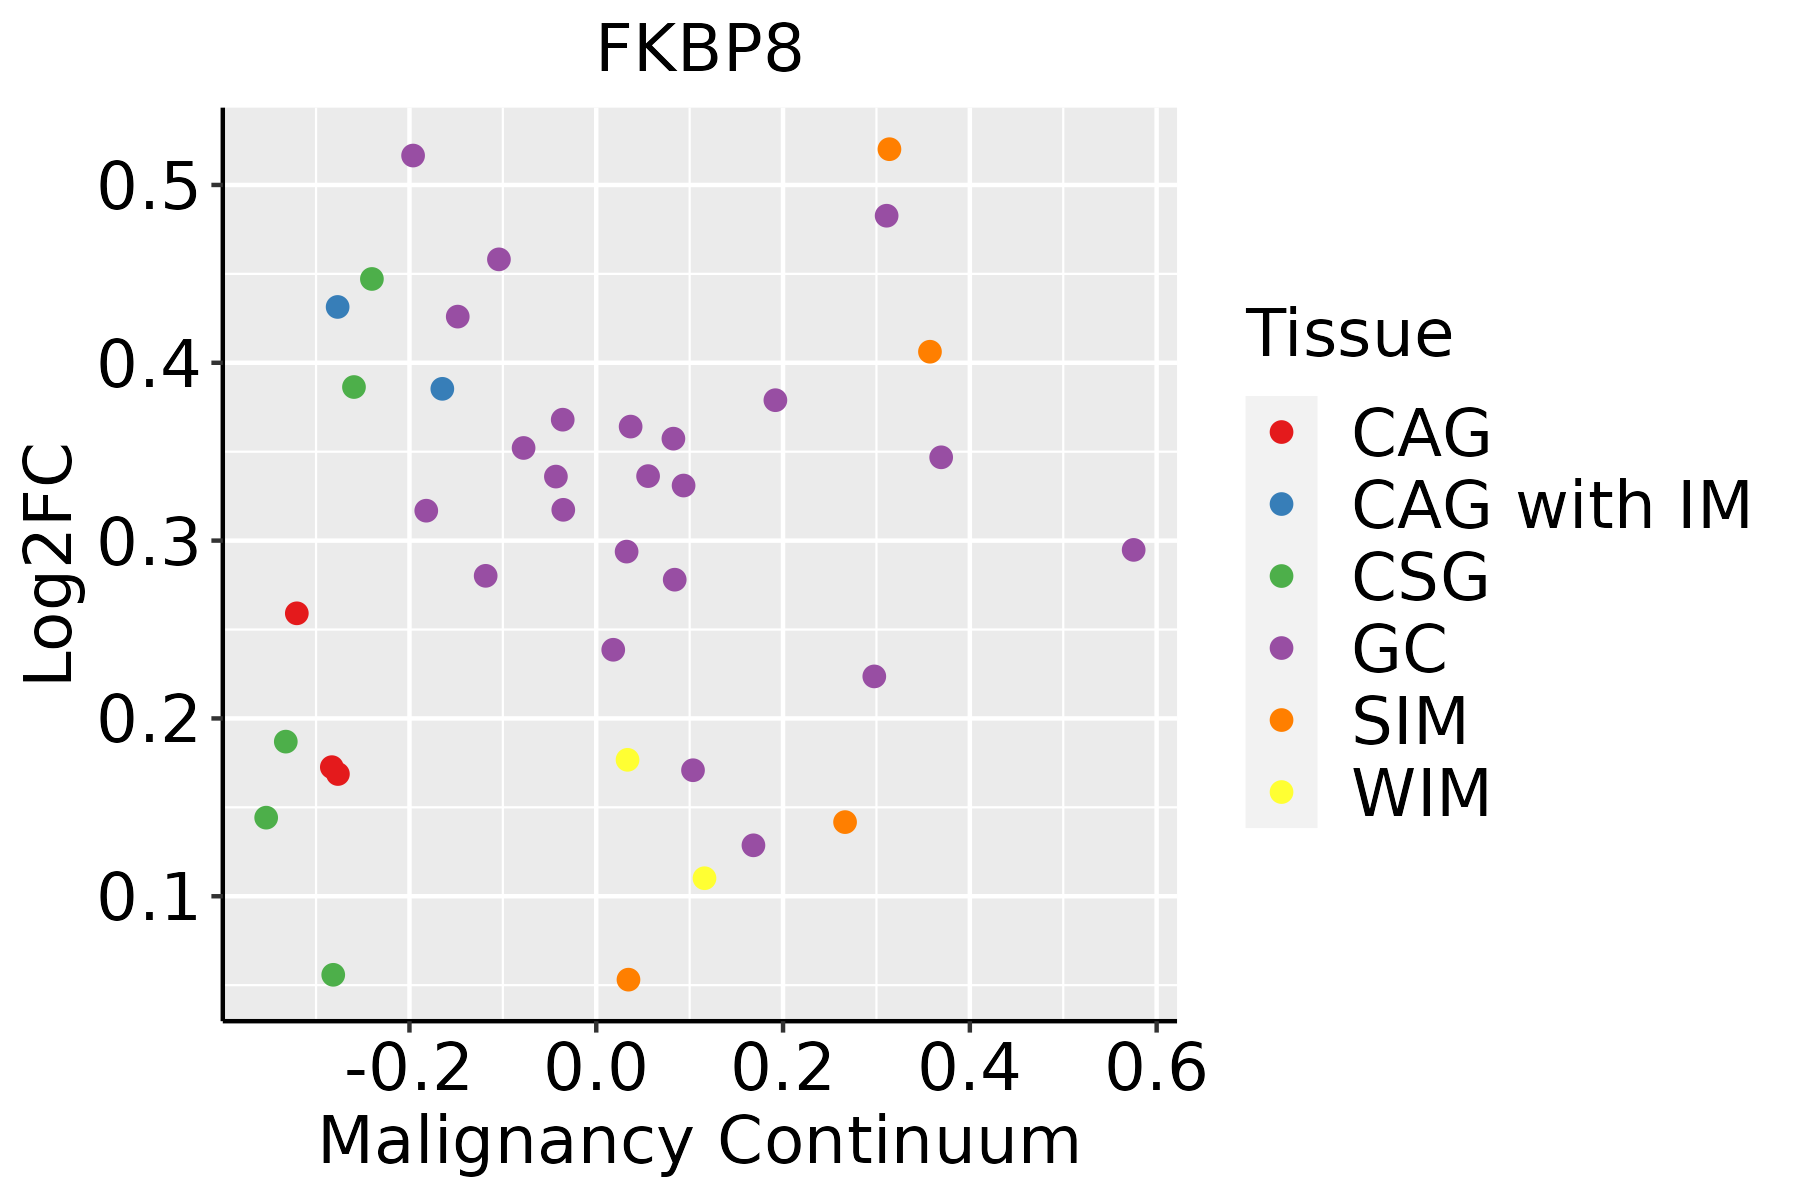
CAG: Chronic atrophic gastritis
CAG with IM: Chronic atrophic gastritis with intestinal metaplasia
CSG: Chronic superficial gastritis
GC: Gastric cancer
SIM: Severe intestinal metaplasia
WIM: Wild intestinal metaplasia
LiverThe image shows the transcriptomic changes along malignancy continuum.log2FC in expression of this searched gene in stem-like cells from each diseased tissue sample relative to stem-like cells in normal samples in each tissue plotted against the malignancy continuum. Samples are colored based on if they are from different disease stage.HCC: Hepatocellular carcinoma
NAFLD: Non-alcoholic fatty liver disease
Oral CavityThe image shows the transcriptomic changes along malignancy continuum.log2FC in expression of this searched gene in stem-like cells from each diseased tissue sample relative to stem-like cells in normal samples in each tissue plotted against the malignancy continuum. Samples are colored based on if they are from different disease stage.EOLP: Erosive Oral lichen planus
LP: leukoplakia
NEOLP: Non-erosive oral lichen planus
OSCC: Oral squamous cell carcinoma
ProstateThe image shows the transcriptomic changes along malignancy continuum.log2FC in expression of this searched gene in stem-like cells from each diseased tissue sample relative to stem-like cells in normal samples in each tissue plotted against the malignancy continuum. Samples are colored based on if they are from different disease stage.
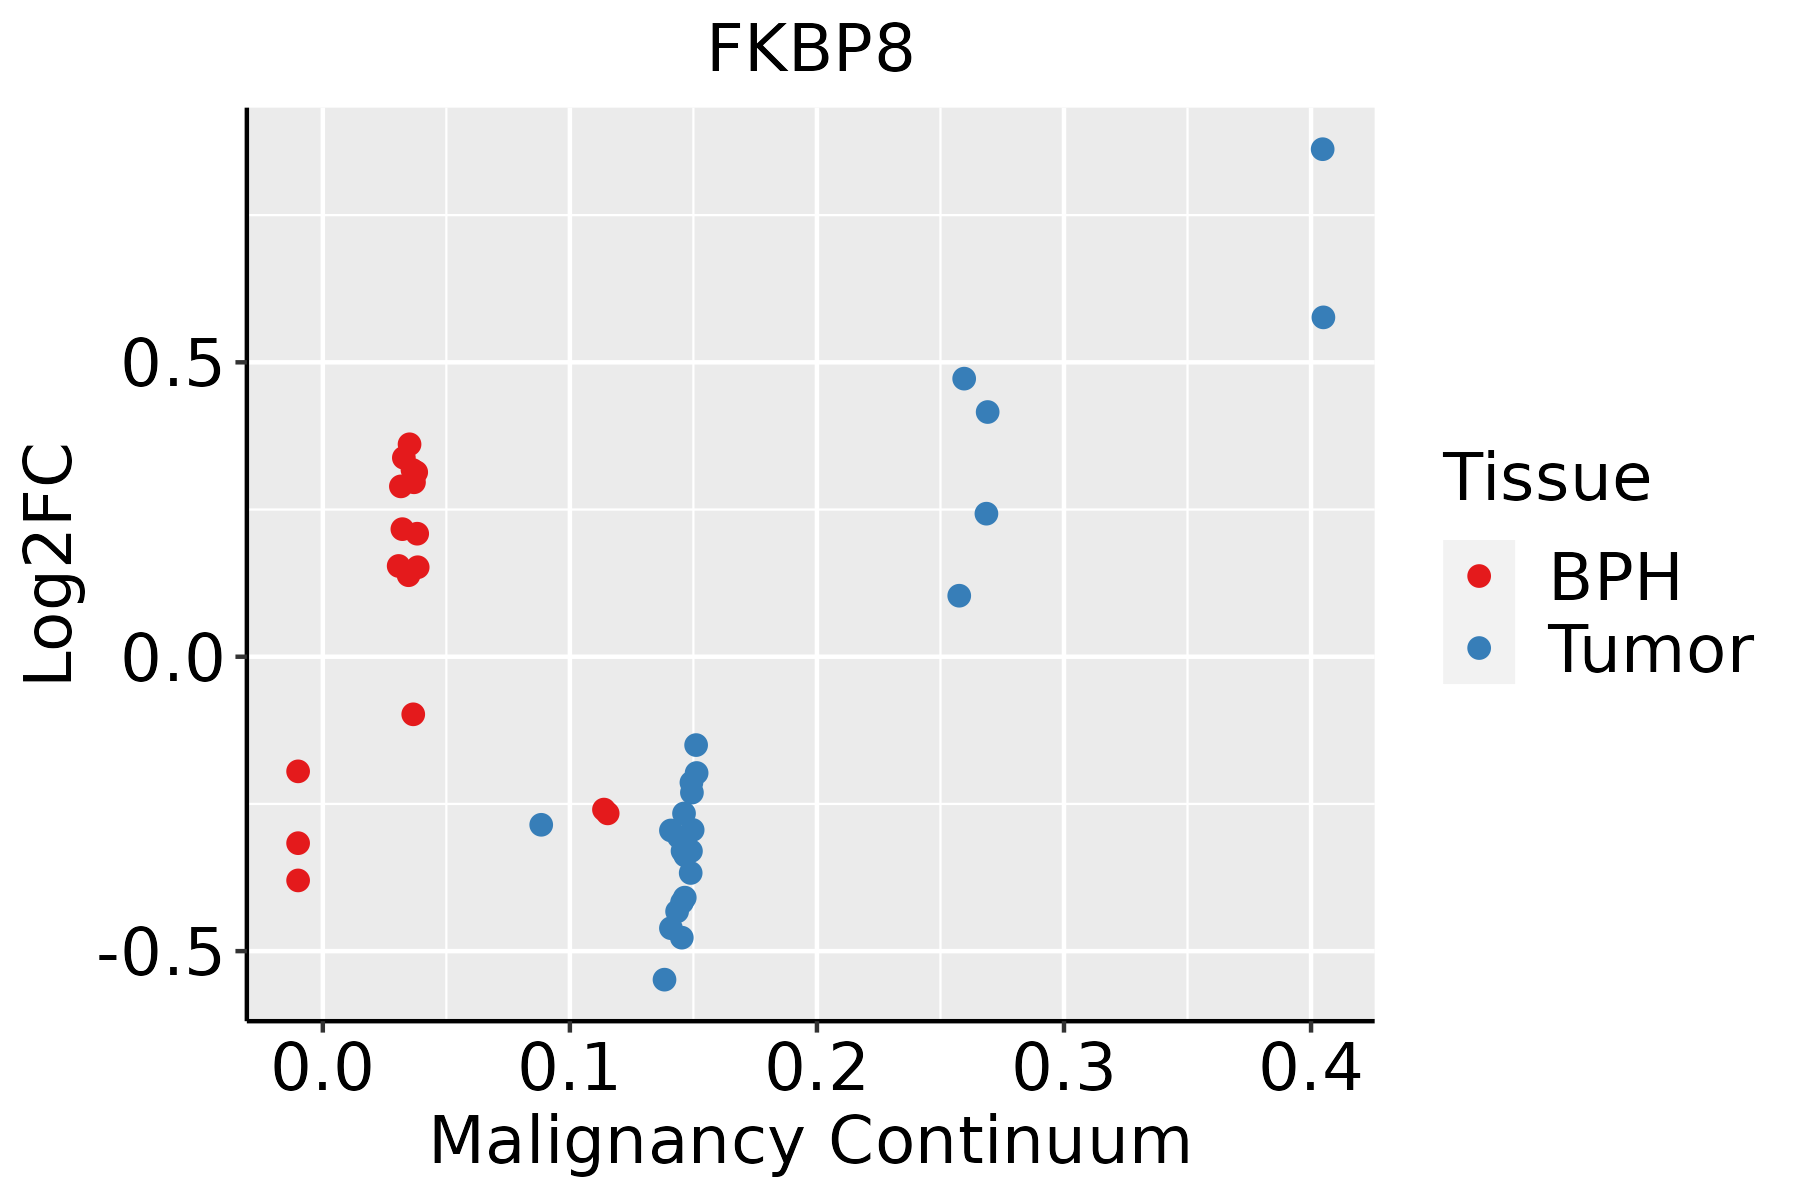
BPH: Benign Prostatic Hyperplasia
SkinThe image shows the transcriptomic changes along malignancy continuum.log2FC in expression of this searched gene in stem-like cells from each diseased tissue sample relative to stem-like cells in normal samples in each tissue plotted against the malignancy continuum. Samples are colored based on if they are from different disease stage.AK: Actinic keratosis
cSCC: Cutaneous squamous cell carcinoma
SCCIS:squamous cell carcinoma in situ
ThyroidThe image shows the transcriptomic changes along malignancy continuum.log2FC in expression of this searched gene in stem-like cells from each diseased tissue sample relative to stem-like cells in normal samples in each tissue plotted against the malignancy continuum. Samples are colored based on if they are from different disease stage.ATC: Anaplastic thyroid cancer
HT: Hashimoto's thyroiditis
PTC: Papillary thyroid cancer
∗log2FC in expression of this searched gene in stem-like cells from each diseased tissue sample relative to stem-like cells in normal samples in each tissue plotted against the malignancy continuum. Samples are colored based on if they are from different disease stage.

Top

Malignant transformation related pathway analysis

check buttonFind out the enriched GO biological processes and KEGG pathways involved in transition from healthy to precancer to cancer
check button Figure of enriched GO biological processes.
TissueDisease StageEnriched GO biological Processes
ColorectumADGO analysis - Figure of enriched GO biological processes: Top 15 enriched GO BP terms are showed in the bar plot of each disease state in each tissue. Each row represents a significant GO biological process which is colored according to the -log10(p.adjust).
ColorectumSERGO analysis - Figure of enriched GO biological processes: Top 15 enriched GO BP terms are showed in the bar plot of each disease state in each tissue. Each row represents a significant GO biological process which is colored according to the -log10(p.adjust).
ColorectumMSSGO analysis - Figure of enriched GO biological processes: Top 15 enriched GO BP terms are showed in the bar plot of each disease state in each tissue. Each row represents a significant GO biological process which is colored according to the -log10(p.adjust).
ColorectumMSI-HGO analysis - Figure of enriched GO biological processes: Top 15 enriched GO BP terms are showed in the bar plot of each disease state in each tissue. Each row represents a significant GO biological process which is colored according to the -log10(p.adjust).
ColorectumFAPGO analysis - Figure of enriched GO biological processes: Top 15 enriched GO BP terms are showed in the bar plot of each disease state in each tissue. Each row represents a significant GO biological process which is colored according to the -log10(p.adjust).
∗Top 15 enriched GO BP terms are showed in the bar plot of each disease state in each tissue. Each row represents a significant GO biological process which is colored according to the -log10(p.adjust).
Page: 1 2 3 4 5 6 7 8 9 

check button Enriched GO biological processes.
GO IDTissueDisease StageDescriptionGene RatioBg Ratiopvaluep.adjustCount
GO:00064578BreastPrecancerprotein folding43/1080212/187233.48e-137.45e-1143
GO:00182085BreastPrecancerpeptidyl-proline modification10/108058/187231.62e-031.65e-0210
GO:000645713BreastIDCprotein folding47/1434212/187232.31e-113.86e-0947
GO:001820812BreastIDCpeptidyl-proline modification13/143458/187233.59e-045.18e-0313
GO:00459369BreastIDCnegative regulation of phosphate metabolic process53/1434441/187237.21e-048.79e-0353
GO:00105639BreastIDCnegative regulation of phosphorus metabolic process53/1434442/187237.60e-049.25e-0353
GO:000645723BreastDCISprotein folding47/1390212/187237.84e-121.53e-0947
GO:001820821BreastDCISpeptidyl-proline modification13/139058/187232.65e-044.03e-0313
GO:004593614BreastDCISnegative regulation of phosphate metabolic process53/1390441/187233.48e-044.96e-0353
GO:001056314BreastDCISnegative regulation of phosphorus metabolic process53/1390442/187233.68e-045.18e-0353
GO:00423269BreastDCISnegative regulation of phosphorylation43/1390385/187234.78e-033.62e-0243
GO:00019339BreastDCISnegative regulation of protein phosphorylation39/1390342/187234.94e-033.71e-0239
GO:000645710EndometriumAEHprotein folding61/2100212/187231.86e-123.48e-1061
GO:00071787EndometriumAEHtransmembrane receptor protein serine/threonine kinase signaling pathway67/2100355/187231.28e-052.80e-0467
GO:004593616EndometriumAEHnegative regulation of phosphate metabolic process77/2100441/187235.13e-058.25e-0477
GO:001056316EndometriumAEHnegative regulation of phosphorus metabolic process77/2100442/187235.54e-058.79e-0477
GO:000193315EndometriumAEHnegative regulation of protein phosphorylation60/2100342/187232.89e-043.31e-0360
GO:00305092EndometriumAEHBMP signaling pathway32/2100152/187233.15e-043.54e-0332
GO:00004133EndometriumAEHprotein peptidyl-prolyl isomerization13/210042/187234.74e-044.91e-0313
GO:00182086EndometriumAEHpeptidyl-proline modification16/210058/187234.75e-044.91e-0316
Page: 1 2 3 4 5 6 7 8 9 10 

check button Enriched KEGG pathways.
Pathway IDTissueDisease StageDescriptionGene RatioBg Ratiopvaluep.adjustqvalueCount
Page: 1 

Top

Cell-cell communication analysis

check buttonIdentification of potential cell-cell interactions between two cell types and their ligand-receptor pairs for different disease states
LigandReceptorLRpairPathwayTissueDisease Stage
Page: 1 

Top

Single-cell gene regulatory network inference analysis

check buttonFind out the significant the regulons (TFs) and the target genes of each regulon across cell types for different disease states
TFCell TypeTissueDisease StageTarget GeneRSSRegulon Activity
∗The dot plots of a searched regulon are shown for all cell subpopulations in each disease state of each tissue based on the regulon specific score inferred using pySCENIC and by calculating the average expression.
Page: 1 

Top

Somatic mutation of malignant transformation related genes

check buttonAnnotation of somatic variants for genes involved in malignant transformation
Hugo SymbolVariant ClassVariant ClassificationdbSNP RSHGVScHGVSpHGVSp ShortSWISSPROTBIOTYPESIFTPolyPhenTumor Sample BarcodeTissueHistologySexAgeStageTherapy TypesDrugsOutcome
FKBP8SNVMissense_Mutationc.928N>Gp.Leu310Valp.L310VQ14318protein_codingdeleterious(0)probably_damaging(0.997)TCGA-A8-A08L-01Breastbreast invasive carcinomaFemale>=65III/IVUnknownUnknownSD
FKBP8SNVMissense_Mutationc.747N>Gp.Ile249Metp.I249MQ14318protein_codingdeleterious(0.01)possibly_damaging(0.753)TCGA-AC-A23H-01Breastbreast invasive carcinomaFemale>=65I/IIUnknownUnknownPD
FKBP8SNVMissense_Mutationrs760604410c.454N>Ap.Val152Ilep.V152IQ14318protein_codingdeleterious(0.05)possibly_damaging(0.719)TCGA-AQ-A0Y5-01Breastbreast invasive carcinomaFemale>=65III/IVChemotherapycytoxanSD
FKBP8SNVMissense_Mutationnovelc.136G>Cp.Glu46Glnp.E46QQ14318protein_codingtolerated_low_confidence(0.07)benign(0.01)TCGA-B6-A0RG-01Breastbreast invasive carcinomaFemale<65I/IIUnknownUnknownSD
FKBP8SNVMissense_Mutationnovelc.127N>Cp.Glu43Glnp.E43QQ14318protein_codingdeleterious_low_confidence(0.04)benign(0.025)TCGA-D8-A1JA-01Breastbreast invasive carcinomaFemale<65III/IVChemotherapyadriamycinPD
FKBP8SNVMissense_Mutationc.451N>Tp.Asp151Tyrp.D151YQ14318protein_codingdeleterious(0)probably_damaging(0.971)TCGA-D8-A1XO-01Breastbreast invasive carcinomaFemale<65I/IIHormone TherapytamoxiphenSD
FKBP8insertionNonsense_Mutationnovelc.491_492insAAAAATTTAAAAATTAGCTGGGTGTGGGCCGGGp.Asp164delinsGluLysIleTerLysLeuAlaGlyCysGlyProGlyp.D164delinsEKI*KLAGCGPGQ14318protein_codingTCGA-B6-A0RG-01Breastbreast invasive carcinomaFemale<65I/IIUnknownUnknownSD
FKBP8insertionFrame_Shift_Insnovelc.77_78insTTTATTTTTTGTAGAGATGGGGTCTCp.Asp28PhefsTer31p.D28Ffs*31Q14318protein_codingTCGA-BH-A0EE-01Breastbreast invasive carcinomaFemale>=65I/IIChemotherapydocetaxelSD
FKBP8SNVMissense_Mutationc.1105C>Ap.Leu369Metp.L369MQ14318protein_codingdeleterious(0.03)possibly_damaging(0.725)TCGA-C5-A1BL-01Cervixcervical & endocervical cancerFemale<65I/IIUnknownUnknownSD
FKBP8SNVMissense_Mutationrs771523688c.1064C>Tp.Ala355Valp.A355VQ14318protein_codingtolerated(0.08)benign(0.02)TCGA-EA-A3HU-01Cervixcervical & endocervical cancerFemale<65I/IIUnknownUnknownSD
Page: 1 2 3 4 5 

Top

Related drugs of malignant transformation related genes

check buttonIdentification of chemicals and drugs interact with genes involved in malignant transfromation
(DGIdb 4.0)
Entrez IDSymbolCategoryInteraction TypesDrug Claim NameDrug NamePMIDs
Page: 1