
|
|||||
|
 | |
| |
| |
| |
| |
| |
|
Gene: FKBP7 |
Gene summary for FKBP7 |
| Gene information | Species | Human | Gene symbol | FKBP7 | Gene ID | 51661 |
| Gene name | FKBP prolyl isomerase 7 | |
| Gene Alias | FKBP23 | |
| Cytomap | 2q31.2 | |
| Gene Type | protein-coding | GO ID | GO:0000413 | UniProtAcc | Q9Y680 |
Top |
Malignant transformation analysis |
| Identification of the aberrant gene expression in precancerous and cancerous lesions by comparing the gene expression of stem-like cells in diseased tissues with normal stem cells |
| Entrez ID | Symbol | Replicates | Species | Organ | Tissue | Adj P-value | Log2FC | Malignancy |
| 51661 | FKBP7 | LZE8T | Human | Esophagus | ESCC | 2.87e-02 | 1.09e-01 | 0.067 |
| 51661 | FKBP7 | P2T-E | Human | Esophagus | ESCC | 3.04e-20 | 2.99e-01 | 0.1177 |
| 51661 | FKBP7 | P4T-E | Human | Esophagus | ESCC | 5.17e-10 | 4.56e-01 | 0.1323 |
| 51661 | FKBP7 | P8T-E | Human | Esophagus | ESCC | 7.95e-05 | 1.37e-01 | 0.0889 |
| 51661 | FKBP7 | P9T-E | Human | Esophagus | ESCC | 4.42e-11 | 3.08e-01 | 0.1131 |
| 51661 | FKBP7 | P10T-E | Human | Esophagus | ESCC | 1.19e-23 | 4.04e-01 | 0.116 |
| 51661 | FKBP7 | P11T-E | Human | Esophagus | ESCC | 1.03e-09 | 2.58e-01 | 0.1426 |
| 51661 | FKBP7 | P12T-E | Human | Esophagus | ESCC | 7.19e-15 | 2.20e-01 | 0.1122 |
| 51661 | FKBP7 | P15T-E | Human | Esophagus | ESCC | 1.41e-03 | 1.39e-01 | 0.1149 |
| 51661 | FKBP7 | P16T-E | Human | Esophagus | ESCC | 2.05e-14 | 2.78e-01 | 0.1153 |
| 51661 | FKBP7 | P17T-E | Human | Esophagus | ESCC | 3.50e-02 | 1.05e-01 | 0.1278 |
| 51661 | FKBP7 | P20T-E | Human | Esophagus | ESCC | 1.43e-08 | 1.73e-01 | 0.1124 |
| 51661 | FKBP7 | P21T-E | Human | Esophagus | ESCC | 5.46e-06 | 1.64e-01 | 0.1617 |
| 51661 | FKBP7 | P22T-E | Human | Esophagus | ESCC | 9.76e-05 | 1.78e-01 | 0.1236 |
| 51661 | FKBP7 | P23T-E | Human | Esophagus | ESCC | 7.73e-04 | 2.00e-01 | 0.108 |
| 51661 | FKBP7 | P24T-E | Human | Esophagus | ESCC | 2.96e-09 | 2.46e-01 | 0.1287 |
| 51661 | FKBP7 | P26T-E | Human | Esophagus | ESCC | 1.78e-03 | 1.29e-01 | 0.1276 |
| 51661 | FKBP7 | P27T-E | Human | Esophagus | ESCC | 1.81e-02 | 1.05e-01 | 0.1055 |
| 51661 | FKBP7 | P30T-E | Human | Esophagus | ESCC | 1.26e-11 | 3.20e-01 | 0.137 |
| 51661 | FKBP7 | P31T-E | Human | Esophagus | ESCC | 3.43e-14 | 2.00e-01 | 0.1251 |
| Page: 1 2 3 |
| Tissue | Expression Dynamics | Abbreviation |
| Esophagus |  | ESCC: Esophageal squamous cell carcinoma |
| HGIN: High-grade intraepithelial neoplasias | ||
| LGIN: Low-grade intraepithelial neoplasias | ||
| Thyroid | 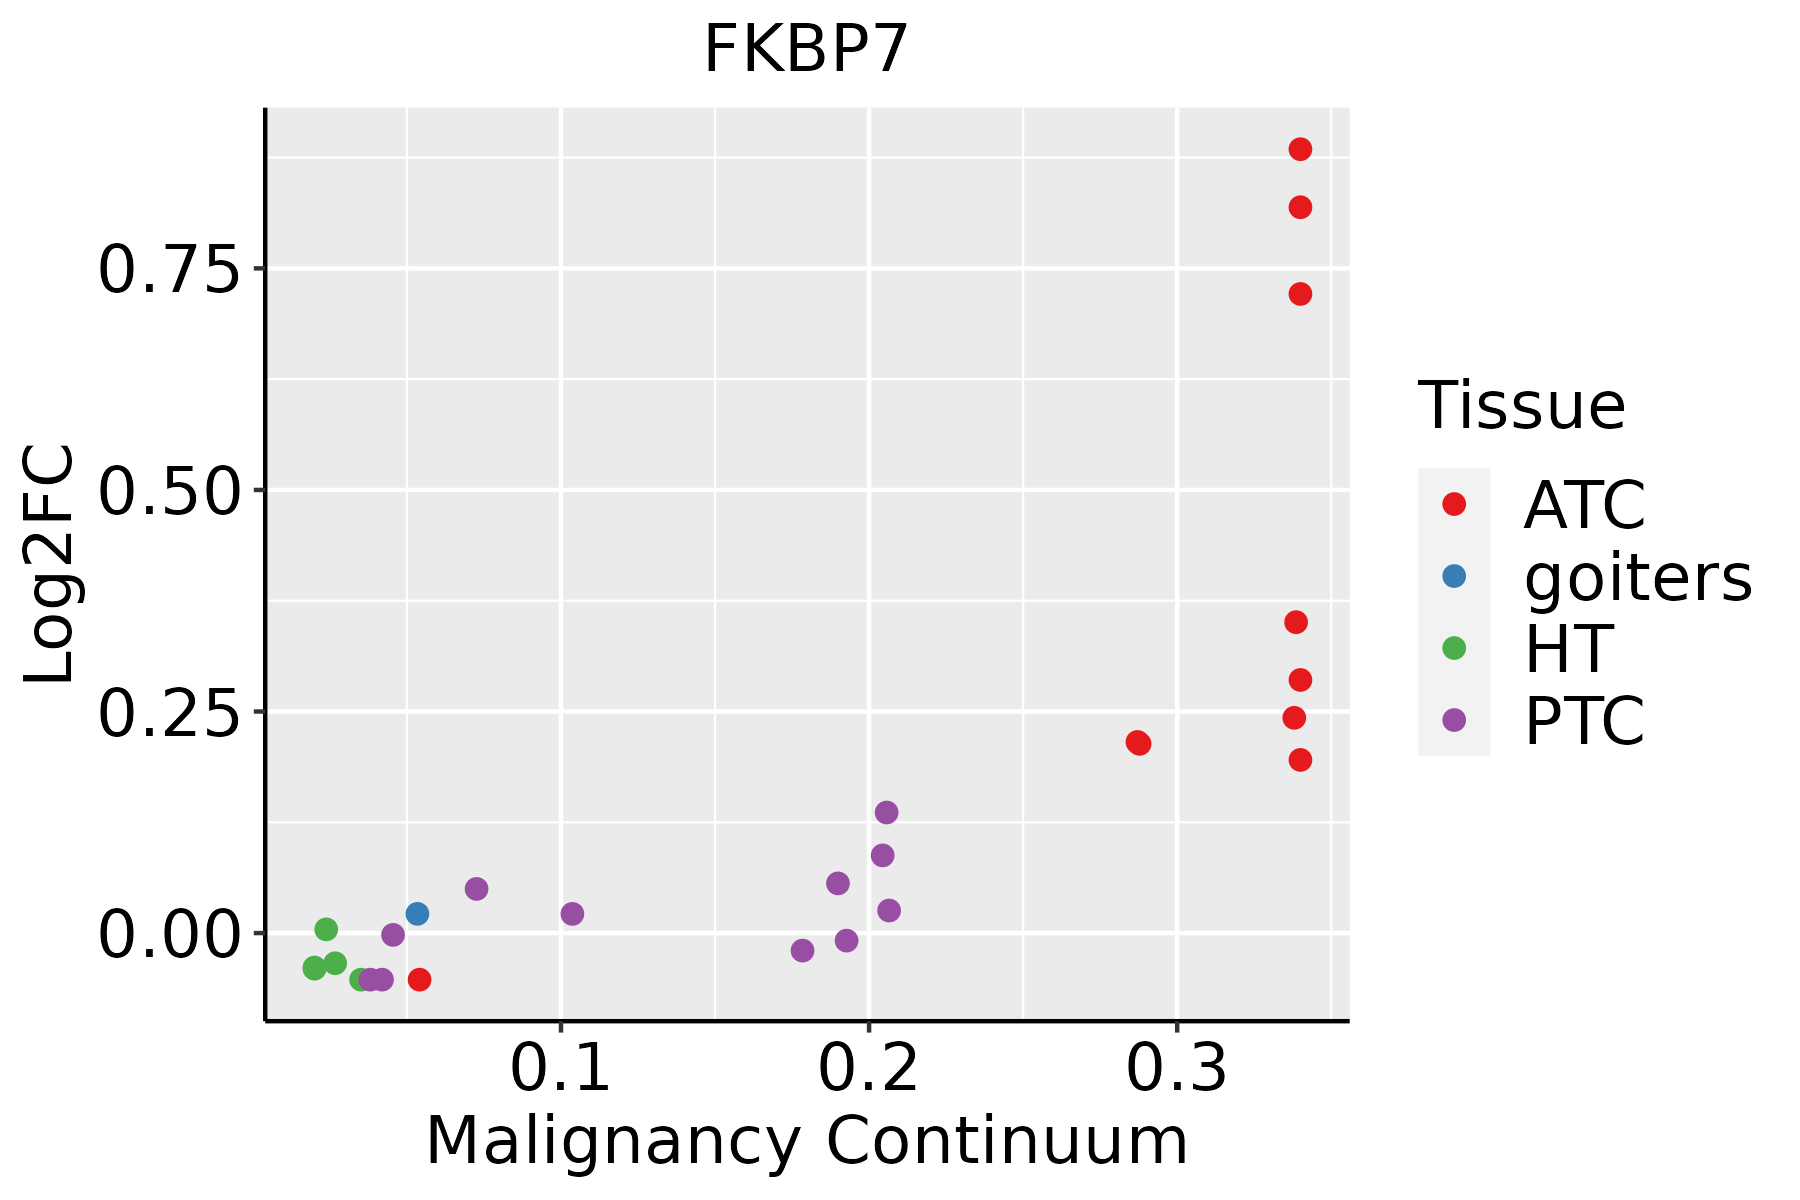 | ATC: Anaplastic thyroid cancer |
| HT: Hashimoto's thyroiditis | ||
| PTC: Papillary thyroid cancer |
| ∗log2FC in expression of this searched gene in stem-like cells from each diseased tissue sample relative to stem-like cells in normal samples in each tissue plotted against the malignancy continuum. Samples are colored based on if they are from different disease stage. |
Top |
Malignant transformation related pathway analysis |
| Find out the enriched GO biological processes and KEGG pathways involved in transition from healthy to precancer to cancer |
| Tissue | Disease Stage | Enriched GO biological Processes |
| Colorectum | AD |  |
| Colorectum | SER |  |
| Colorectum | MSS |  |
| Colorectum | MSI-H |  |
| Colorectum | FAP |  |
| ∗Top 15 enriched GO BP terms are showed in the bar plot of each disease state in each tissue. Each row represents a significant GO biological process which is colored according to the -log10(p.adjust). |
| Page: 1 2 3 4 5 6 7 8 9 |
| GO ID | Tissue | Disease Stage | Description | Gene Ratio | Bg Ratio | pvalue | p.adjust | Count |
| GO:001820816 | Esophagus | ESCC | peptidyl-proline modification | 46/8552 | 58/18723 | 1.59e-07 | 2.51e-06 | 46 |
| GO:000041313 | Esophagus | ESCC | protein peptidyl-prolyl isomerization | 32/8552 | 42/18723 | 5.52e-05 | 4.27e-04 | 32 |
| GO:001820817 | Thyroid | PTC | peptidyl-proline modification | 42/5968 | 58/18723 | 2.71e-10 | 8.91e-09 | 42 |
| GO:00004137 | Thyroid | PTC | protein peptidyl-prolyl isomerization | 30/5968 | 42/18723 | 1.65e-07 | 3.13e-06 | 30 |
| GO:001820818 | Thyroid | ATC | peptidyl-proline modification | 42/6293 | 58/18723 | 1.70e-09 | 4.21e-08 | 42 |
| GO:000041314 | Thyroid | ATC | protein peptidyl-prolyl isomerization | 30/6293 | 42/18723 | 6.06e-07 | 8.44e-06 | 30 |
| Page: 1 |
| Pathway ID | Tissue | Disease Stage | Description | Gene Ratio | Bg Ratio | pvalue | p.adjust | qvalue | Count |
| Page: 1 |
Top |
Cell-cell communication analysis |
| Identification of potential cell-cell interactions between two cell types and their ligand-receptor pairs for different disease states |
| Ligand | Receptor | LRpair | Pathway | Tissue | Disease Stage |
| Page: 1 |
Top |
Single-cell gene regulatory network inference analysis |
| Find out the significant the regulons (TFs) and the target genes of each regulon across cell types for different disease states |
| TF | Cell Type | Tissue | Disease Stage | Target Gene | RSS | Regulon Activity |
| ∗The dot plots of a searched regulon are shown for all cell subpopulations in each disease state of each tissue based on the regulon specific score inferred using pySCENIC and by calculating the average expression. |
| Page: 1 |
Top |
Somatic mutation of malignant transformation related genes |
| Annotation of somatic variants for genes involved in malignant transformation |
| Hugo Symbol | Variant Class | Variant Classification | dbSNP RS | HGVSc | HGVSp | HGVSp Short | SWISSPROT | BIOTYPE | SIFT | PolyPhen | Tumor Sample Barcode | Tissue | Histology | Sex | Age | Stage | Therapy Types | Drugs | Outcome |
| FKBP7 | SNV | Missense_Mutation | c.74N>C | p.Arg25Thr | p.R25T | Q9Y680 | protein_coding | tolerated(0.61) | benign(0) | TCGA-A7-A13D-01 | Breast | breast invasive carcinoma | Female | <65 | I/II | Chemotherapy | cytoxan | SD | |
| FKBP7 | insertion | Frame_Shift_Ins | novel | c.136_137insTAATGATTAACTTTGGGCAAATCATACTTCTTTCTGGTGATTATAG | p.Cys46LeufsTer18 | p.C46Lfs*18 | Q9Y680 | protein_coding | TCGA-BH-A0DZ-01 | Breast | breast invasive carcinoma | Female | <65 | I/II | Chemotherapy | docetaxel | SD | ||
| FKBP7 | SNV | Missense_Mutation | c.110N>C | p.Ile37Thr | p.I37T | Q9Y680 | protein_coding | tolerated(0.11) | benign(0.187) | TCGA-C5-A1M5-01 | Cervix | cervical & endocervical cancer | Female | <65 | I/II | Unknown | Unknown | PD | |
| FKBP7 | SNV | Missense_Mutation | c.544N>A | p.Glu182Lys | p.E182K | Q9Y680 | protein_coding | tolerated(0.14) | benign(0.062) | TCGA-JW-A5VJ-01 | Cervix | cervical & endocervical cancer | Female | <65 | I/II | Unknown | Unknown | PD | |
| FKBP7 | SNV | Missense_Mutation | novel | c.454N>C | p.Glu152Gln | p.E152Q | Q9Y680 | protein_coding | deleterious(0.01) | probably_damaging(0.947) | TCGA-ZJ-AAXU-01 | Cervix | cervical & endocervical cancer | Female | <65 | I/II | Unknown | Unknown | SD |
| FKBP7 | SNV | Missense_Mutation | c.611N>C | p.Asp204Ala | p.D204A | Q9Y680 | protein_coding | deleterious(0) | possibly_damaging(0.678) | TCGA-CA-6718-01 | Colorectum | colon adenocarcinoma | Male | <65 | I/II | Unknown | Unknown | PD | |
| FKBP7 | SNV | Missense_Mutation | rs752288280 | c.326N>A | p.Arg109Gln | p.R109Q | Q9Y680 | protein_coding | deleterious(0) | probably_damaging(0.988) | TCGA-CA-6718-01 | Colorectum | colon adenocarcinoma | Male | <65 | I/II | Unknown | Unknown | PD |
| FKBP7 | SNV | Missense_Mutation | c.21C>A | p.Phe7Leu | p.F7L | Q9Y680 | protein_coding | tolerated(0.27) | benign(0) | TCGA-AG-3892-01 | Colorectum | rectum adenocarcinoma | Female | <65 | I/II | Unknown | Unknown | SD | |
| FKBP7 | SNV | Missense_Mutation | novel | c.58C>A | p.Leu20Ile | p.L20I | Q9Y680 | protein_coding | tolerated(0.4) | benign(0.005) | TCGA-AG-A01J-01 | Colorectum | rectum adenocarcinoma | Female | <65 | I/II | Unknown | Unknown | SD |
| FKBP7 | SNV | Missense_Mutation | rs774968692 | c.412N>A | p.Glu138Lys | p.E138K | Q9Y680 | protein_coding | tolerated(0.06) | possibly_damaging(0.621) | TCGA-A5-A0G2-01 | Endometrium | uterine corpus endometrioid carcinoma | Female | <65 | III/IV | Unknown | Unknown | SD |
| Page: 1 2 3 |
Top |
Related drugs of malignant transformation related genes |
| Identification of chemicals and drugs interact with genes involved in malignant transfromation |
| (DGIdb 4.0) |
| Entrez ID | Symbol | Category | Interaction Types | Drug Claim Name | Drug Name | PMIDs |
| Page: 1 |

Copyright 2023-Present -The University of Texas Health Science Center at Houston |