| Tissue | Expression Dynamics | Abbreviation |
| Breast |  | IDC: Invasive ductal carcinoma |
| DCIS: Ductal carcinoma in situ |
| Precancer(BRCA1-mut): Precancerous lesion from BRCA1 mutation carriers |
| Cervix |  | CC: Cervix cancer |
| HSIL_HPV: HPV-infected high-grade squamous intraepithelial lesions |
| N_HPV: HPV-infected normal cervix |
| Colorectum (GSE201348) |  | FAP: Familial adenomatous polyposis |
| CRC: Colorectal cancer |
| Colorectum (HTA11) |  | AD: Adenomas |
| SER: Sessile serrated lesions |
| MSI-H: Microsatellite-high colorectal cancer |
| MSS: Microsatellite stable colorectal cancer |
| Endometrium |  | AEH: Atypical endometrial hyperplasia |
| EEC: Endometrioid Cancer |
| Esophagus | 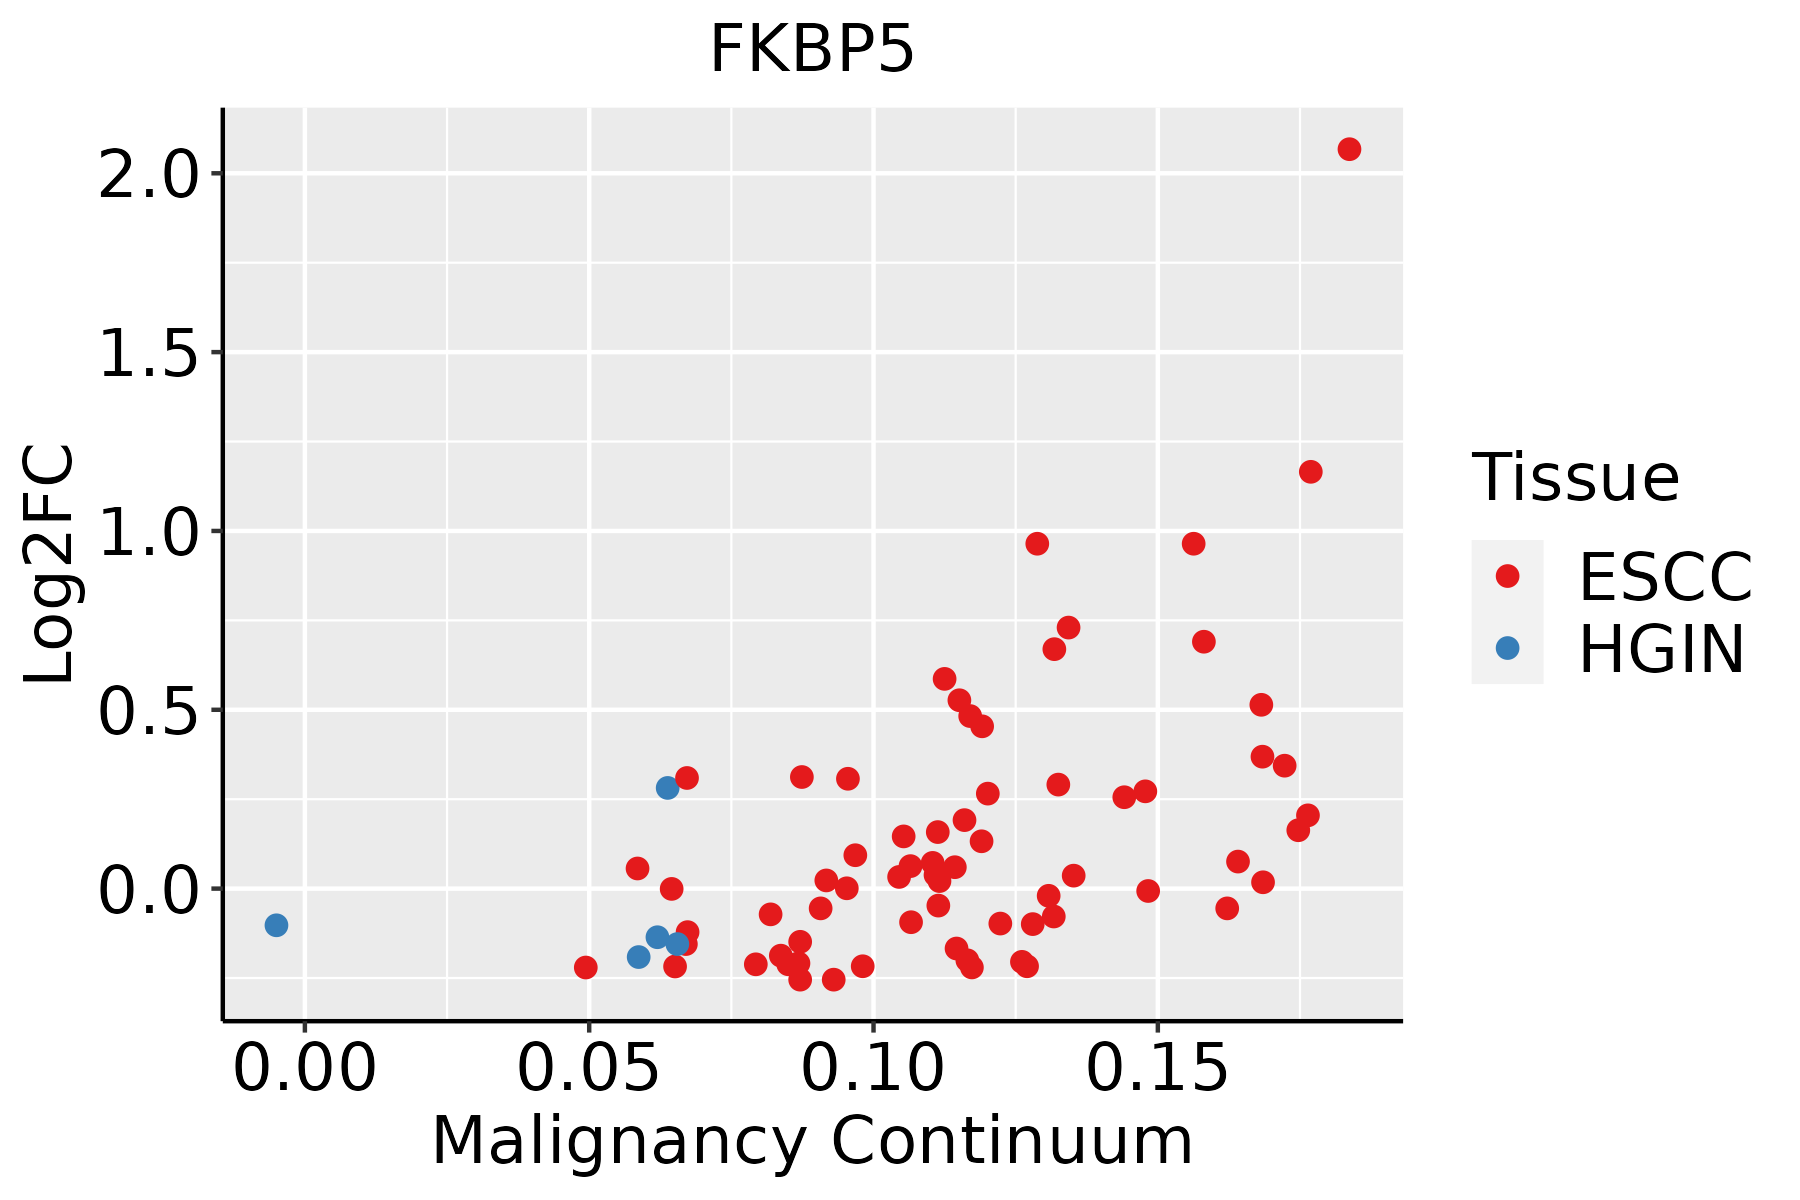 | ESCC: Esophageal squamous cell carcinoma |
| HGIN: High-grade intraepithelial neoplasias |
| LGIN: Low-grade intraepithelial neoplasias |
| Liver | 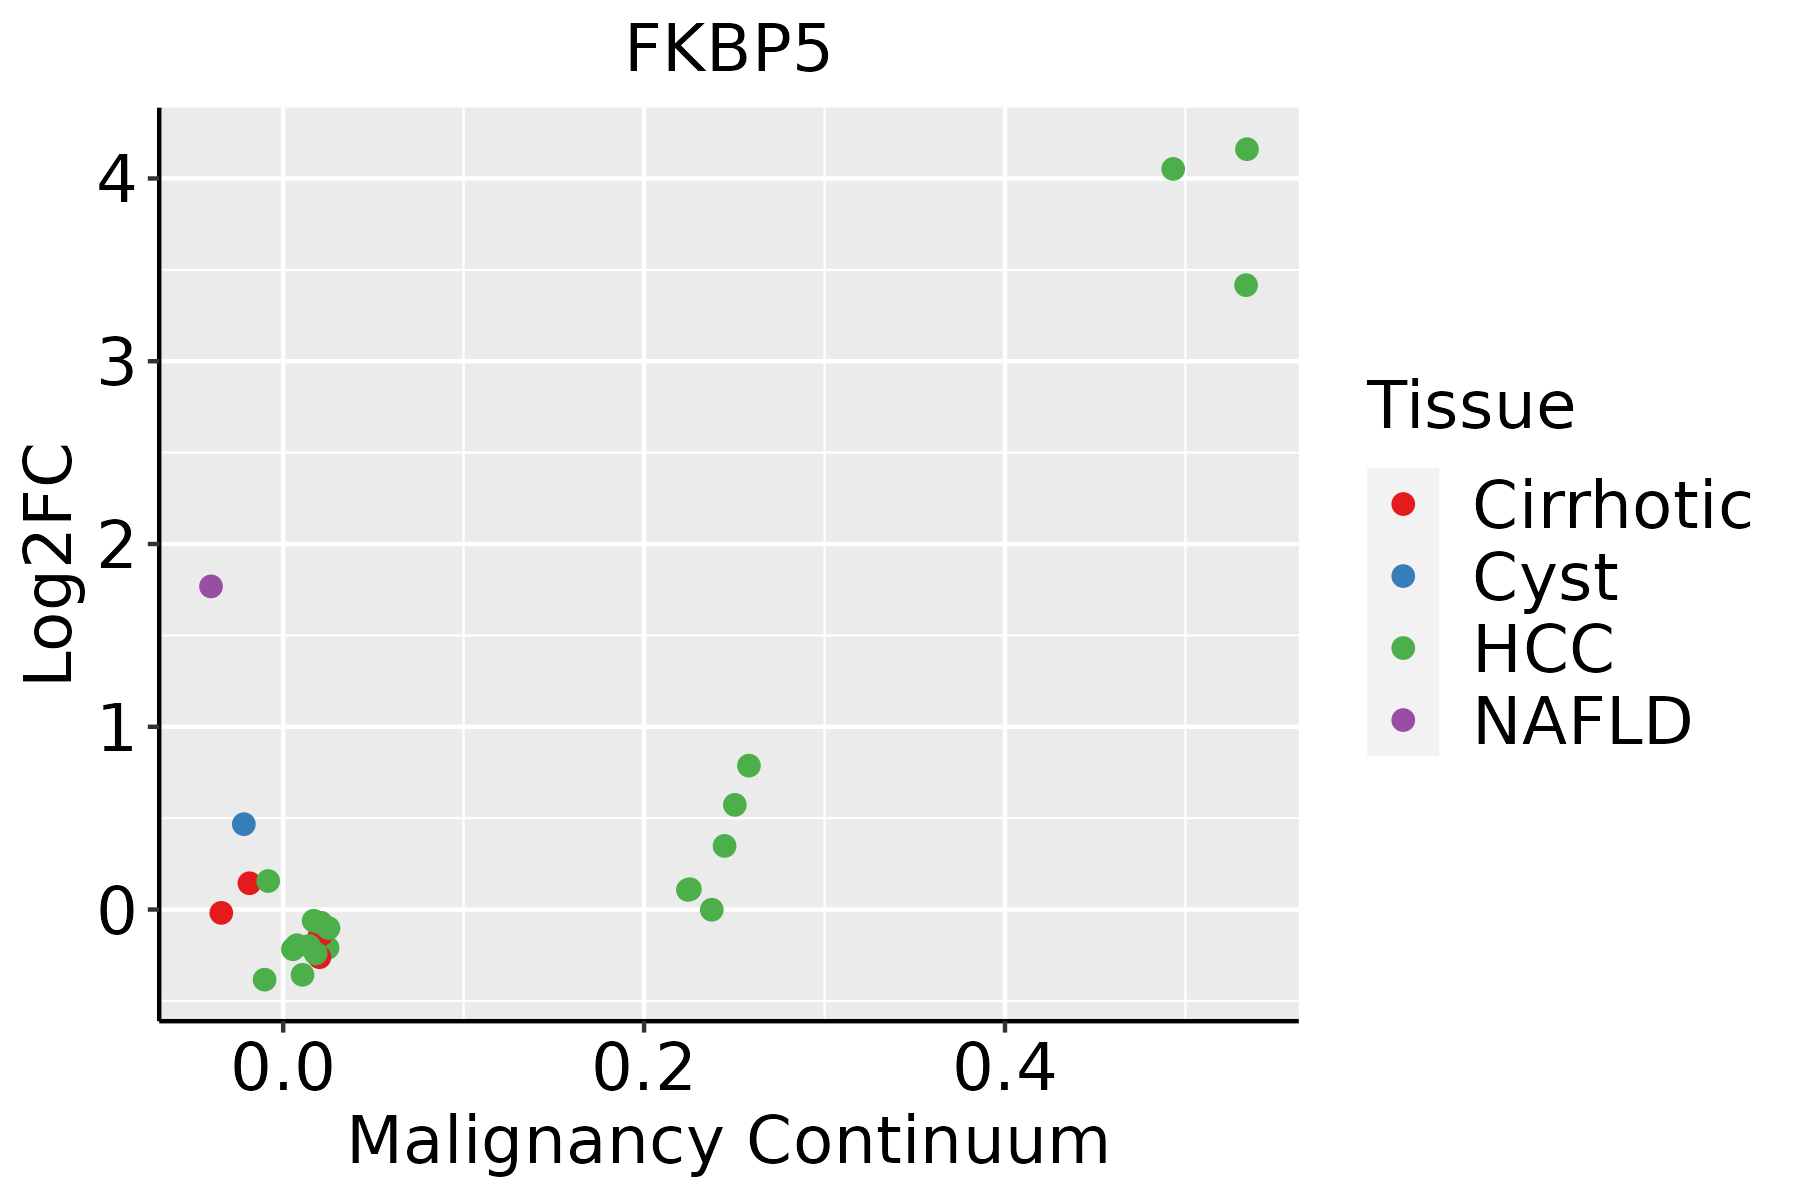 | HCC: Hepatocellular carcinoma |
| NAFLD: Non-alcoholic fatty liver disease |
| Oral Cavity | 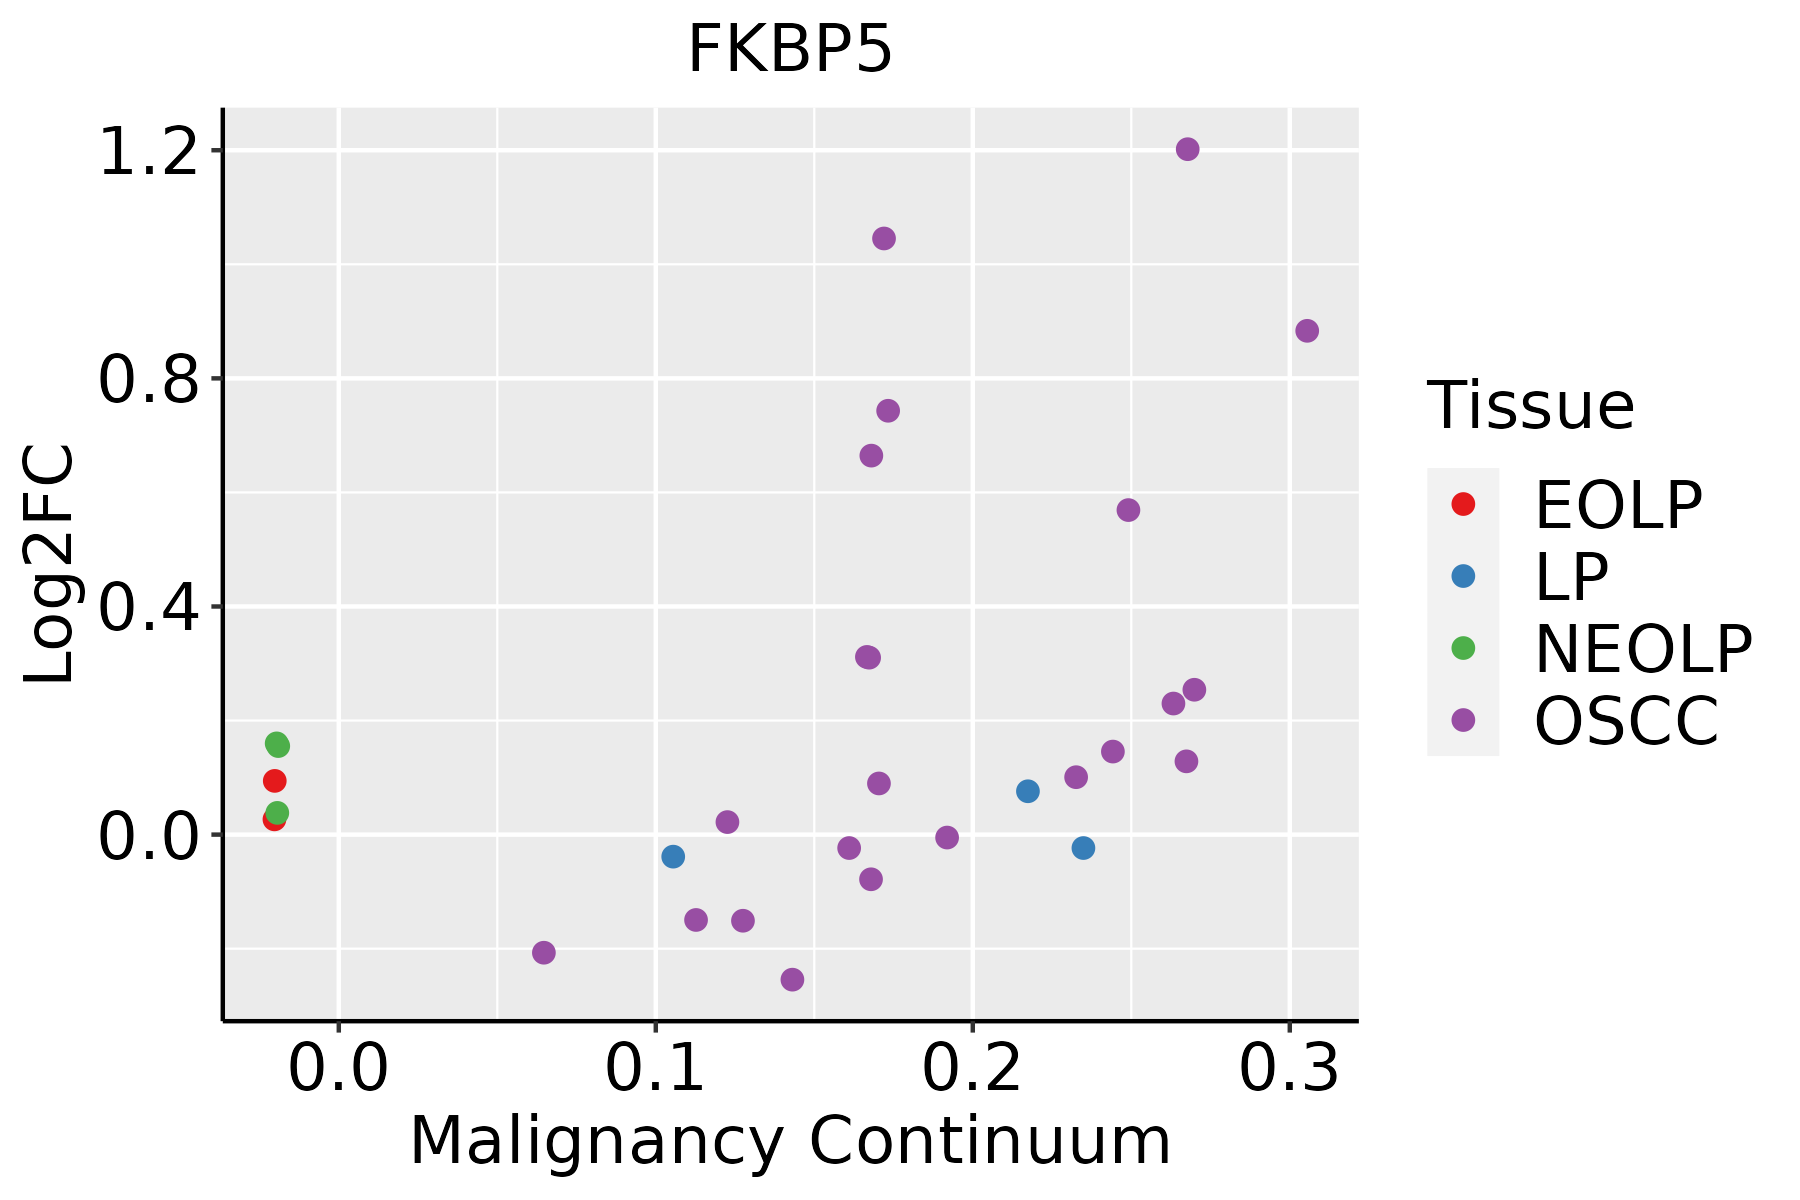 | EOLP: Erosive Oral lichen planus |
| LP: leukoplakia |
| NEOLP: Non-erosive oral lichen planus |
| OSCC: Oral squamous cell carcinoma |
| Prostate |  | BPH: Benign Prostatic Hyperplasia |
| Skin |  | AK: Actinic keratosis |
| cSCC: Cutaneous squamous cell carcinoma |
| SCCIS:squamous cell carcinoma in situ |
| Thyroid | 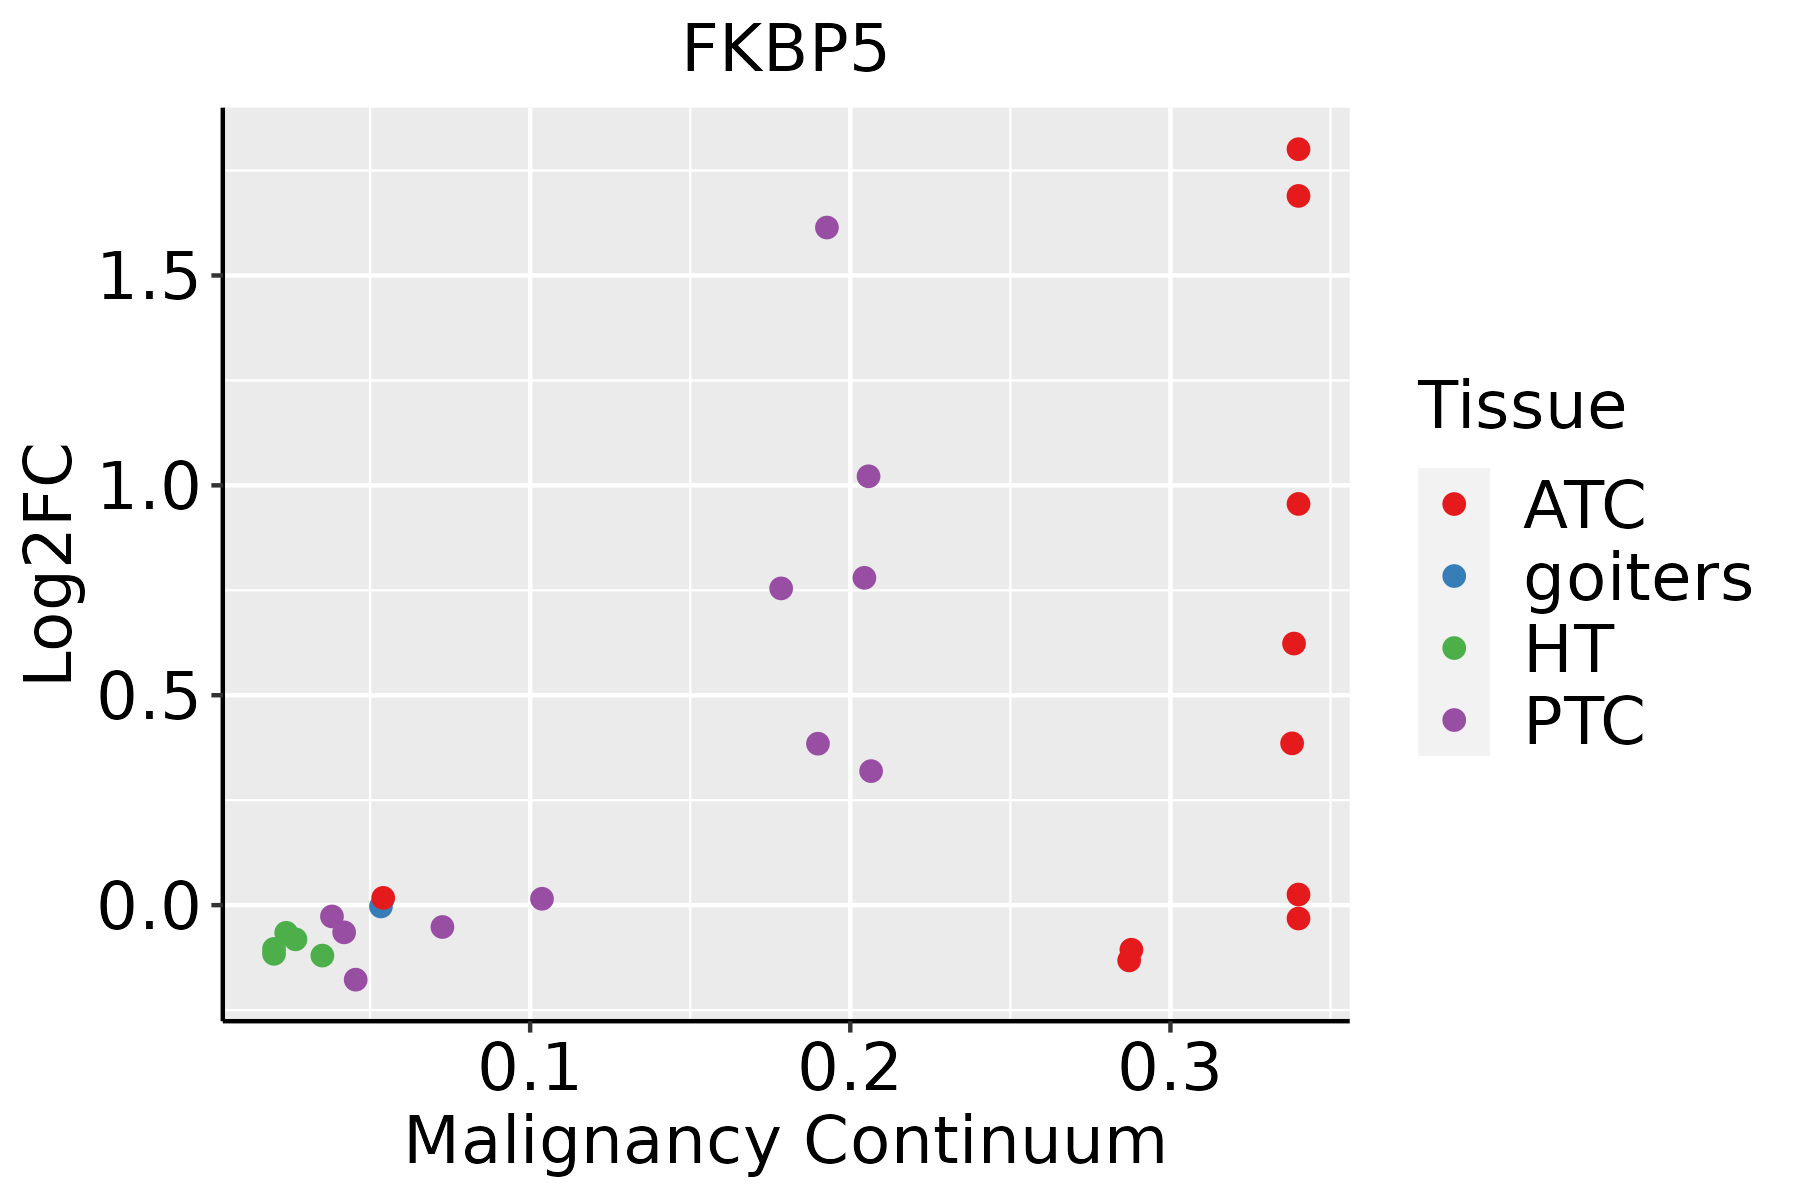 | ATC: Anaplastic thyroid cancer |
| HT: Hashimoto's thyroiditis |
| PTC: Papillary thyroid cancer |
| GO ID | Tissue | Disease Stage | Description | Gene Ratio | Bg Ratio | pvalue | p.adjust | Count |
| GO:000645713 | Breast | IDC | protein folding | 47/1434 | 212/18723 | 2.31e-11 | 3.86e-09 | 47 |
| GO:006107713 | Breast | IDC | chaperone-mediated protein folding | 21/1434 | 67/18723 | 1.35e-08 | 9.71e-07 | 21 |
| GO:001820812 | Breast | IDC | peptidyl-proline modification | 13/1434 | 58/18723 | 3.59e-04 | 5.18e-03 | 13 |
| GO:000645723 | Breast | DCIS | protein folding | 47/1390 | 212/18723 | 7.84e-12 | 1.53e-09 | 47 |
| GO:006107722 | Breast | DCIS | chaperone-mediated protein folding | 21/1390 | 67/18723 | 7.81e-09 | 6.22e-07 | 21 |
| GO:001820821 | Breast | DCIS | peptidyl-proline modification | 13/1390 | 58/18723 | 2.65e-04 | 4.03e-03 | 13 |
| GO:00610779 | Cervix | CC | chaperone-mediated protein folding | 21/2311 | 67/18723 | 3.40e-05 | 5.55e-04 | 21 |
| GO:00064579 | Cervix | CC | protein folding | 44/2311 | 212/18723 | 3.43e-04 | 3.59e-03 | 44 |
| GO:000645724 | Cervix | N_HPV | protein folding | 22/534 | 212/18723 | 1.90e-07 | 1.57e-05 | 22 |
| GO:006107723 | Cervix | N_HPV | chaperone-mediated protein folding | 12/534 | 67/18723 | 3.68e-07 | 2.54e-05 | 12 |
| GO:0006457 | Colorectum | AD | protein folding | 73/3918 | 212/18723 | 3.24e-06 | 9.10e-05 | 73 |
| GO:0061077 | Colorectum | AD | chaperone-mediated protein folding | 26/3918 | 67/18723 | 6.20e-04 | 6.48e-03 | 26 |
| GO:00064571 | Colorectum | SER | protein folding | 54/2897 | 212/18723 | 1.04e-04 | 2.18e-03 | 54 |
| GO:00610771 | Colorectum | SER | chaperone-mediated protein folding | 21/2897 | 67/18723 | 8.44e-04 | 1.04e-02 | 21 |
| GO:00064572 | Colorectum | MSS | protein folding | 71/3467 | 212/18723 | 1.25e-07 | 5.91e-06 | 71 |
| GO:00610772 | Colorectum | MSS | chaperone-mediated protein folding | 26/3467 | 67/18723 | 8.06e-05 | 1.33e-03 | 26 |
| GO:00064574 | Colorectum | FAP | protein folding | 44/2622 | 212/18723 | 4.36e-03 | 2.98e-02 | 44 |
| GO:000645710 | Endometrium | AEH | protein folding | 61/2100 | 212/18723 | 1.86e-12 | 3.48e-10 | 61 |
| GO:006107710 | Endometrium | AEH | chaperone-mediated protein folding | 23/2100 | 67/18723 | 4.82e-07 | 1.94e-05 | 23 |
| GO:00004133 | Endometrium | AEH | protein peptidyl-prolyl isomerization | 13/2100 | 42/18723 | 4.74e-04 | 4.91e-03 | 13 |
| Pathway ID | Tissue | Disease Stage | Description | Gene Ratio | Bg Ratio | pvalue | p.adjust | qvalue | Count |
| hsa0491523 | Breast | IDC | Estrogen signaling pathway | 35/867 | 138/8465 | 2.55e-07 | 5.18e-06 | 3.88e-06 | 35 |
| hsa0491533 | Breast | IDC | Estrogen signaling pathway | 35/867 | 138/8465 | 2.55e-07 | 5.18e-06 | 3.88e-06 | 35 |
| hsa0491542 | Breast | DCIS | Estrogen signaling pathway | 35/846 | 138/8465 | 1.40e-07 | 2.51e-06 | 1.85e-06 | 35 |
| hsa0491552 | Breast | DCIS | Estrogen signaling pathway | 35/846 | 138/8465 | 1.40e-07 | 2.51e-06 | 1.85e-06 | 35 |
| hsa0491520 | Cervix | CC | Estrogen signaling pathway | 44/1267 | 138/8465 | 3.55e-07 | 3.97e-06 | 2.35e-06 | 44 |
| hsa04915110 | Cervix | CC | Estrogen signaling pathway | 44/1267 | 138/8465 | 3.55e-07 | 3.97e-06 | 2.35e-06 | 44 |
| hsa0491543 | Cervix | N_HPV | Estrogen signaling pathway | 16/349 | 138/8465 | 1.68e-04 | 1.53e-03 | 1.19e-03 | 16 |
| hsa0491553 | Cervix | N_HPV | Estrogen signaling pathway | 16/349 | 138/8465 | 1.68e-04 | 1.53e-03 | 1.19e-03 | 16 |
| hsa04915 | Colorectum | SER | Estrogen signaling pathway | 38/1580 | 138/8465 | 6.51e-03 | 3.68e-02 | 2.67e-02 | 38 |
| hsa049151 | Colorectum | SER | Estrogen signaling pathway | 38/1580 | 138/8465 | 6.51e-03 | 3.68e-02 | 2.67e-02 | 38 |
| hsa049152 | Colorectum | MSS | Estrogen signaling pathway | 48/1875 | 138/8465 | 4.23e-04 | 3.08e-03 | 1.89e-03 | 48 |
| hsa049153 | Colorectum | MSS | Estrogen signaling pathway | 48/1875 | 138/8465 | 4.23e-04 | 3.08e-03 | 1.89e-03 | 48 |
| hsa049154 | Colorectum | CRC | Estrogen signaling pathway | 29/1091 | 138/8465 | 4.83e-03 | 2.66e-02 | 1.80e-02 | 29 |
| hsa049155 | Colorectum | CRC | Estrogen signaling pathway | 29/1091 | 138/8465 | 4.83e-03 | 2.66e-02 | 1.80e-02 | 29 |
| hsa0491525 | Endometrium | AEH | Estrogen signaling pathway | 35/1197 | 138/8465 | 3.10e-04 | 2.40e-03 | 1.75e-03 | 35 |
| hsa04915111 | Endometrium | AEH | Estrogen signaling pathway | 35/1197 | 138/8465 | 3.10e-04 | 2.40e-03 | 1.75e-03 | 35 |
| hsa0491514 | Liver | Cyst | Estrogen signaling pathway | 16/339 | 138/8465 | 1.20e-04 | 1.57e-03 | 1.30e-03 | 16 |
| hsa0491515 | Liver | Cyst | Estrogen signaling pathway | 16/339 | 138/8465 | 1.20e-04 | 1.57e-03 | 1.30e-03 | 16 |
| hsa0491529 | Oral cavity | EOLP | Estrogen signaling pathway | 38/1218 | 138/8465 | 3.78e-05 | 1.82e-04 | 1.07e-04 | 38 |
| hsa04915113 | Oral cavity | EOLP | Estrogen signaling pathway | 38/1218 | 138/8465 | 3.78e-05 | 1.82e-04 | 1.07e-04 | 38 |
| Hugo Symbol | Variant Class | Variant Classification | dbSNP RS | HGVSc | HGVSp | HGVSp Short | SWISSPROT | BIOTYPE | SIFT | PolyPhen | Tumor Sample Barcode | Tissue | Histology | Sex | Age | Stage | Therapy Types | Drugs | Outcome |
| FKBP5 | SNV | Missense_Mutation | | c.1303G>C | p.Glu435Gln | p.E435Q | Q13451 | protein_coding | tolerated(0.11) | benign(0.007) | TCGA-AC-A23H-01 | Breast | breast invasive carcinoma | Female | >=65 | I/II | Unknown | Unknown | PD |
| FKBP5 | SNV | Missense_Mutation | | c.728N>G | p.Tyr243Cys | p.Y243C | Q13451 | protein_coding | deleterious(0) | probably_damaging(1) | TCGA-AN-A0AK-01 | Breast | breast invasive carcinoma | Female | >=65 | I/II | Unknown | Unknown | SD |
| FKBP5 | SNV | Missense_Mutation | novel | c.1142A>G | p.Asn381Ser | p.N381S | Q13451 | protein_coding | tolerated(0.34) | possibly_damaging(0.685) | TCGA-B6-A402-01 | Breast | breast invasive carcinoma | Female | <65 | I/II | Chemotherapy | cyclophosphamide | PD |
| FKBP5 | insertion | Nonsense_Mutation | novel | c.24_25insTTAACCTCTCTGTGATTAAGTTCCTGTTTGTAAAATTAGAATAAT | p.Lys8_Asn9insLeuThrSerLeuTerLeuSerSerCysLeuTerAsnTerAsnAsn | p.K8_N9insLTSL*LSSCL*N*NN | Q13451 | protein_coding | | | TCGA-A8-A06X-01 | Breast | breast invasive carcinoma | Female | >=65 | I/II | Unknown | Unknown | SD |
| FKBP5 | SNV | Missense_Mutation | rs200334349 | c.119T>C | p.Val40Ala | p.V40A | Q13451 | protein_coding | tolerated(0.34) | benign(0) | TCGA-2W-A8YY-01 | Cervix | cervical & endocervical cancer | Female | <65 | I/II | Chemotherapy | cisplatin | CR |
| FKBP5 | SNV | Missense_Mutation | | c.391G>C | p.Glu131Gln | p.E131Q | Q13451 | protein_coding | tolerated(0.06) | possibly_damaging(0.55) | TCGA-DR-A0ZM-01 | Cervix | cervical & endocervical cancer | Female | <65 | III/IV | Unspecific | Cisplatin | SD |
| FKBP5 | SNV | Missense_Mutation | rs759431987 | c.1216N>T | p.Arg406Cys | p.R406C | Q13451 | protein_coding | deleterious(0) | possibly_damaging(0.74) | TCGA-MA-AA3Y-01 | Cervix | cervical & endocervical cancer | Female | <65 | I/II | Unknown | Unknown | SD |
| FKBP5 | SNV | Missense_Mutation | | c.346N>A | p.Ala116Thr | p.A116T | Q13451 | protein_coding | tolerated(0.15) | benign(0.003) | TCGA-AD-6889-01 | Colorectum | colon adenocarcinoma | Male | >=65 | I/II | Chemotherapy | xeloda | PD |
| FKBP5 | SNV | Missense_Mutation | novel | c.366N>G | p.Ile122Met | p.I122M | Q13451 | protein_coding | deleterious(0) | possibly_damaging(0.904) | TCGA-AG-A002-01 | Colorectum | rectum adenocarcinoma | Male | <65 | I/II | Unknown | Unknown | SD |
| FKBP5 | SNV | Missense_Mutation | novel | c.695A>C | p.Lys232Thr | p.K232T | Q13451 | protein_coding | deleterious(0.04) | benign(0.081) | TCGA-F5-6814-01 | Colorectum | rectum adenocarcinoma | Male | <65 | I/II | Unknown | Unknown | SD |
| Entrez ID | Symbol | Category | Interaction Types | Drug Claim Name | Drug Name | PMIDs |
| 2289 | FKBP5 | DRUGGABLE GENOME | | escitalopram | ESCITALOPRAM | |
| 2289 | FKBP5 | DRUGGABLE GENOME | | gemcitabine | GEMCITABINE | 23936393 |
| 2289 | FKBP5 | DRUGGABLE GENOME | | citalopram | CITALOPRAM | 18597649,21449676,20709156,19676097,15565110,23733030,17467808 |
| 2289 | FKBP5 | DRUGGABLE GENOME | | clozapine | CLOZAPINE | 25751398 |
| 2289 | FKBP5 | DRUGGABLE GENOME | | paroxetine | PAROXETINE | 18597649,21449676,20709156,19676097,15565110,23733030,17467808 |
| 2289 | FKBP5 | DRUGGABLE GENOME | | corticosteroids | | 21788965 |
| 2289 | FKBP5 | DRUGGABLE GENOME | | fluoxetine | FLUOXETINE | 20709156,15565110 |
| 2289 | FKBP5 | DRUGGABLE GENOME | | bupropion | BUPROPION | 22947179 |
| 2289 | FKBP5 | DRUGGABLE GENOME | | nefazodone | NEFAZODONE | 18597649,21449676,20709156,19676097,15565110,23733030,17467808 |
| 2289 | FKBP5 | DRUGGABLE GENOME | | antidepressants | | 18597649,21449676,20709156,19676097,15565110,23733030,17467808 |


