| Tissue | Expression Dynamics | Abbreviation |
| Cervix | 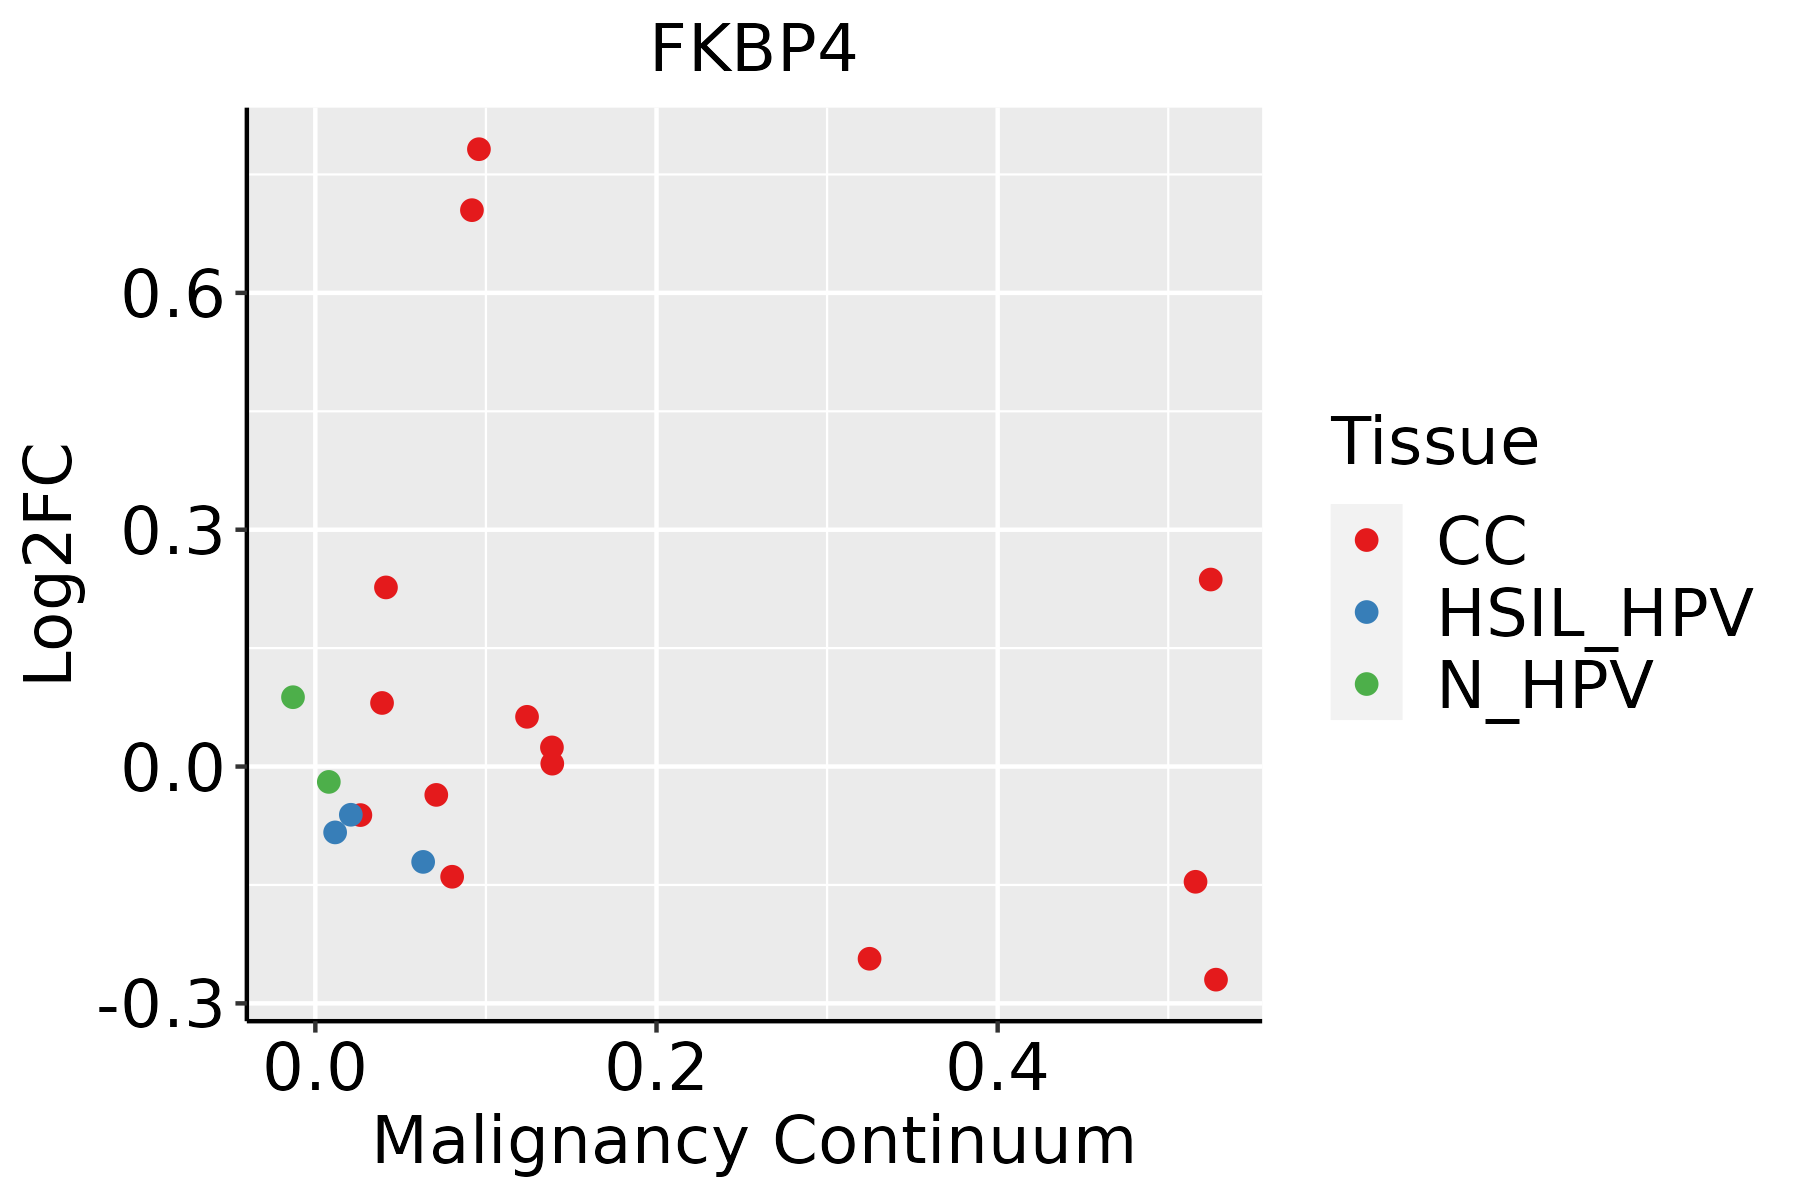 | CC: Cervix cancer |
| HSIL_HPV: HPV-infected high-grade squamous intraepithelial lesions |
| N_HPV: HPV-infected normal cervix |
| Colorectum (GSE201348) |  | FAP: Familial adenomatous polyposis |
| CRC: Colorectal cancer |
| Colorectum (HTA11) |  | AD: Adenomas |
| SER: Sessile serrated lesions |
| MSI-H: Microsatellite-high colorectal cancer |
| MSS: Microsatellite stable colorectal cancer |
| Esophagus |  | ESCC: Esophageal squamous cell carcinoma |
| HGIN: High-grade intraepithelial neoplasias |
| LGIN: Low-grade intraepithelial neoplasias |
| GC | 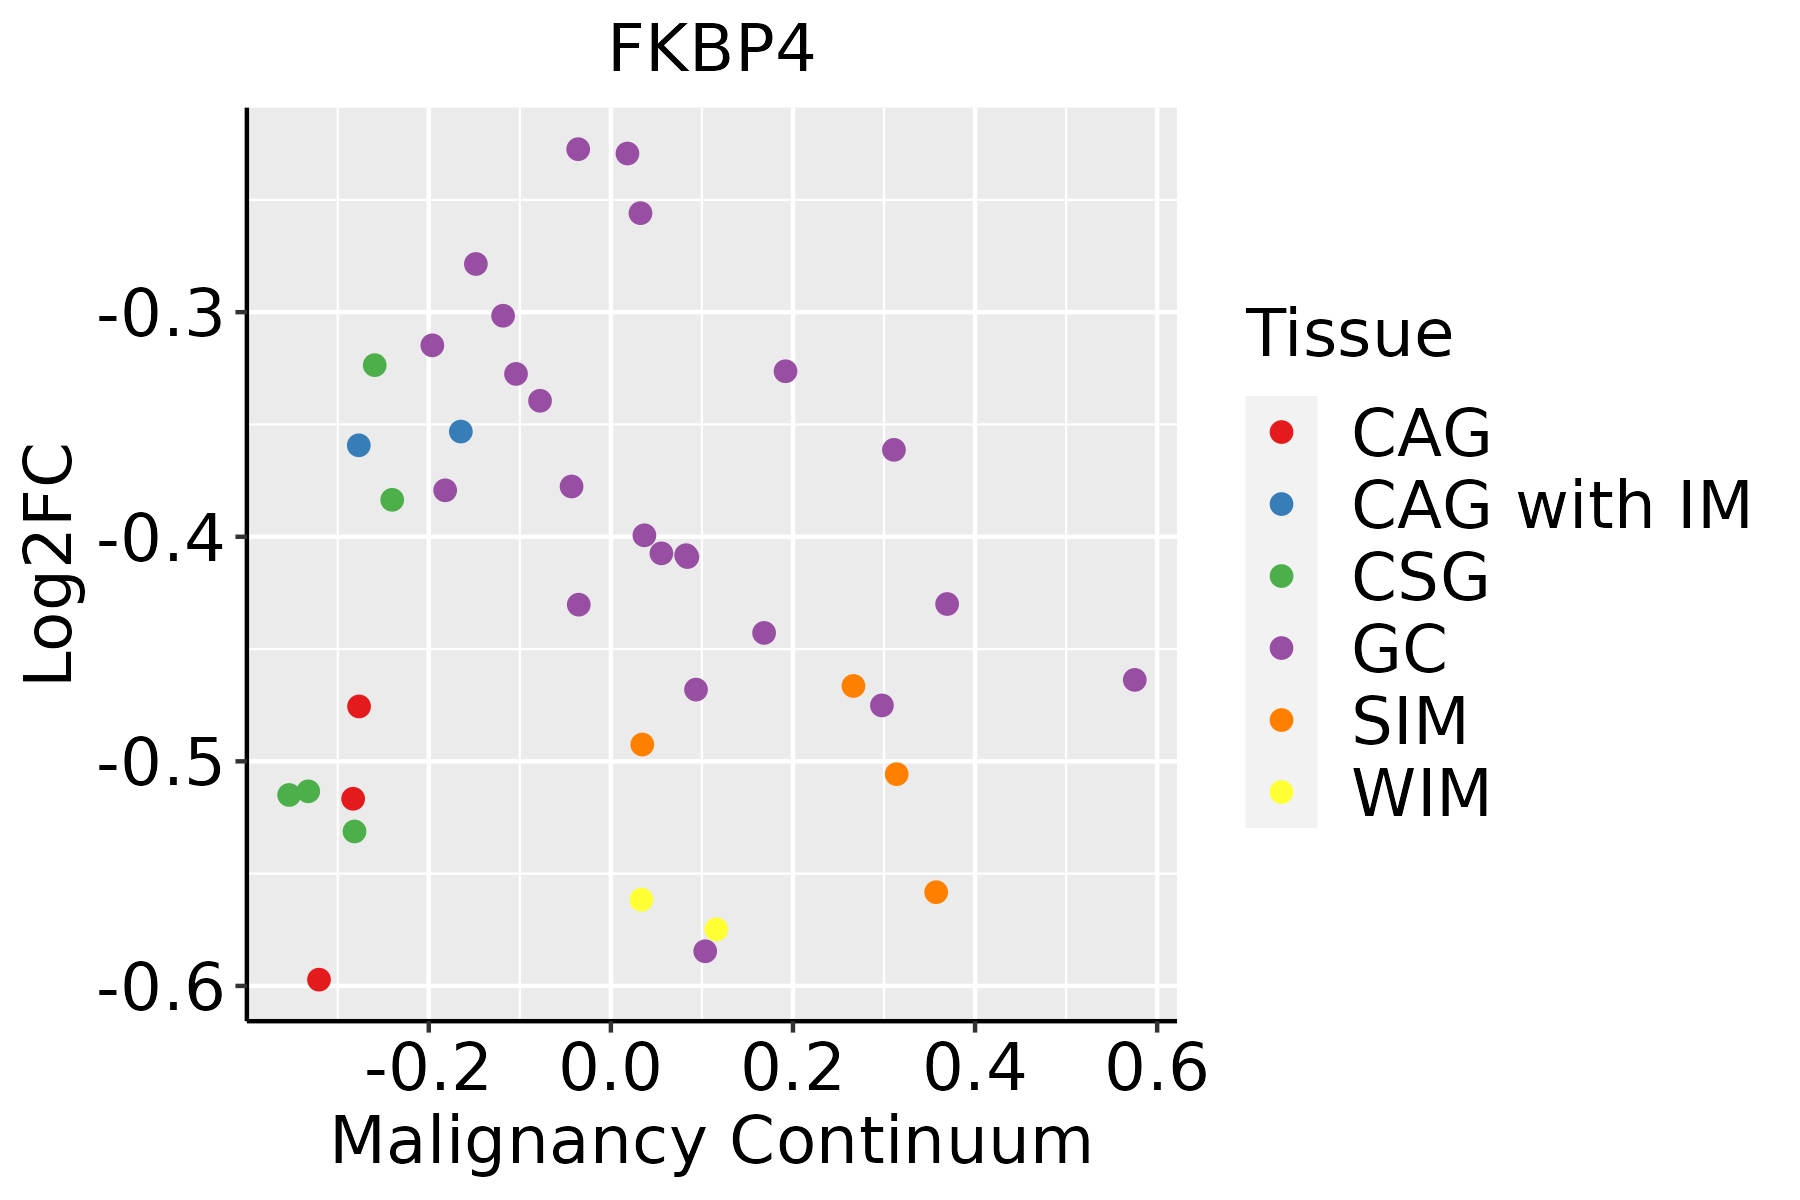 | CAG: Chronic atrophic gastritis |
| CAG with IM: Chronic atrophic gastritis with intestinal metaplasia |
| CSG: Chronic superficial gastritis |
| GC: Gastric cancer |
| SIM: Severe intestinal metaplasia |
| WIM: Wild intestinal metaplasia |
| Liver |  | HCC: Hepatocellular carcinoma |
| NAFLD: Non-alcoholic fatty liver disease |
| Oral Cavity | 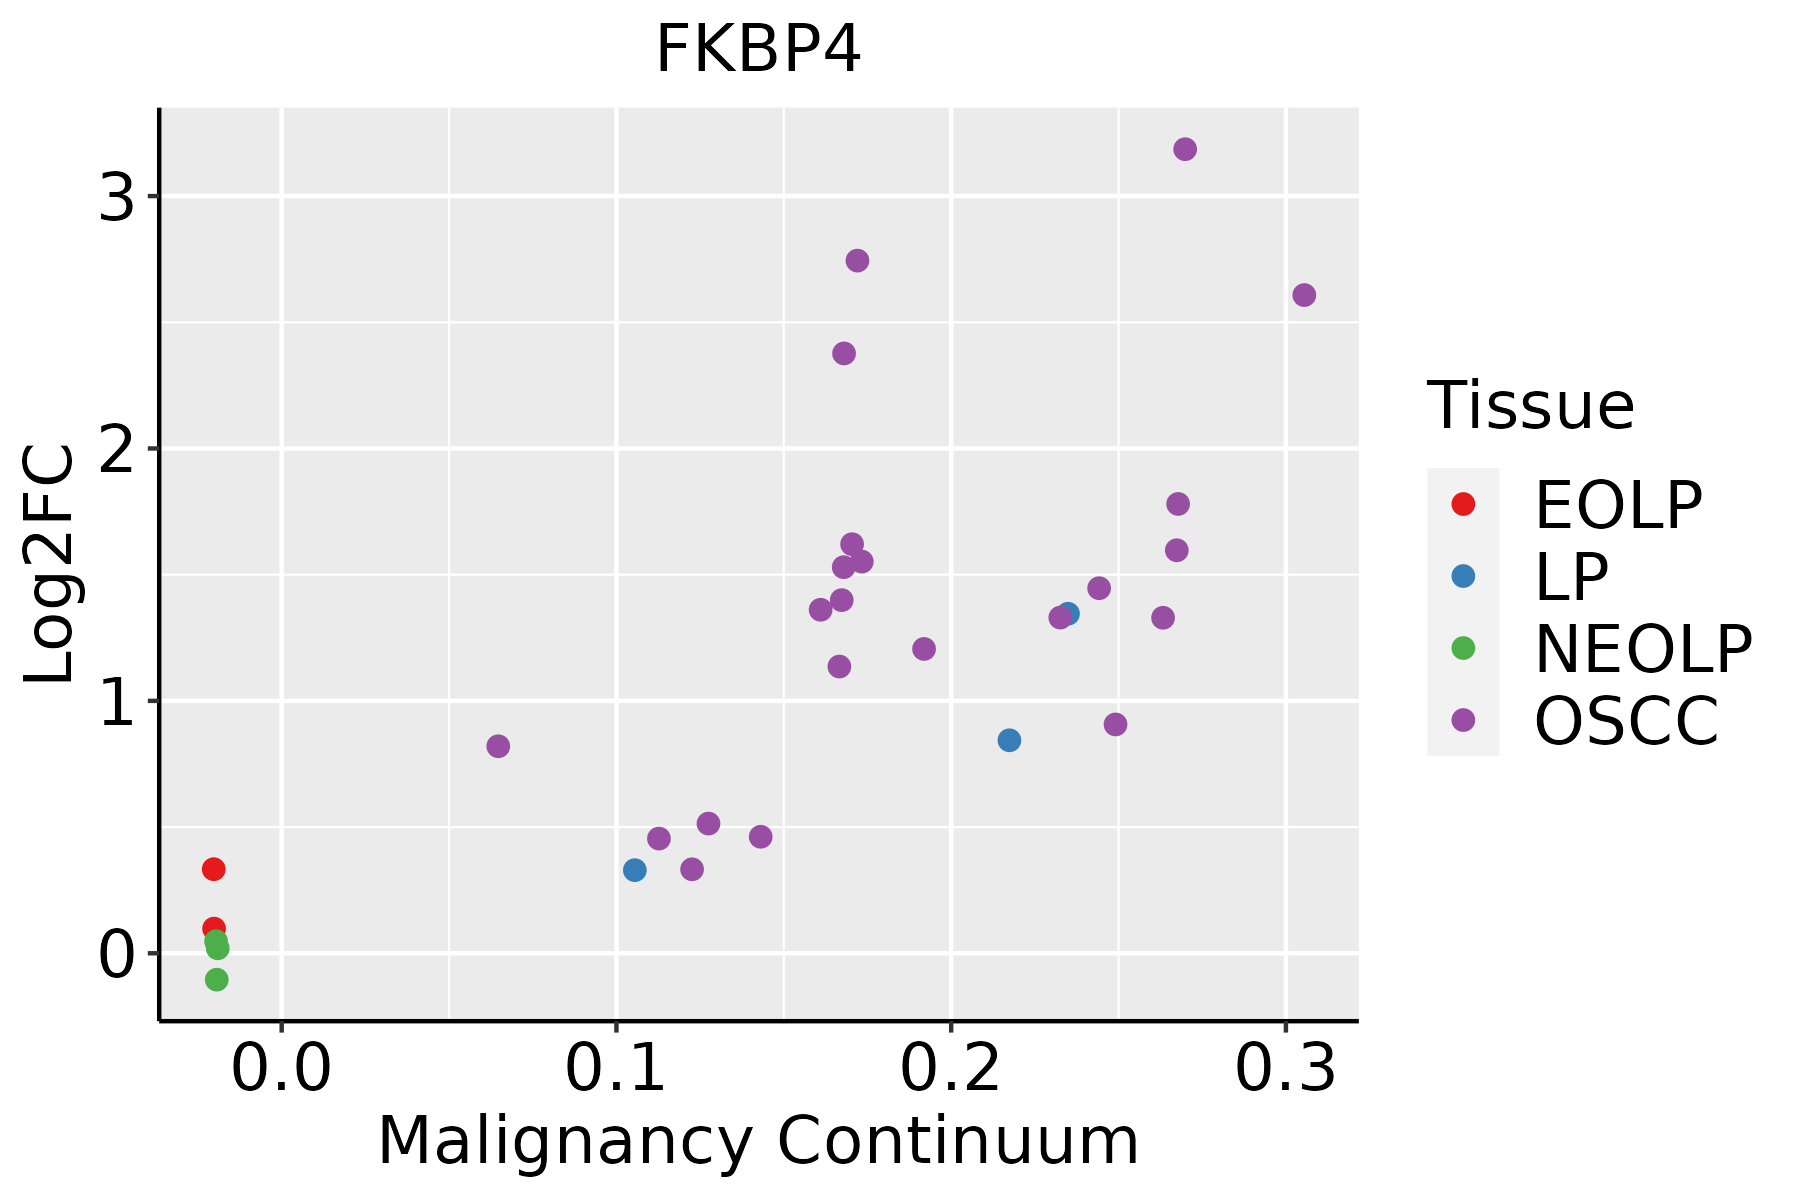 | EOLP: Erosive Oral lichen planus |
| LP: leukoplakia |
| NEOLP: Non-erosive oral lichen planus |
| OSCC: Oral squamous cell carcinoma |
| Prostate | 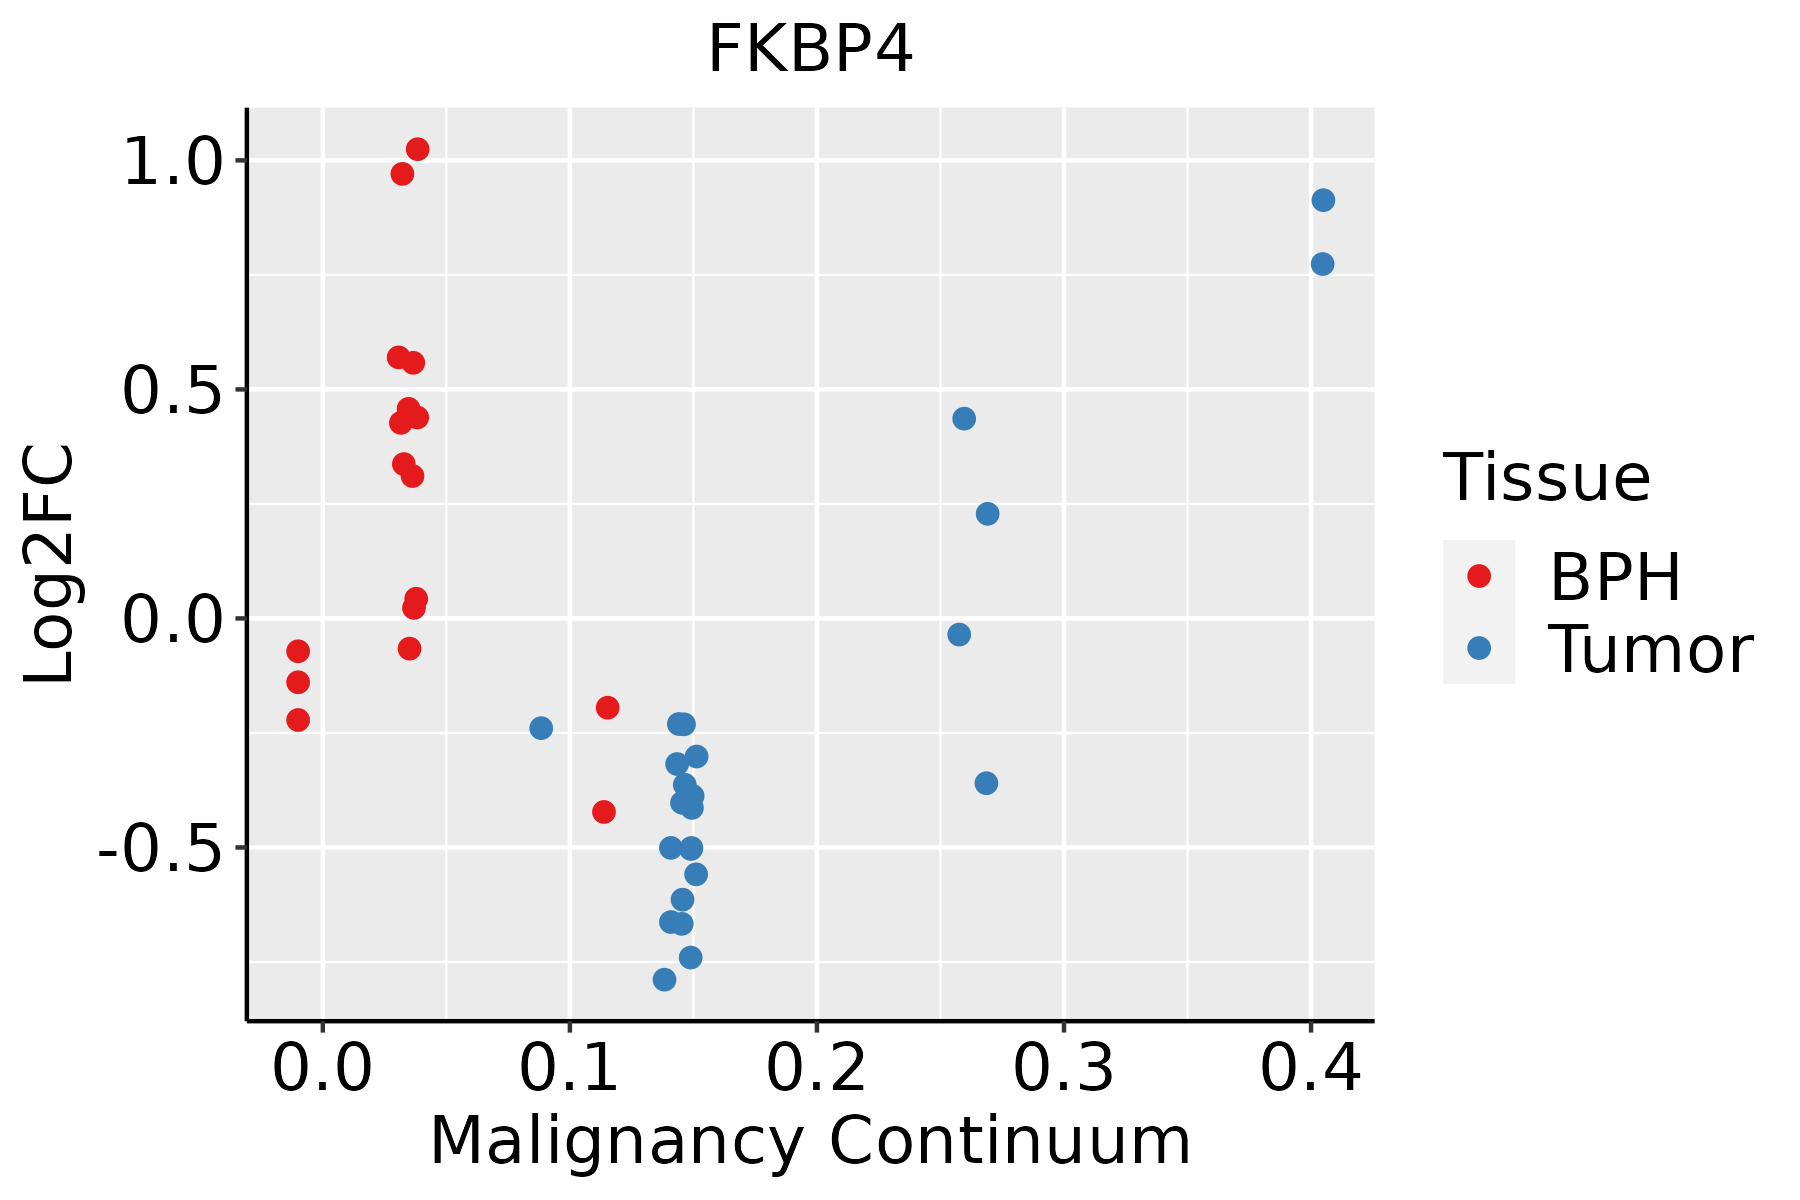 | BPH: Benign Prostatic Hyperplasia |
| Skin | 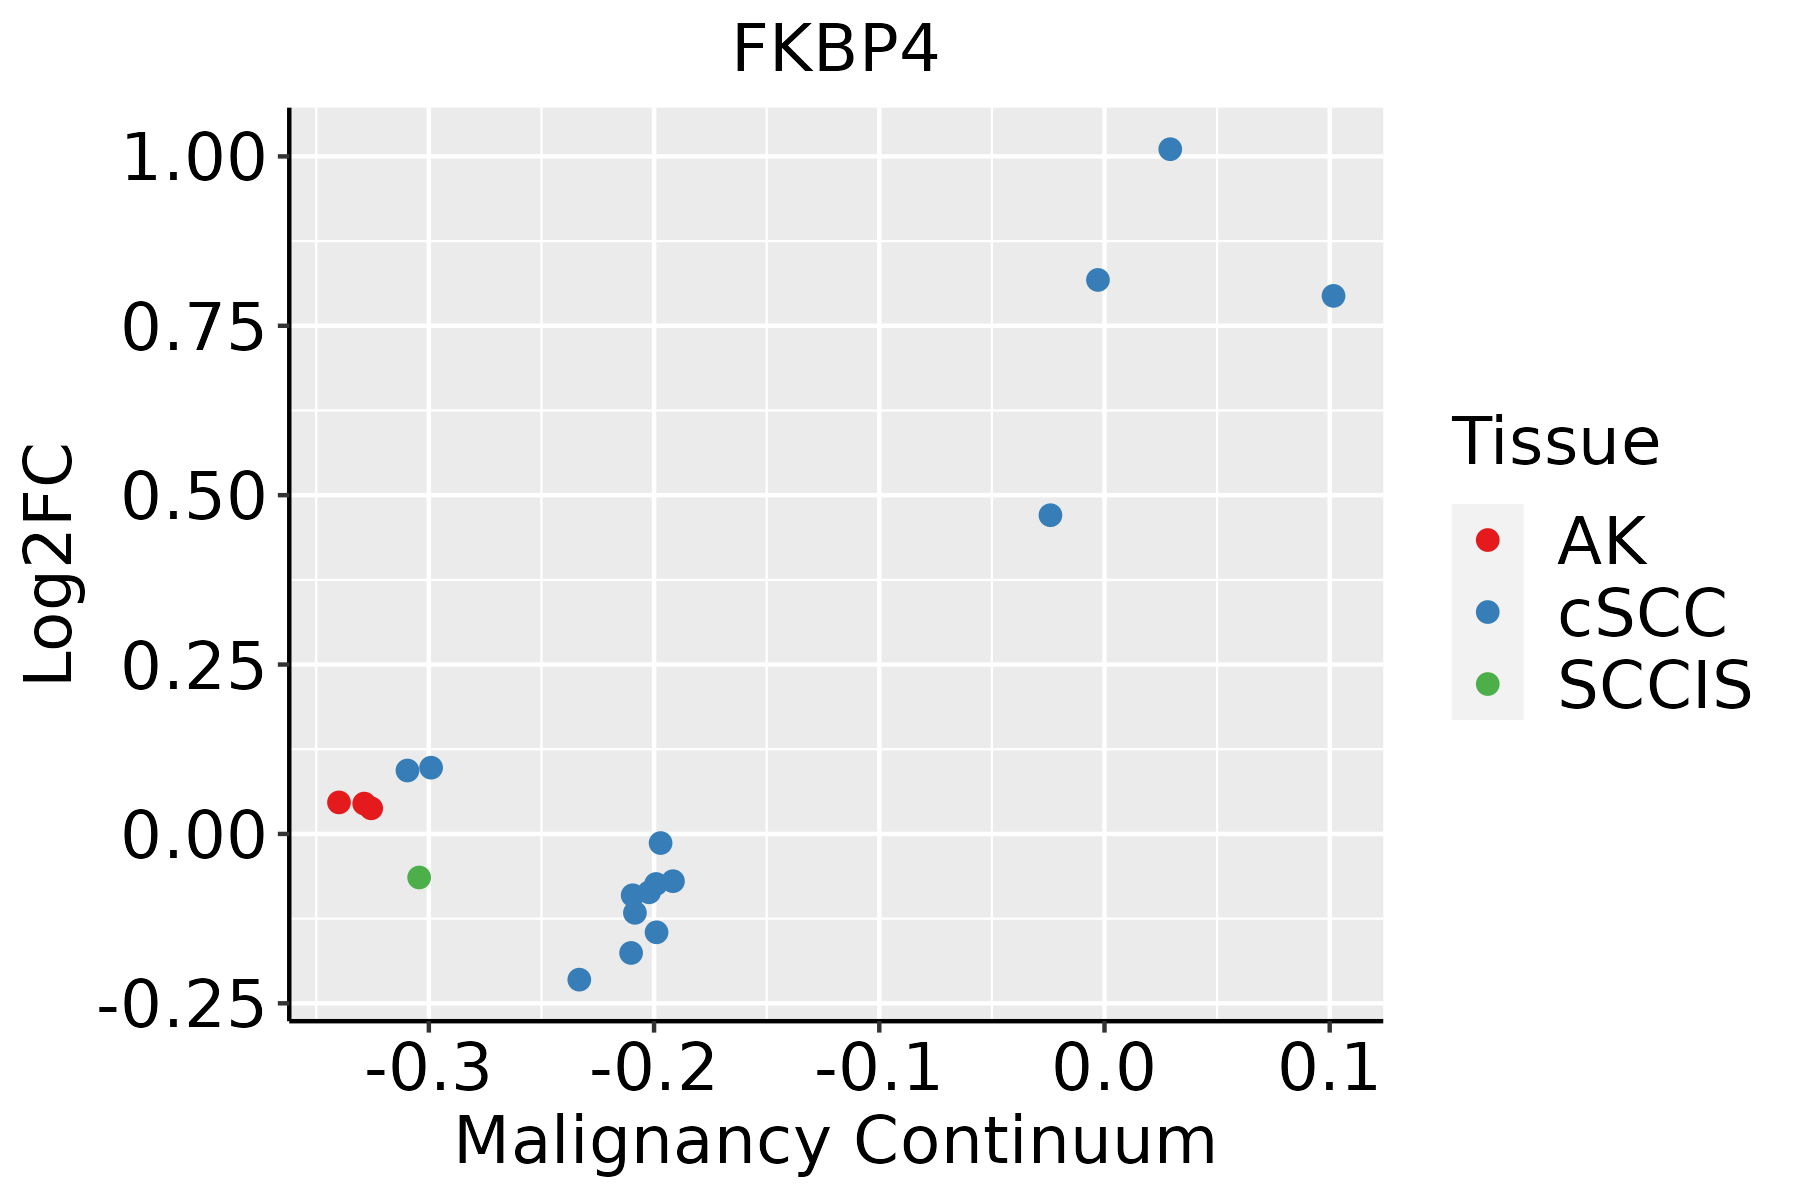 | AK: Actinic keratosis |
| cSCC: Cutaneous squamous cell carcinoma |
| SCCIS:squamous cell carcinoma in situ |
| Thyroid | 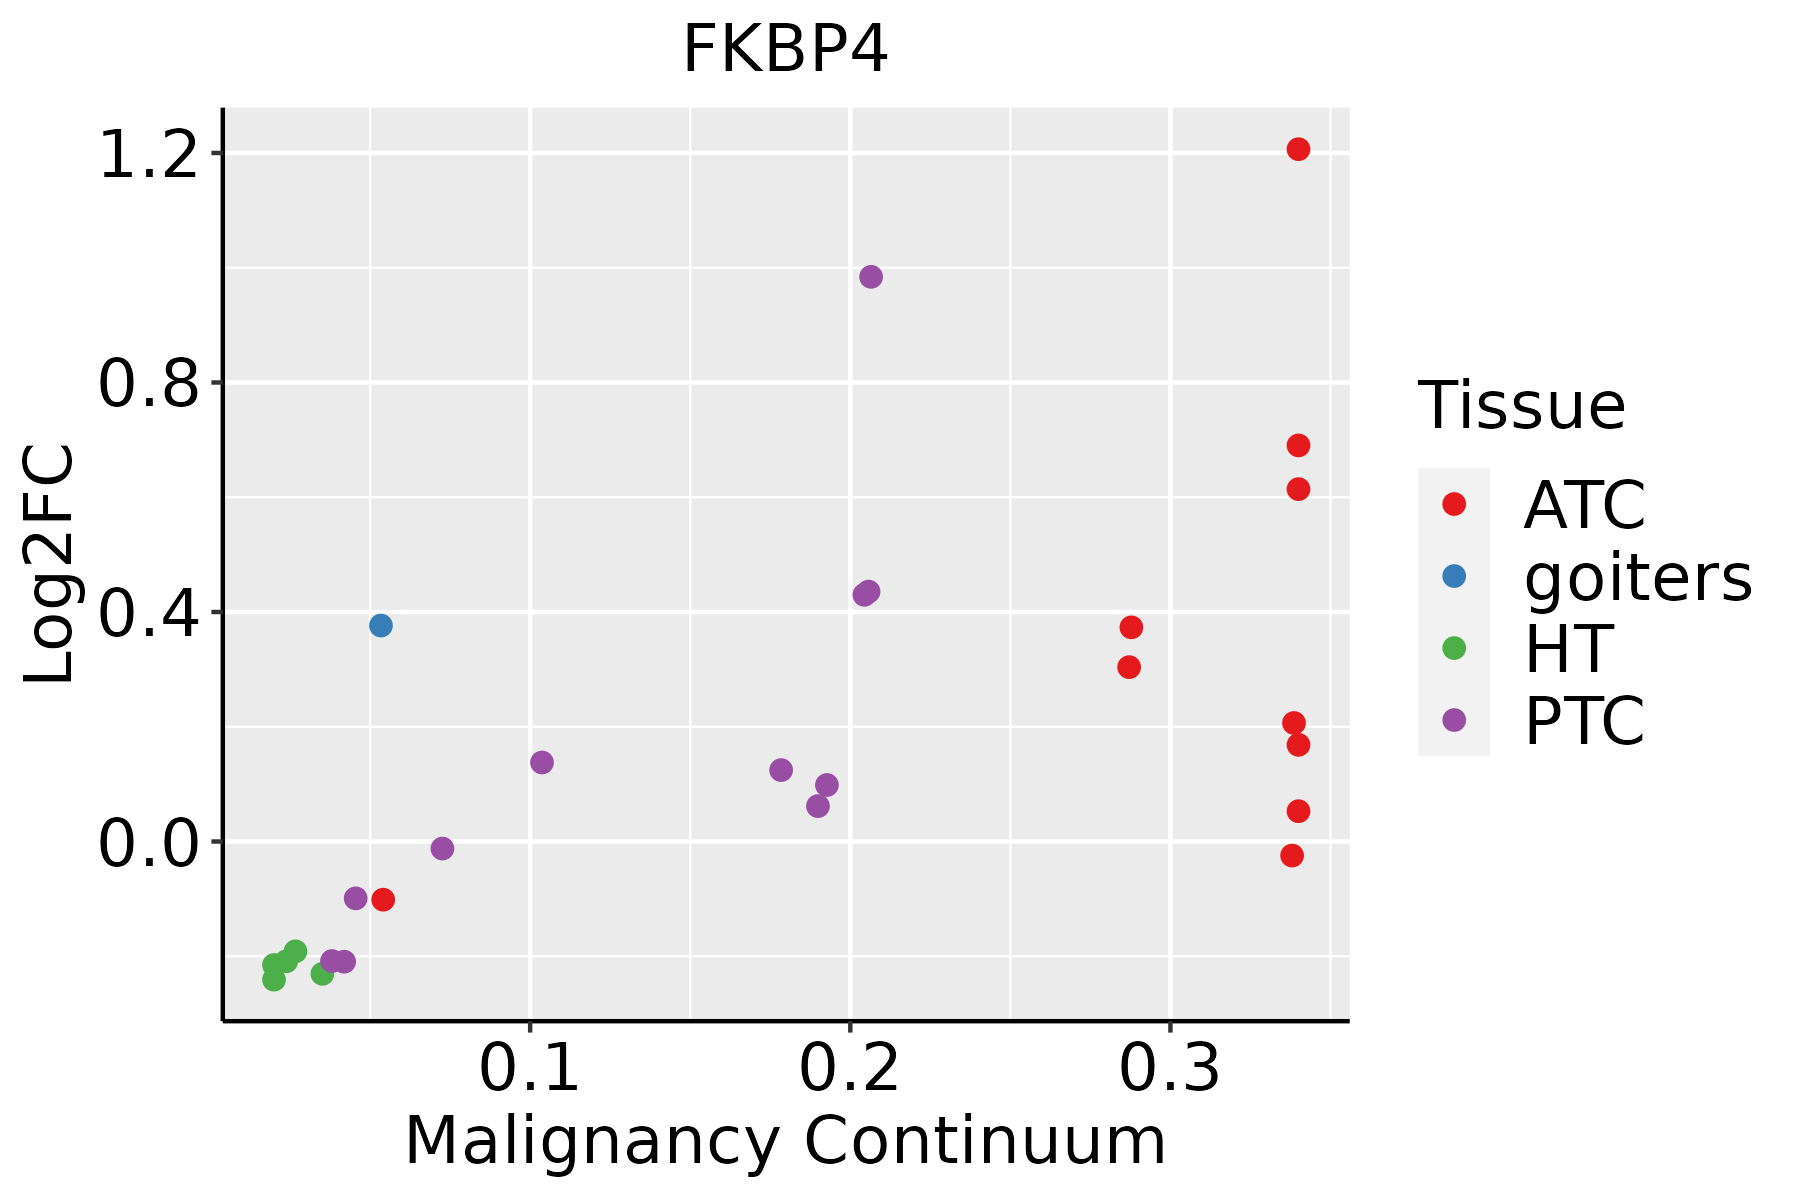 | ATC: Anaplastic thyroid cancer |
| HT: Hashimoto's thyroiditis |
| PTC: Papillary thyroid cancer |
| GO ID | Tissue | Disease Stage | Description | Gene Ratio | Bg Ratio | pvalue | p.adjust | Count |
| GO:190290310 | Cervix | CC | regulation of supramolecular fiber organization | 92/2311 | 383/18723 | 1.49e-10 | 2.48e-08 | 92 |
| GO:004325410 | Cervix | CC | regulation of protein-containing complex assembly | 96/2311 | 428/18723 | 2.91e-09 | 3.05e-07 | 96 |
| GO:005125810 | Cervix | CC | protein polymerization | 70/2311 | 297/18723 | 5.20e-08 | 3.11e-06 | 70 |
| GO:003227110 | Cervix | CC | regulation of protein polymerization | 57/2311 | 233/18723 | 2.37e-07 | 1.03e-05 | 57 |
| GO:00109757 | Cervix | CC | regulation of neuron projection development | 88/2311 | 445/18723 | 4.26e-06 | 1.09e-04 | 88 |
| GO:19029048 | Cervix | CC | negative regulation of supramolecular fiber organization | 40/2311 | 167/18723 | 2.39e-05 | 4.17e-04 | 40 |
| GO:00610779 | Cervix | CC | chaperone-mediated protein folding | 21/2311 | 67/18723 | 3.40e-05 | 5.55e-04 | 21 |
| GO:00313339 | Cervix | CC | negative regulation of protein-containing complex assembly | 35/2311 | 141/18723 | 3.41e-05 | 5.55e-04 | 35 |
| GO:00106399 | Cervix | CC | negative regulation of organelle organization | 68/2311 | 348/18723 | 7.40e-05 | 1.03e-03 | 68 |
| GO:00514948 | Cervix | CC | negative regulation of cytoskeleton organization | 37/2311 | 163/18723 | 1.57e-04 | 1.88e-03 | 37 |
| GO:00064579 | Cervix | CC | protein folding | 44/2311 | 212/18723 | 3.43e-04 | 3.59e-03 | 44 |
| GO:00313456 | Cervix | CC | negative regulation of cell projection organization | 39/2311 | 186/18723 | 5.86e-04 | 5.57e-03 | 39 |
| GO:00705074 | Cervix | CC | regulation of microtubule cytoskeleton organization | 32/2311 | 148/18723 | 1.02e-03 | 8.51e-03 | 32 |
| GO:00322728 | Cervix | CC | negative regulation of protein polymerization | 20/2311 | 80/18723 | 1.40e-03 | 1.10e-02 | 20 |
| GO:00311134 | Cervix | CC | regulation of microtubule polymerization | 15/2311 | 55/18723 | 2.14e-03 | 1.54e-02 | 15 |
| GO:00109775 | Cervix | CC | negative regulation of neuron projection development | 28/2311 | 137/18723 | 4.74e-03 | 2.83e-02 | 28 |
| GO:00467853 | Cervix | CC | microtubule polymerization | 19/2311 | 83/18723 | 5.25e-03 | 3.08e-02 | 19 |
| GO:0031111 | Cervix | CC | negative regulation of microtubule polymerization or depolymerization | 11/2311 | 40/18723 | 7.54e-03 | 4.02e-02 | 11 |
| GO:00311101 | Cervix | CC | regulation of microtubule polymerization or depolymerization | 19/2311 | 88/18723 | 1.01e-02 | 4.91e-02 | 19 |
| GO:1902903 | Colorectum | AD | regulation of supramolecular fiber organization | 139/3918 | 383/18723 | 2.01e-12 | 3.19e-10 | 139 |
| Pathway ID | Tissue | Disease Stage | Description | Gene Ratio | Bg Ratio | pvalue | p.adjust | qvalue | Count |
| hsa0491520 | Cervix | CC | Estrogen signaling pathway | 44/1267 | 138/8465 | 3.55e-07 | 3.97e-06 | 2.35e-06 | 44 |
| hsa04915110 | Cervix | CC | Estrogen signaling pathway | 44/1267 | 138/8465 | 3.55e-07 | 3.97e-06 | 2.35e-06 | 44 |
| hsa04915 | Colorectum | SER | Estrogen signaling pathway | 38/1580 | 138/8465 | 6.51e-03 | 3.68e-02 | 2.67e-02 | 38 |
| hsa049151 | Colorectum | SER | Estrogen signaling pathway | 38/1580 | 138/8465 | 6.51e-03 | 3.68e-02 | 2.67e-02 | 38 |
| hsa049152 | Colorectum | MSS | Estrogen signaling pathway | 48/1875 | 138/8465 | 4.23e-04 | 3.08e-03 | 1.89e-03 | 48 |
| hsa049153 | Colorectum | MSS | Estrogen signaling pathway | 48/1875 | 138/8465 | 4.23e-04 | 3.08e-03 | 1.89e-03 | 48 |
| hsa049154 | Colorectum | CRC | Estrogen signaling pathway | 29/1091 | 138/8465 | 4.83e-03 | 2.66e-02 | 1.80e-02 | 29 |
| hsa049155 | Colorectum | CRC | Estrogen signaling pathway | 29/1091 | 138/8465 | 4.83e-03 | 2.66e-02 | 1.80e-02 | 29 |
| hsa0491529 | Oral cavity | EOLP | Estrogen signaling pathway | 38/1218 | 138/8465 | 3.78e-05 | 1.82e-04 | 1.07e-04 | 38 |
| hsa04915113 | Oral cavity | EOLP | Estrogen signaling pathway | 38/1218 | 138/8465 | 3.78e-05 | 1.82e-04 | 1.07e-04 | 38 |
| hsa0491527 | Prostate | BPH | Estrogen signaling pathway | 48/1718 | 138/8465 | 4.60e-05 | 3.16e-04 | 1.96e-04 | 48 |
| hsa04915112 | Prostate | BPH | Estrogen signaling pathway | 48/1718 | 138/8465 | 4.60e-05 | 3.16e-04 | 1.96e-04 | 48 |
| hsa0491528 | Prostate | Tumor | Estrogen signaling pathway | 48/1791 | 138/8465 | 1.36e-04 | 8.33e-04 | 5.17e-04 | 48 |
| hsa0491536 | Prostate | Tumor | Estrogen signaling pathway | 48/1791 | 138/8465 | 1.36e-04 | 8.33e-04 | 5.17e-04 | 48 |
| hsa0491512 | Stomach | GC | Estrogen signaling pathway | 23/708 | 138/8465 | 1.02e-03 | 7.44e-03 | 5.23e-03 | 23 |
| hsa0491513 | Stomach | GC | Estrogen signaling pathway | 23/708 | 138/8465 | 1.02e-03 | 7.44e-03 | 5.23e-03 | 23 |
| hsa0491521 | Stomach | CAG with IM | Estrogen signaling pathway | 21/640 | 138/8465 | 1.53e-03 | 1.01e-02 | 7.10e-03 | 21 |
| hsa0491531 | Stomach | CAG with IM | Estrogen signaling pathway | 21/640 | 138/8465 | 1.53e-03 | 1.01e-02 | 7.10e-03 | 21 |
| hsa0491541 | Stomach | CSG | Estrogen signaling pathway | 20/633 | 138/8465 | 3.10e-03 | 1.88e-02 | 1.35e-02 | 20 |
| hsa0491551 | Stomach | CSG | Estrogen signaling pathway | 20/633 | 138/8465 | 3.10e-03 | 1.88e-02 | 1.35e-02 | 20 |
| Hugo Symbol | Variant Class | Variant Classification | dbSNP RS | HGVSc | HGVSp | HGVSp Short | SWISSPROT | BIOTYPE | SIFT | PolyPhen | Tumor Sample Barcode | Tissue | Histology | Sex | Age | Stage | Therapy Types | Drugs | Outcome |
| FKBP4 | SNV | Missense_Mutation | | c.557G>A | p.Arg186Gln | p.R186Q | Q02790 | protein_coding | deleterious(0) | probably_damaging(0.985) | TCGA-A2-A0CL-01 | Breast | breast invasive carcinoma | Female | <65 | III/IV | Chemotherapy | cytoxan | SD |
| FKBP4 | SNV | Missense_Mutation | novel | c.1223N>G | p.Lys408Arg | p.K408R | Q02790 | protein_coding | tolerated(0.26) | benign(0.159) | TCGA-A7-A4SD-01 | Breast | breast invasive carcinoma | Female | <65 | I/II | Chemotherapy | taxotere | CR |
| FKBP4 | SNV | Missense_Mutation | novel | c.766N>C | p.Lys256Gln | p.K256Q | Q02790 | protein_coding | deleterious(0) | possibly_damaging(0.881) | TCGA-BH-A0HU-01 | Breast | breast invasive carcinoma | Female | <65 | I/II | Chemotherapy | docetaxel | SD |
| FKBP4 | SNV | Missense_Mutation | | c.1108G>A | p.Glu370Lys | p.E370K | Q02790 | protein_coding | deleterious(0.04) | benign(0.058) | TCGA-EA-A1QS-01 | Cervix | cervical & endocervical cancer | Female | <65 | I/II | Unknown | Unknown | SD |
| FKBP4 | SNV | Missense_Mutation | | c.823G>C | p.Glu275Gln | p.E275Q | Q02790 | protein_coding | tolerated(0.08) | benign(0.428) | TCGA-EK-A2H0-01 | Cervix | cervical & endocervical cancer | Female | <65 | I/II | Chemotherapy | cisplatin | CR |
| FKBP4 | SNV | Missense_Mutation | | c.26C>T | p.Thr9Ile | p.T9I | Q02790 | protein_coding | tolerated(0.18) | benign(0.017) | TCGA-Q1-A73P-01 | Cervix | cervical & endocervical cancer | Female | <65 | I/II | Unknown | Unknown | SD |
| FKBP4 | SNV | Missense_Mutation | | c.823G>C | p.Glu275Gln | p.E275Q | Q02790 | protein_coding | tolerated(0.08) | benign(0.428) | TCGA-ZJ-A8QQ-01 | Cervix | cervical & endocervical cancer | Female | <65 | I/II | Chemotherapy | cisplatin | SD |
| FKBP4 | SNV | Missense_Mutation | novel | c.976G>T | p.Ala326Ser | p.A326S | Q02790 | protein_coding | deleterious(0.04) | possibly_damaging(0.59) | TCGA-ZJ-AAX8-01 | Cervix | cervical & endocervical cancer | Female | <65 | III/IV | Unknown | Unknown | SD |
| FKBP4 | insertion | Frame_Shift_Ins | novel | c.372dupC | p.Asn125GlnfsTer7 | p.N125Qfs*7 | Q02790 | protein_coding | | | TCGA-EA-A3HU-01 | Cervix | cervical & endocervical cancer | Female | <65 | I/II | Unknown | Unknown | SD |
| FKBP4 | SNV | Missense_Mutation | rs766636474 | c.1343N>T | p.Thr448Met | p.T448M | Q02790 | protein_coding | tolerated_low_confidence(0.16) | benign(0) | TCGA-A6-2686-01 | Colorectum | colon adenocarcinoma | Female | >=65 | I/II | Unknown | Unknown | SD |


