| Tissue | Expression Dynamics | Abbreviation |
| Colorectum (GSE201348) | 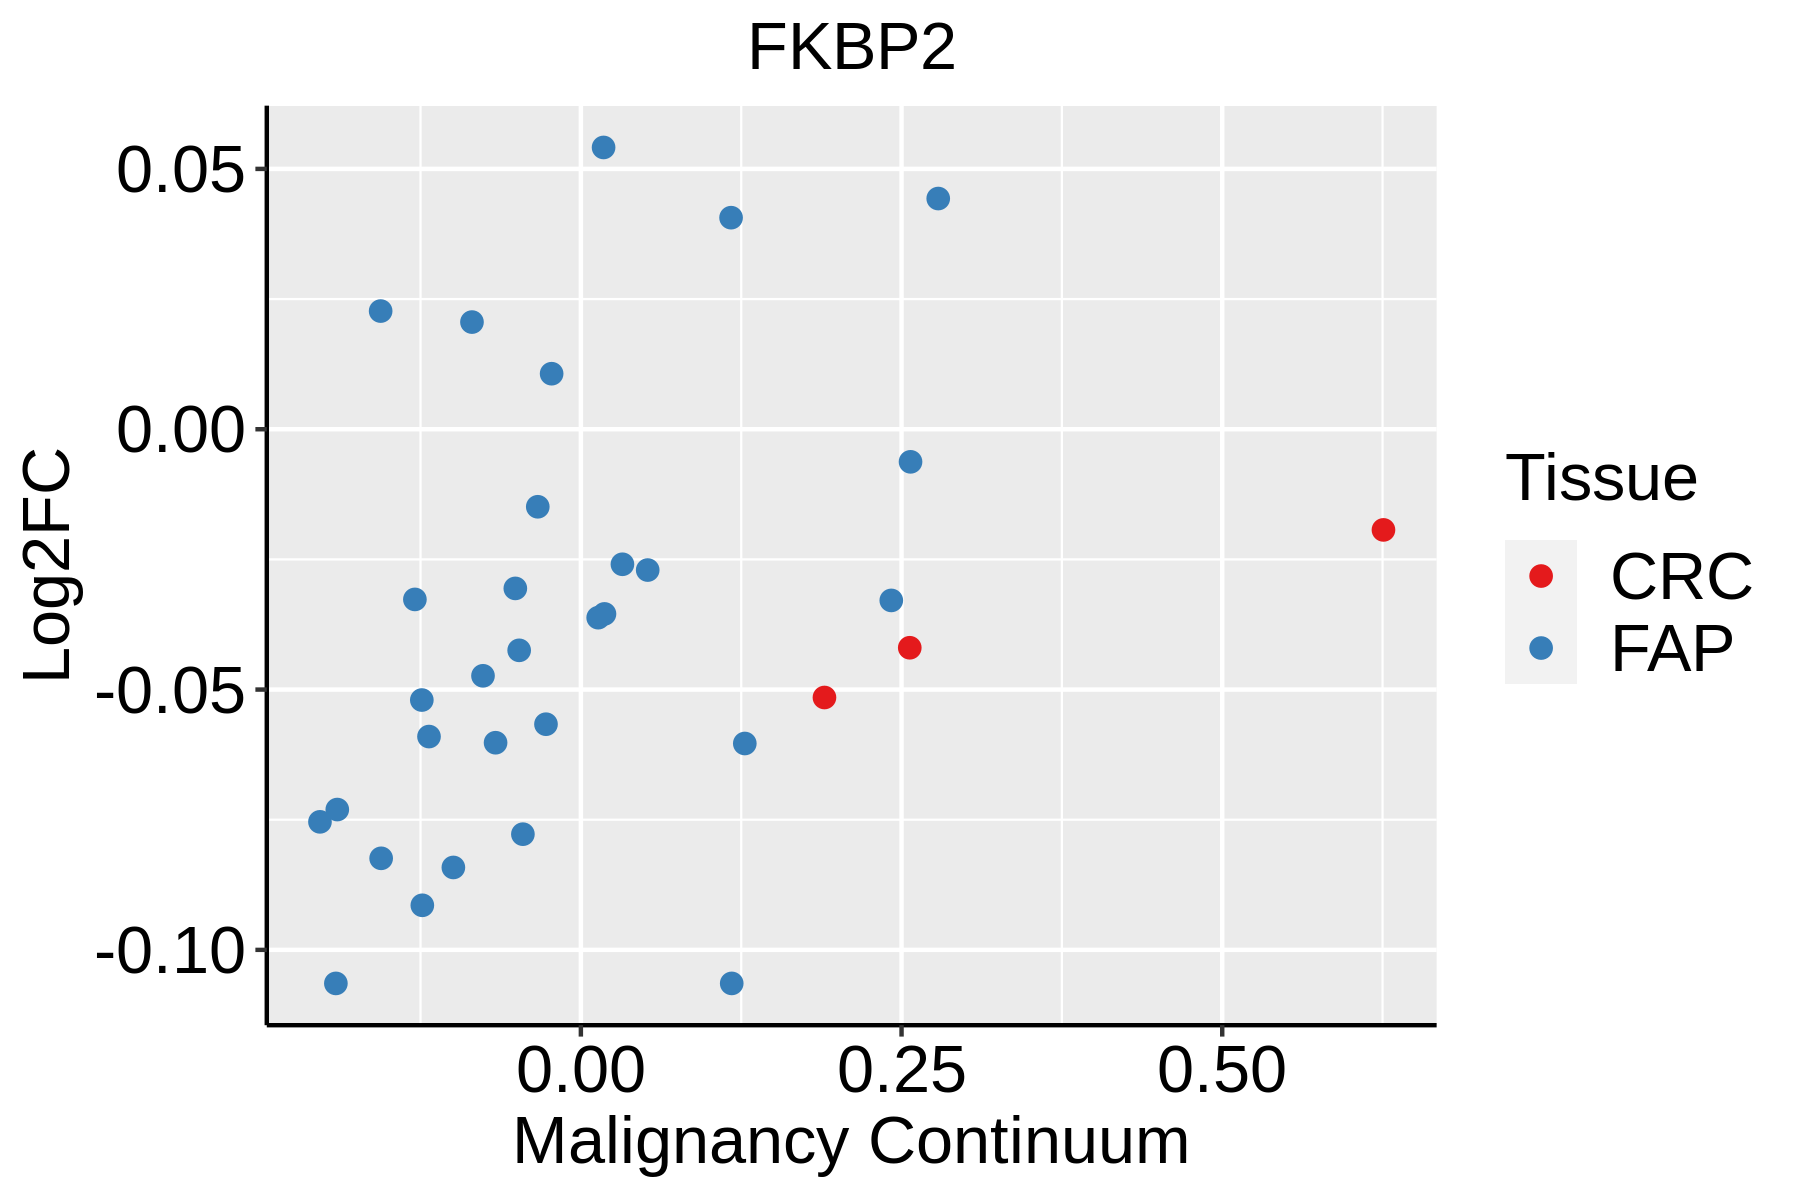 | FAP: Familial adenomatous polyposis |
| CRC: Colorectal cancer |
| Colorectum (HTA11) | 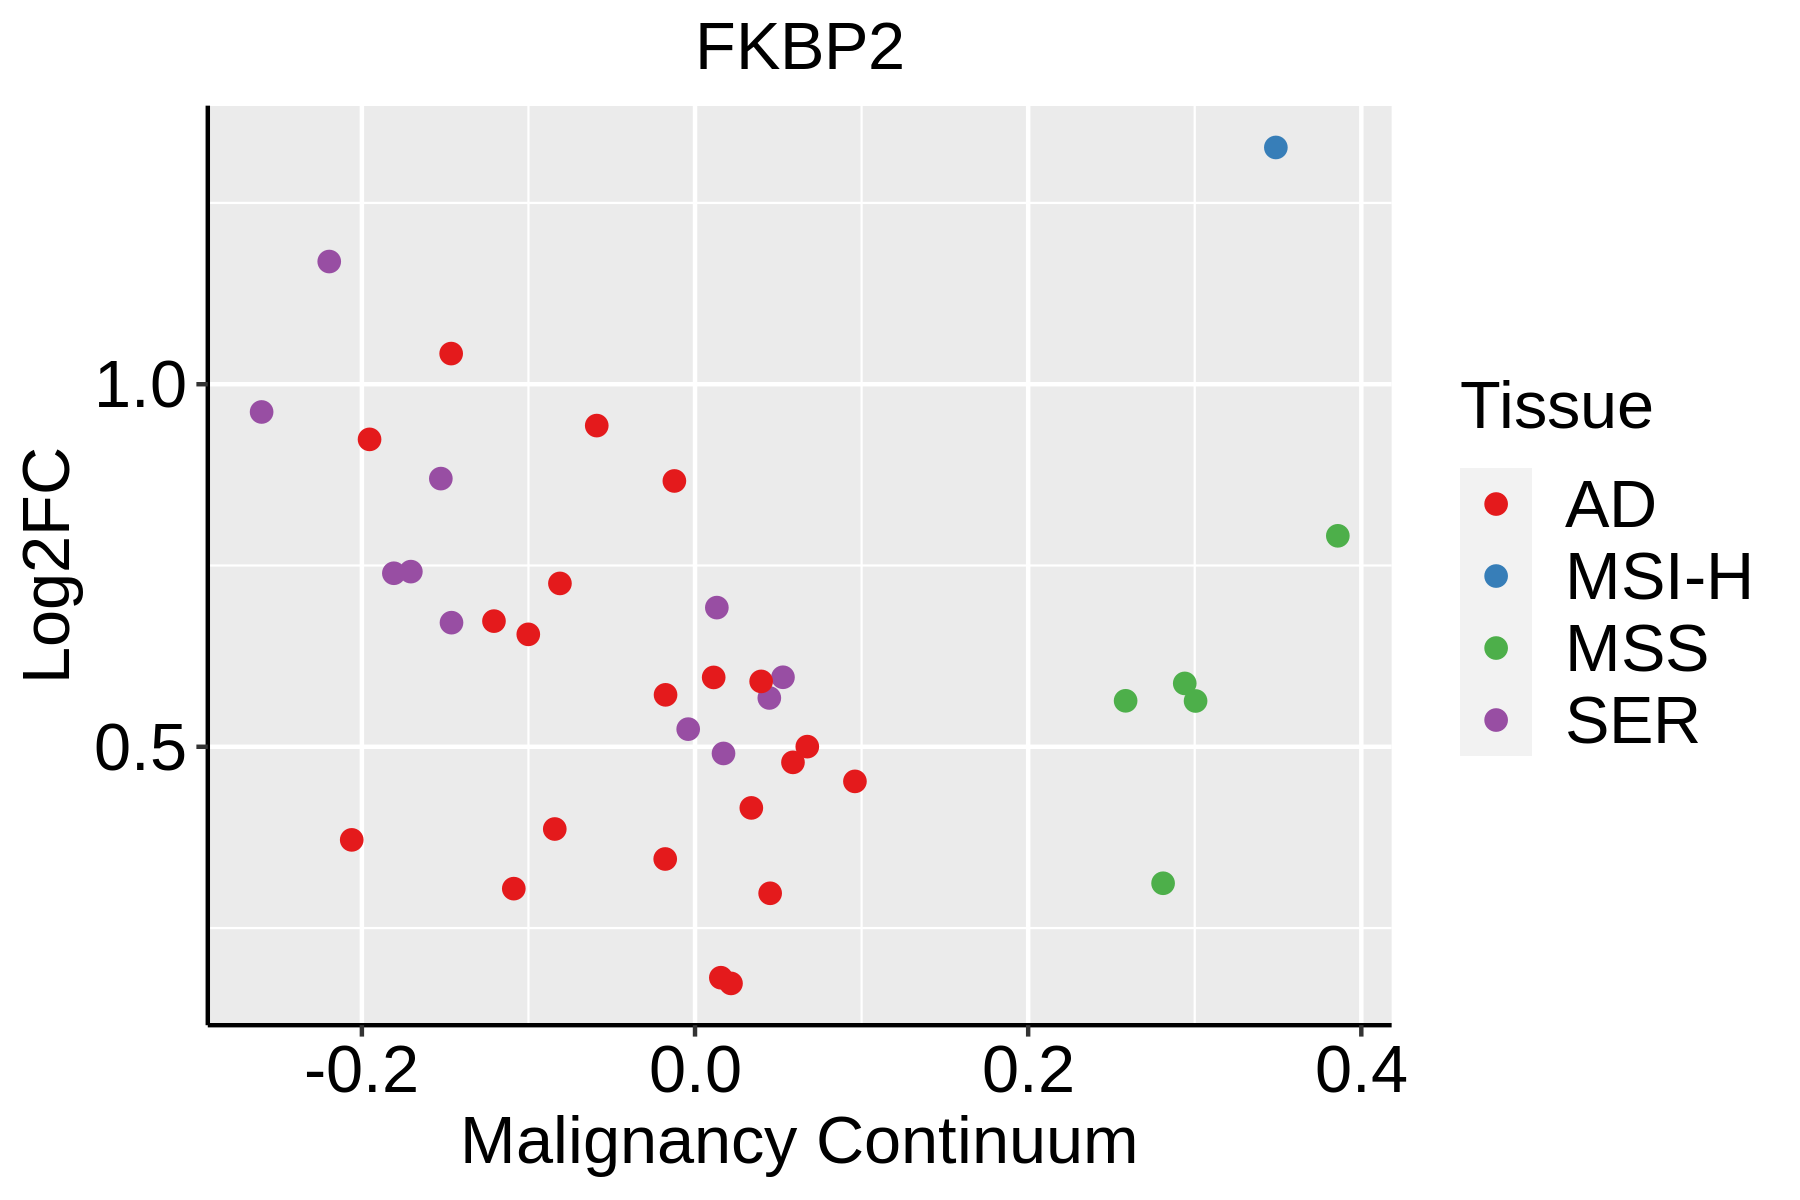 | AD: Adenomas |
| SER: Sessile serrated lesions |
| MSI-H: Microsatellite-high colorectal cancer |
| MSS: Microsatellite stable colorectal cancer |
| Endometrium | 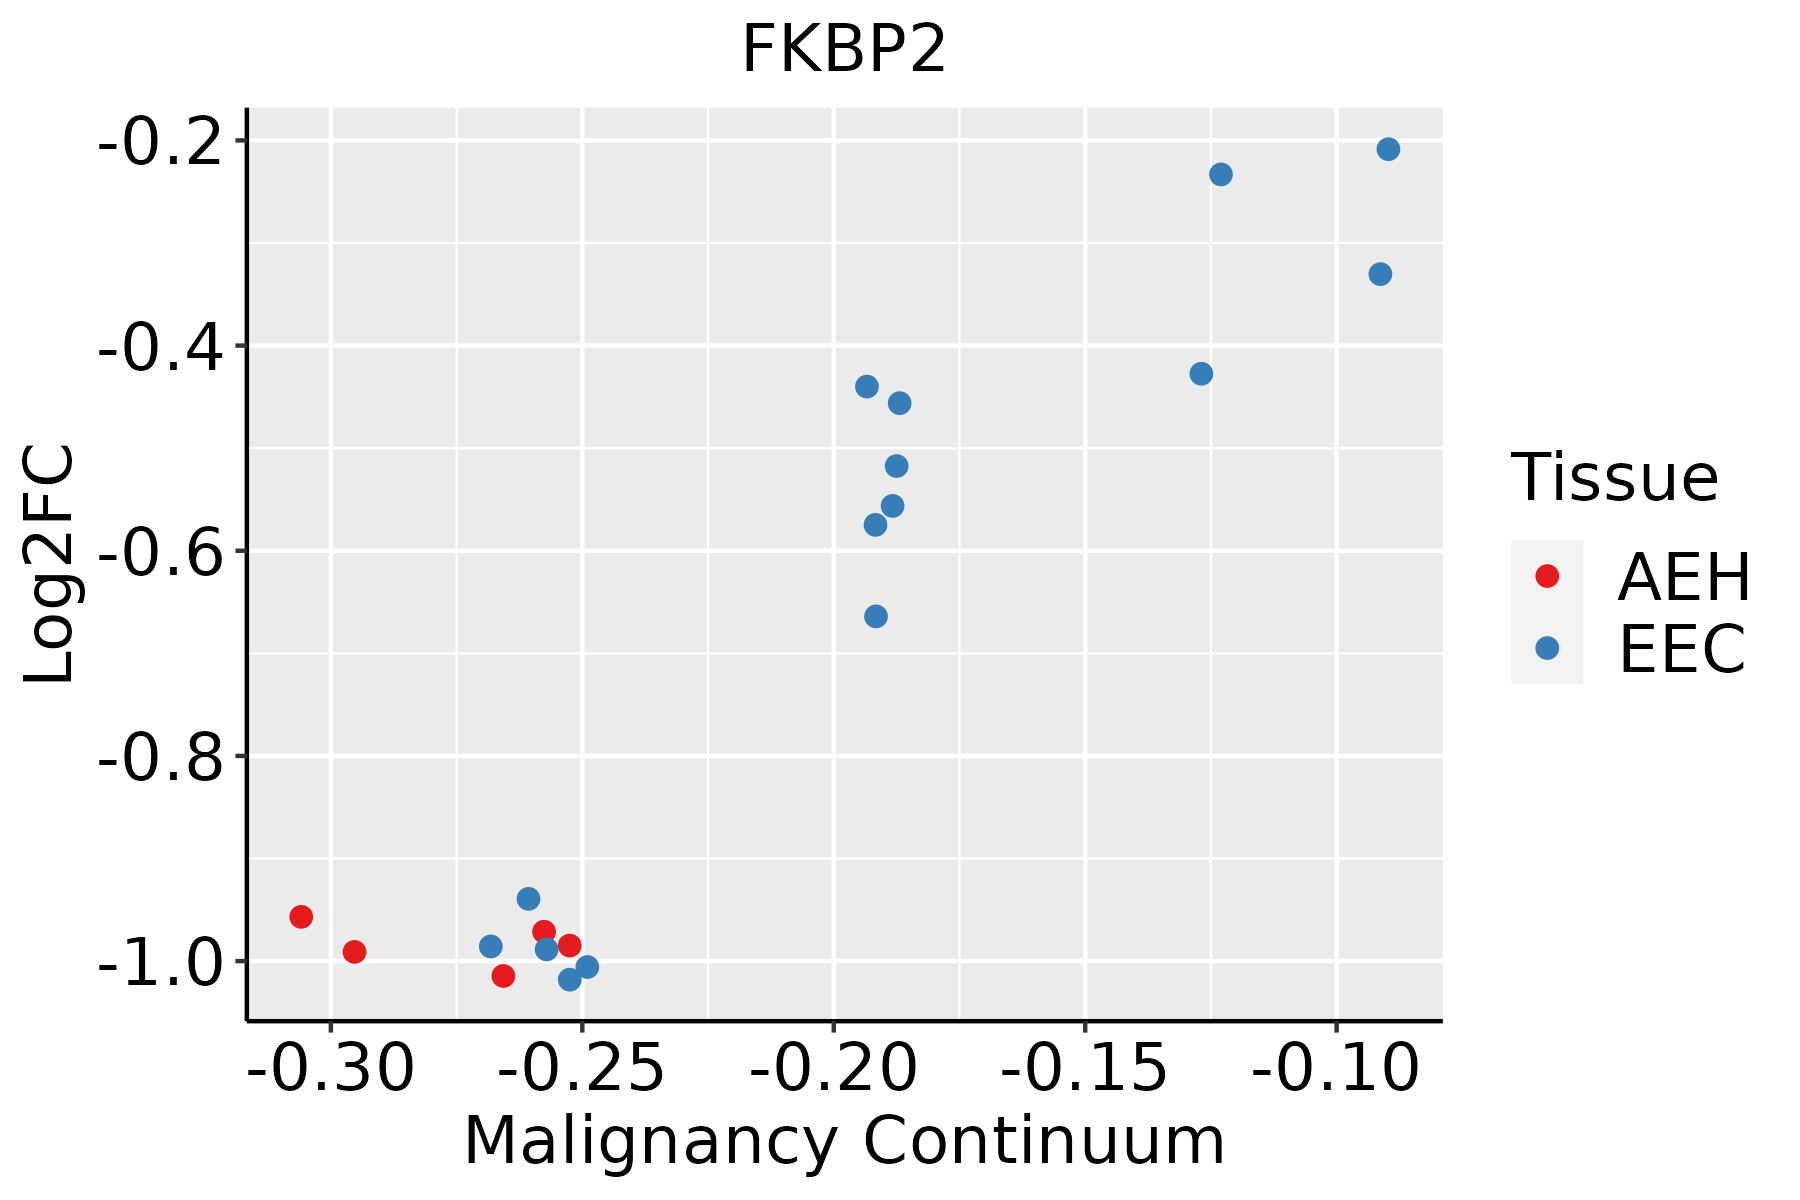 | AEH: Atypical endometrial hyperplasia |
| EEC: Endometrioid Cancer |
| Esophagus |  | ESCC: Esophageal squamous cell carcinoma |
| HGIN: High-grade intraepithelial neoplasias |
| LGIN: Low-grade intraepithelial neoplasias |
| GC |  | CAG: Chronic atrophic gastritis |
| CAG with IM: Chronic atrophic gastritis with intestinal metaplasia |
| CSG: Chronic superficial gastritis |
| GC: Gastric cancer |
| SIM: Severe intestinal metaplasia |
| WIM: Wild intestinal metaplasia |
| Liver |  | HCC: Hepatocellular carcinoma |
| NAFLD: Non-alcoholic fatty liver disease |
| Oral Cavity | 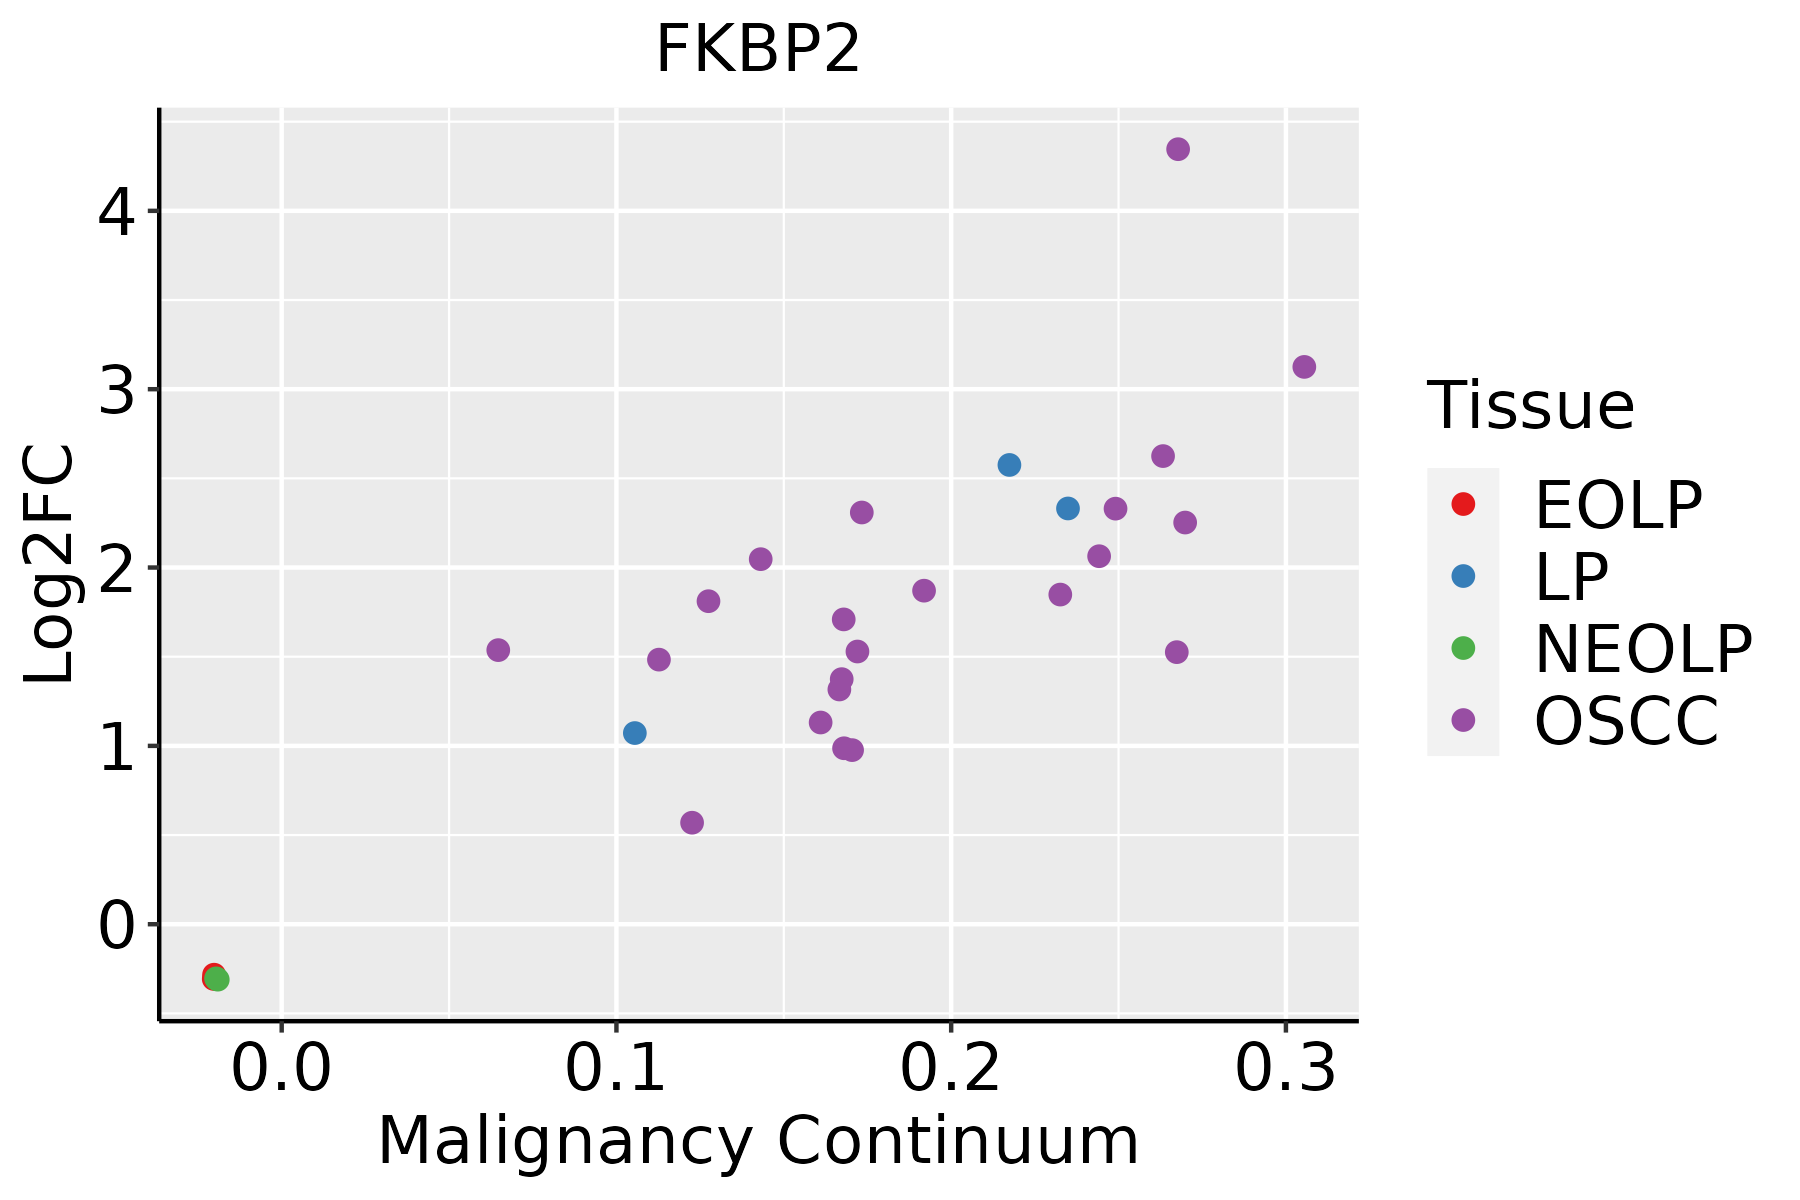 | EOLP: Erosive Oral lichen planus |
| LP: leukoplakia |
| NEOLP: Non-erosive oral lichen planus |
| OSCC: Oral squamous cell carcinoma |
| Prostate | 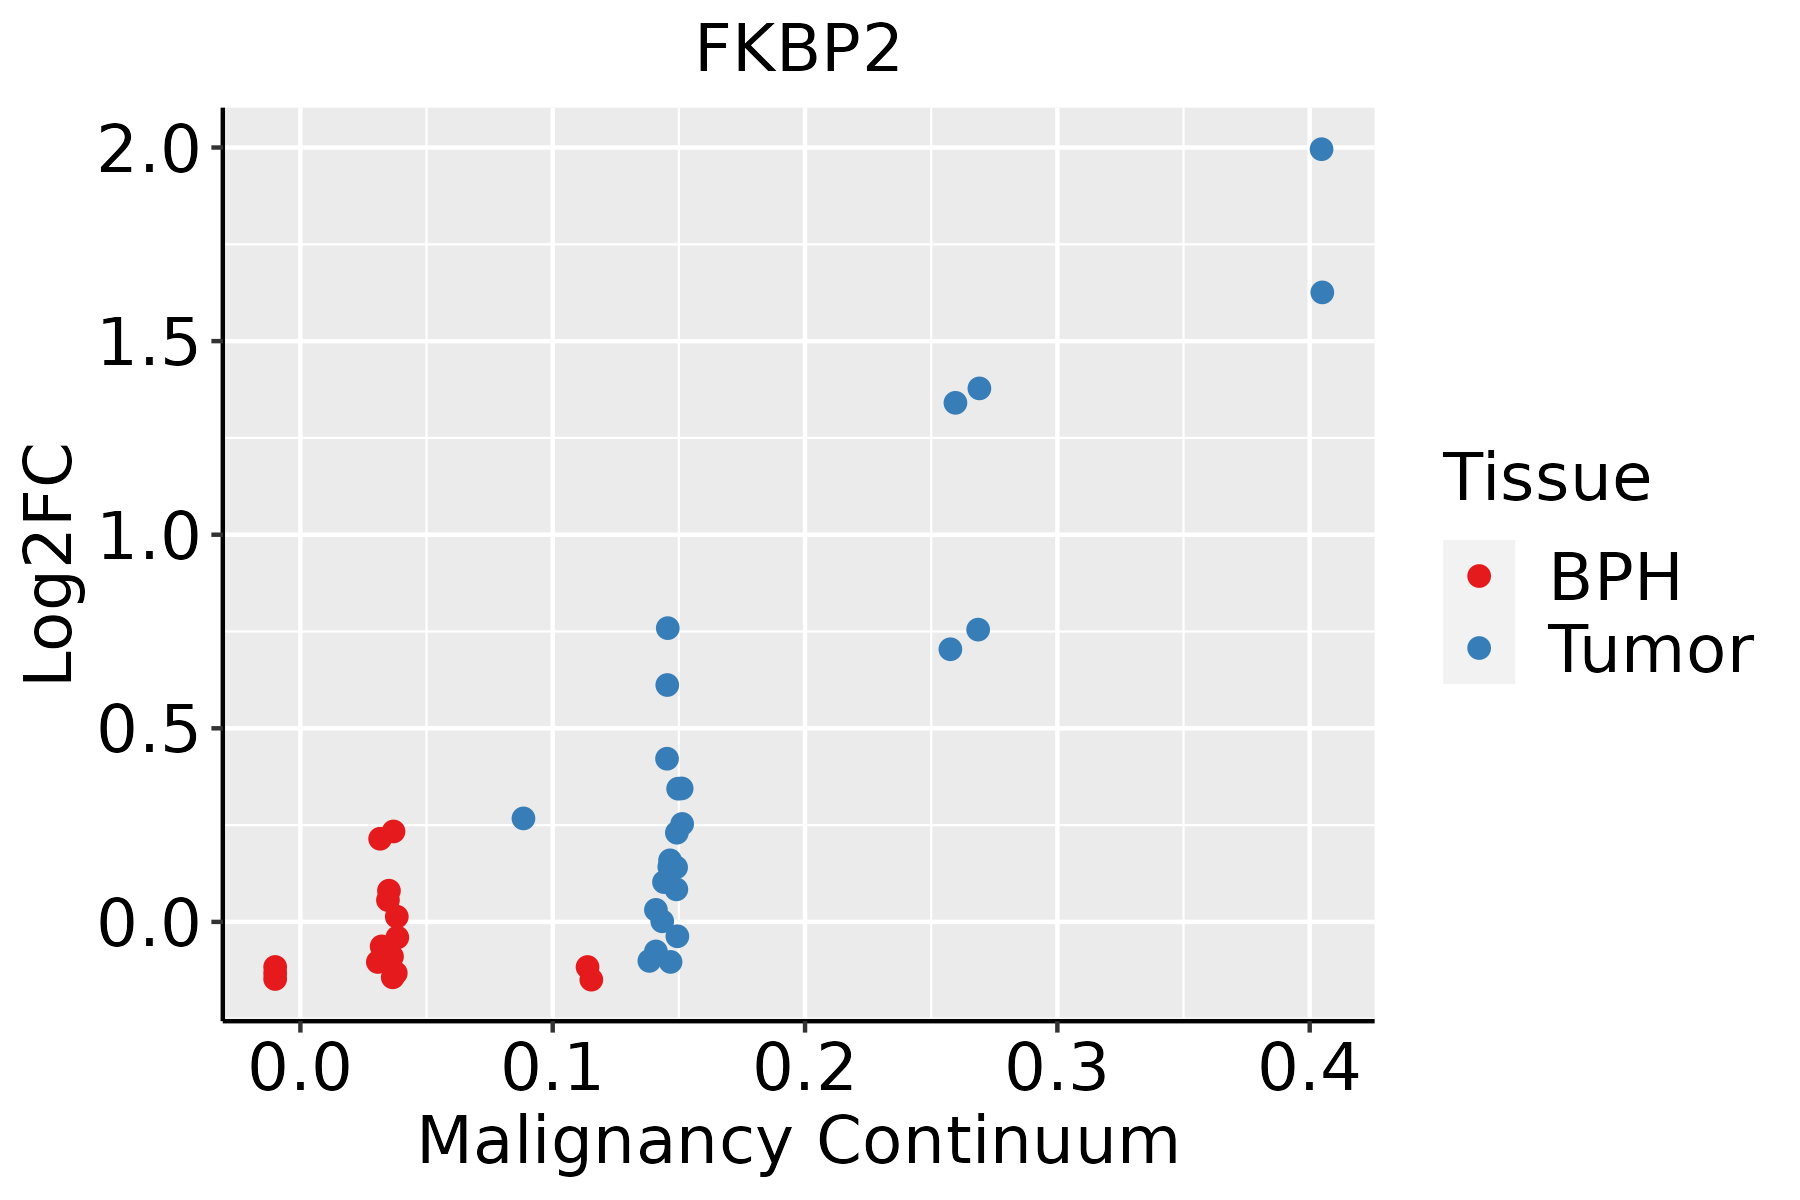 | BPH: Benign Prostatic Hyperplasia |
| Skin |  | AK: Actinic keratosis |
| cSCC: Cutaneous squamous cell carcinoma |
| SCCIS:squamous cell carcinoma in situ |
| Thyroid | 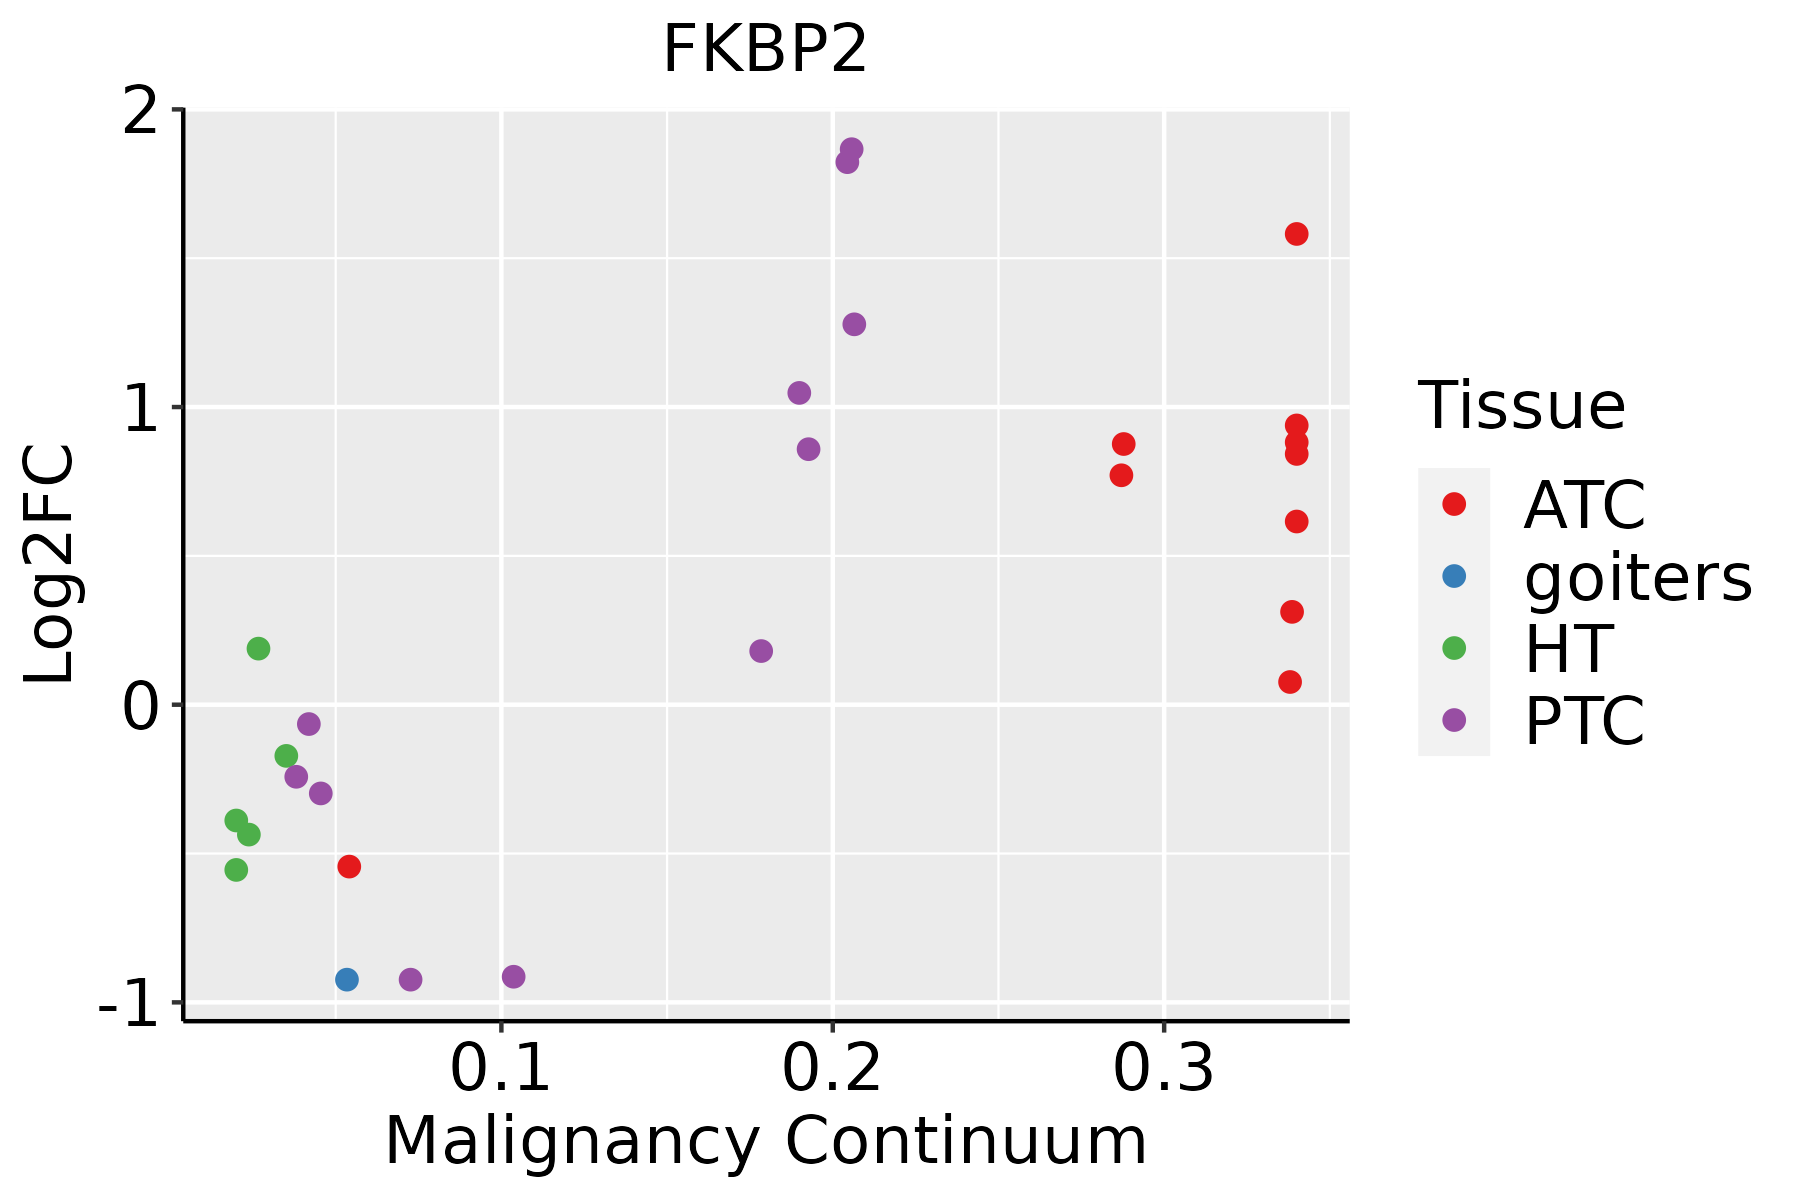 | ATC: Anaplastic thyroid cancer |
| HT: Hashimoto's thyroiditis |
| PTC: Papillary thyroid cancer |
| GO ID | Tissue | Disease Stage | Description | Gene Ratio | Bg Ratio | pvalue | p.adjust | Count |
| GO:0006457 | Colorectum | AD | protein folding | 73/3918 | 212/18723 | 3.24e-06 | 9.10e-05 | 73 |
| GO:0061077 | Colorectum | AD | chaperone-mediated protein folding | 26/3918 | 67/18723 | 6.20e-04 | 6.48e-03 | 26 |
| GO:00064571 | Colorectum | SER | protein folding | 54/2897 | 212/18723 | 1.04e-04 | 2.18e-03 | 54 |
| GO:00610771 | Colorectum | SER | chaperone-mediated protein folding | 21/2897 | 67/18723 | 8.44e-04 | 1.04e-02 | 21 |
| GO:00064572 | Colorectum | MSS | protein folding | 71/3467 | 212/18723 | 1.25e-07 | 5.91e-06 | 71 |
| GO:00610772 | Colorectum | MSS | chaperone-mediated protein folding | 26/3467 | 67/18723 | 8.06e-05 | 1.33e-03 | 26 |
| GO:00064573 | Colorectum | MSI-H | protein folding | 33/1319 | 212/18723 | 1.40e-05 | 6.29e-04 | 33 |
| GO:00610773 | Colorectum | MSI-H | chaperone-mediated protein folding | 15/1319 | 67/18723 | 5.12e-05 | 1.81e-03 | 15 |
| GO:000645710 | Endometrium | AEH | protein folding | 61/2100 | 212/18723 | 1.86e-12 | 3.48e-10 | 61 |
| GO:006107710 | Endometrium | AEH | chaperone-mediated protein folding | 23/2100 | 67/18723 | 4.82e-07 | 1.94e-05 | 23 |
| GO:00004133 | Endometrium | AEH | protein peptidyl-prolyl isomerization | 13/2100 | 42/18723 | 4.74e-04 | 4.91e-03 | 13 |
| GO:00182086 | Endometrium | AEH | peptidyl-proline modification | 16/2100 | 58/18723 | 4.75e-04 | 4.91e-03 | 16 |
| GO:000645715 | Endometrium | EEC | protein folding | 63/2168 | 212/18723 | 6.82e-13 | 1.40e-10 | 63 |
| GO:006107715 | Endometrium | EEC | chaperone-mediated protein folding | 23/2168 | 67/18723 | 8.50e-07 | 2.98e-05 | 23 |
| GO:000041311 | Endometrium | EEC | protein peptidyl-prolyl isomerization | 14/2168 | 42/18723 | 1.69e-04 | 2.10e-03 | 14 |
| GO:001820813 | Endometrium | EEC | peptidyl-proline modification | 17/2168 | 58/18723 | 2.11e-04 | 2.54e-03 | 17 |
| GO:0006457110 | Esophagus | ESCC | protein folding | 163/8552 | 212/18723 | 1.13e-20 | 1.74e-18 | 163 |
| GO:0061077110 | Esophagus | ESCC | chaperone-mediated protein folding | 56/8552 | 67/18723 | 1.52e-10 | 4.36e-09 | 56 |
| GO:001820816 | Esophagus | ESCC | peptidyl-proline modification | 46/8552 | 58/18723 | 1.59e-07 | 2.51e-06 | 46 |
| GO:000041313 | Esophagus | ESCC | protein peptidyl-prolyl isomerization | 32/8552 | 42/18723 | 5.52e-05 | 4.27e-04 | 32 |
| Hugo Symbol | Variant Class | Variant Classification | dbSNP RS | HGVSc | HGVSp | HGVSp Short | SWISSPROT | BIOTYPE | SIFT | PolyPhen | Tumor Sample Barcode | Tissue | Histology | Sex | Age | Stage | Therapy Types | Drugs | Outcome |
| FKBP2 | SNV | Missense_Mutation | novel | c.222N>C | p.Gln74His | p.Q74H | P26885 | protein_coding | deleterious(0.01) | possibly_damaging(0.895) | TCGA-A7-A6VY-01 | Breast | breast invasive carcinoma | Female | <65 | I/II | Chemotherapy | cyclophosphamide | CR |
| FKBP2 | SNV | Missense_Mutation | | c.130N>G | p.Ile44Val | p.I44V | P26885 | protein_coding | tolerated(0.57) | benign(0.003) | TCGA-D8-A1XK-01 | Breast | breast invasive carcinoma | Female | <65 | I/II | Chemotherapy | doxorubicine+cyclophosphamide | SD |
| FKBP2 | SNV | Missense_Mutation | | c.416N>T | p.Arg139Leu | p.R139L | P26885 | protein_coding | deleterious(0.01) | benign(0.178) | TCGA-EA-A50E-01 | Cervix | cervical & endocervical cancer | Female | <65 | I/II | Unknown | Unknown | PD |
| FKBP2 | SNV | Missense_Mutation | novel | c.320C>A | p.Pro107Gln | p.P107Q | P26885 | protein_coding | deleterious(0) | probably_damaging(0.991) | TCGA-Q1-A73P-01 | Cervix | cervical & endocervical cancer | Female | <65 | I/II | Unknown | Unknown | SD |
| FKBP2 | SNV | Missense_Mutation | novel | c.76N>A | p.Glu26Lys | p.E26K | P26885 | protein_coding | tolerated(0.3) | benign(0.006) | TCGA-VS-A952-01 | Cervix | cervical & endocervical cancer | Female | >=65 | I/II | Unknown | Unknown | SD |
| FKBP2 | SNV | Missense_Mutation | novel | c.89N>G | p.Lys30Arg | p.K30R | P26885 | protein_coding | tolerated(0.15) | benign(0.013) | TCGA-AA-3867-01 | Colorectum | colon adenocarcinoma | Male | >=65 | III/IV | Unknown | Unknown | PD |
| FKBP2 | deletion | Frame_Shift_Del | | c.298delG | p.Glu100LysfsTer6 | p.E100Kfs*6 | P26885 | protein_coding | | | TCGA-AA-3710-01 | Colorectum | colon adenocarcinoma | Female | >=65 | I/II | Unknown | Unknown | SD |
| FKBP2 | SNV | Missense_Mutation | | c.388G>A | p.Glu130Lys | p.E130K | P26885 | protein_coding | deleterious(0.01) | possibly_damaging(0.477) | TCGA-A5-A0GB-01 | Endometrium | uterine corpus endometrioid carcinoma | Female | >=65 | I/II | Unknown | Unknown | SD |
| FKBP2 | SNV | Missense_Mutation | | c.115G>A | p.Val39Met | p.V39M | P26885 | protein_coding | tolerated(0.07) | benign(0.416) | TCGA-D1-A177-01 | Endometrium | uterine corpus endometrioid carcinoma | Female | >=65 | I/II | Unknown | Unknown | PD |
| FKBP2 | deletion | Frame_Shift_Del | novel | c.121_122delNN | p.His41LeufsTer26 | p.H41Lfs*26 | P26885 | protein_coding | | | TCGA-B5-A0K4-01 | Endometrium | uterine corpus endometrioid carcinoma | Female | <65 | I/II | Chemotherapy | carboplatin | SD |


