
|
|||||
|
 | |
| |
| |
| |
| |
| |
|
Gene: FKBP1B |
Gene summary for FKBP1B |
| Gene information | Species | Human | Gene symbol | FKBP1B | Gene ID | 2281 |
| Gene name | FKBP prolyl isomerase 1B | |
| Gene Alias | FKBP12.6 | |
| Cytomap | 2p23.3 | |
| Gene Type | protein-coding | GO ID | GO:0000302 | UniProtAcc | F8W6G9 |
Top |
Malignant transformation analysis |
| Identification of the aberrant gene expression in precancerous and cancerous lesions by comparing the gene expression of stem-like cells in diseased tissues with normal stem cells |
| Entrez ID | Symbol | Replicates | Species | Organ | Tissue | Adj P-value | Log2FC | Malignancy |
| 2281 | FKBP1B | P2T-E | Human | Esophagus | ESCC | 7.16e-08 | 2.13e-01 | 0.1177 |
| 2281 | FKBP1B | P4T-E | Human | Esophagus | ESCC | 1.45e-20 | 3.79e-01 | 0.1323 |
| 2281 | FKBP1B | P9T-E | Human | Esophagus | ESCC | 6.74e-06 | 1.56e-01 | 0.1131 |
| 2281 | FKBP1B | P10T-E | Human | Esophagus | ESCC | 1.90e-06 | 1.17e-01 | 0.116 |
| 2281 | FKBP1B | P12T-E | Human | Esophagus | ESCC | 2.17e-08 | 1.92e-01 | 0.1122 |
| 2281 | FKBP1B | P16T-E | Human | Esophagus | ESCC | 1.40e-05 | 1.10e-01 | 0.1153 |
| 2281 | FKBP1B | P20T-E | Human | Esophagus | ESCC | 8.62e-07 | 1.59e-01 | 0.1124 |
| 2281 | FKBP1B | P24T-E | Human | Esophagus | ESCC | 9.55e-04 | 9.97e-02 | 0.1287 |
| 2281 | FKBP1B | P26T-E | Human | Esophagus | ESCC | 2.77e-08 | 2.45e-01 | 0.1276 |
| 2281 | FKBP1B | P27T-E | Human | Esophagus | ESCC | 2.48e-06 | 1.76e-01 | 0.1055 |
| 2281 | FKBP1B | P28T-E | Human | Esophagus | ESCC | 2.64e-13 | 2.79e-01 | 0.1149 |
| 2281 | FKBP1B | P30T-E | Human | Esophagus | ESCC | 1.56e-07 | 2.42e-01 | 0.137 |
| 2281 | FKBP1B | P37T-E | Human | Esophagus | ESCC | 2.57e-08 | 1.86e-01 | 0.1371 |
| 2281 | FKBP1B | P38T-E | Human | Esophagus | ESCC | 3.86e-14 | 4.73e-01 | 0.127 |
| 2281 | FKBP1B | P39T-E | Human | Esophagus | ESCC | 2.70e-06 | 1.60e-01 | 0.0894 |
| 2281 | FKBP1B | P42T-E | Human | Esophagus | ESCC | 2.93e-03 | 1.05e-01 | 0.1175 |
| 2281 | FKBP1B | P47T-E | Human | Esophagus | ESCC | 3.61e-04 | 1.23e-01 | 0.1067 |
| 2281 | FKBP1B | P48T-E | Human | Esophagus | ESCC | 3.59e-05 | 7.47e-02 | 0.0959 |
| 2281 | FKBP1B | P49T-E | Human | Esophagus | ESCC | 3.28e-15 | 1.01e+00 | 0.1768 |
| 2281 | FKBP1B | P54T-E | Human | Esophagus | ESCC | 5.82e-06 | 1.38e-01 | 0.0975 |
| Page: 1 2 3 |
| Tissue | Expression Dynamics | Abbreviation |
| Esophagus | 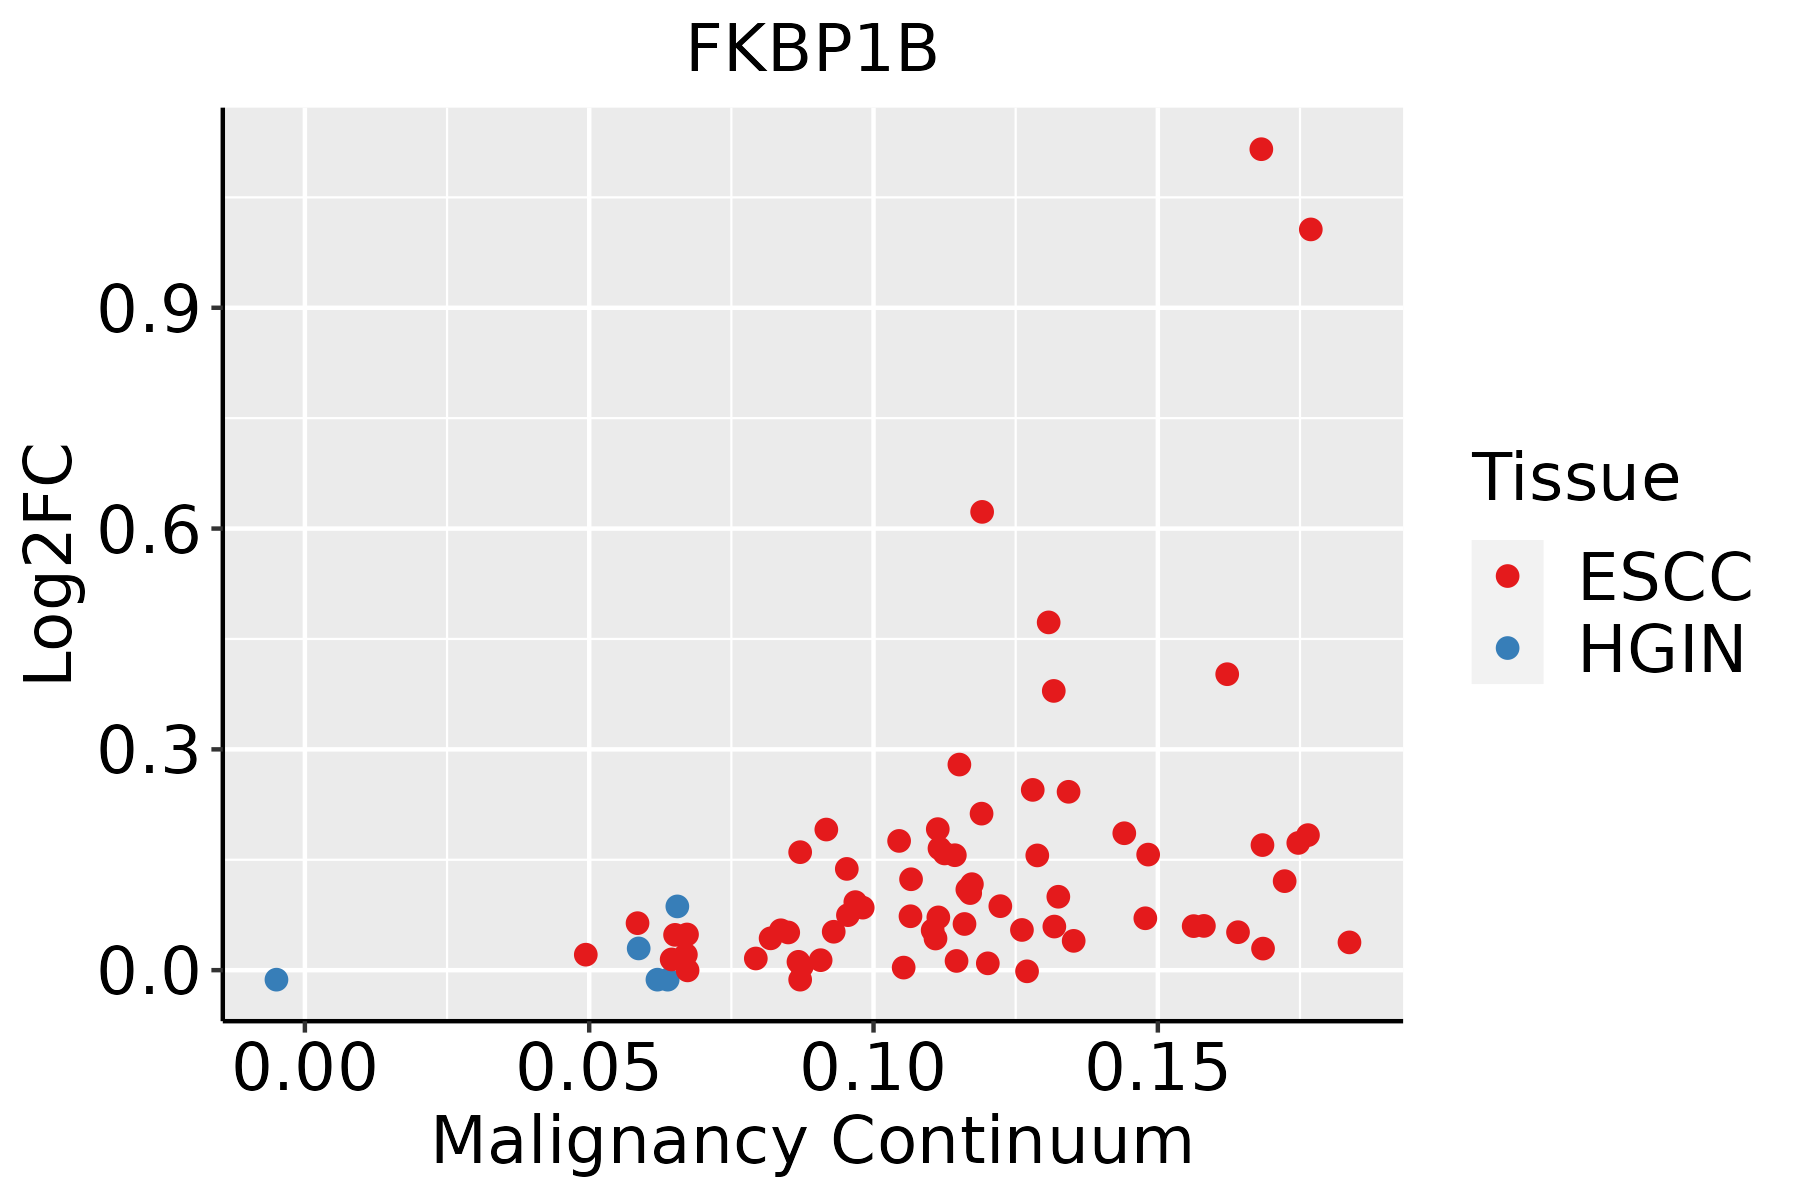 | ESCC: Esophageal squamous cell carcinoma |
| HGIN: High-grade intraepithelial neoplasias | ||
| LGIN: Low-grade intraepithelial neoplasias | ||
| Liver |  | HCC: Hepatocellular carcinoma |
| NAFLD: Non-alcoholic fatty liver disease | ||
| Oral Cavity |  | EOLP: Erosive Oral lichen planus |
| LP: leukoplakia | ||
| NEOLP: Non-erosive oral lichen planus | ||
| OSCC: Oral squamous cell carcinoma |
| ∗log2FC in expression of this searched gene in stem-like cells from each diseased tissue sample relative to stem-like cells in normal samples in each tissue plotted against the malignancy continuum. Samples are colored based on if they are from different disease stage. |
Top |
Malignant transformation related pathway analysis |
| Find out the enriched GO biological processes and KEGG pathways involved in transition from healthy to precancer to cancer |
| Tissue | Disease Stage | Enriched GO biological Processes |
| Colorectum | AD |  |
| Colorectum | SER |  |
| Colorectum | MSS |  |
| Colorectum | MSI-H |  |
| Colorectum | FAP |  |
| ∗Top 15 enriched GO BP terms are showed in the bar plot of each disease state in each tissue. Each row represents a significant GO biological process which is colored according to the -log10(p.adjust). |
| Page: 1 2 3 4 5 6 7 8 9 |
| GO ID | Tissue | Disease Stage | Description | Gene Ratio | Bg Ratio | pvalue | p.adjust | Count |
| GO:0006979111 | Esophagus | ESCC | response to oxidative stress | 303/8552 | 446/18723 | 7.15e-22 | 1.30e-19 | 303 |
| GO:0006457110 | Esophagus | ESCC | protein folding | 163/8552 | 212/18723 | 1.13e-20 | 1.74e-18 | 163 |
| GO:0010563111 | Esophagus | ESCC | negative regulation of phosphorus metabolic process | 274/8552 | 442/18723 | 2.32e-12 | 9.41e-11 | 274 |
| GO:0045936111 | Esophagus | ESCC | negative regulation of phosphate metabolic process | 273/8552 | 441/18723 | 3.18e-12 | 1.25e-10 | 273 |
| GO:0031667111 | Esophagus | ESCC | response to nutrient levels | 289/8552 | 474/18723 | 9.25e-12 | 3.47e-10 | 289 |
| GO:0000302111 | Esophagus | ESCC | response to reactive oxygen species | 150/8552 | 222/18723 | 3.06e-11 | 1.02e-09 | 150 |
| GO:005160418 | Esophagus | ESCC | protein maturation | 189/8552 | 294/18723 | 7.64e-11 | 2.39e-09 | 189 |
| GO:0061077110 | Esophagus | ESCC | chaperone-mediated protein folding | 56/8552 | 67/18723 | 1.52e-10 | 4.36e-09 | 56 |
| GO:001631110 | Esophagus | ESCC | dephosphorylation | 251/8552 | 417/18723 | 1.26e-09 | 2.99e-08 | 251 |
| GO:0042542111 | Esophagus | ESCC | response to hydrogen peroxide | 102/8552 | 146/18723 | 2.64e-09 | 5.81e-08 | 102 |
| GO:000647018 | Esophagus | ESCC | protein dephosphorylation | 177/8552 | 281/18723 | 3.13e-09 | 6.72e-08 | 177 |
| GO:0051235110 | Esophagus | ESCC | maintenance of location | 200/8552 | 327/18723 | 1.01e-08 | 2.02e-07 | 200 |
| GO:0035304111 | Esophagus | ESCC | regulation of protein dephosphorylation | 66/8552 | 90/18723 | 8.82e-08 | 1.48e-06 | 66 |
| GO:000758410 | Esophagus | ESCC | response to nutrient | 114/8552 | 174/18723 | 9.43e-08 | 1.56e-06 | 114 |
| GO:0035303111 | Esophagus | ESCC | regulation of dephosphorylation | 88/8552 | 128/18723 | 1.04e-07 | 1.71e-06 | 88 |
| GO:001820816 | Esophagus | ESCC | peptidyl-proline modification | 46/8552 | 58/18723 | 1.59e-07 | 2.51e-06 | 46 |
| GO:0006458110 | Esophagus | ESCC | 'de novo' protein folding | 36/8552 | 43/18723 | 2.90e-07 | 4.20e-06 | 36 |
| GO:003109910 | Esophagus | ESCC | regeneration | 122/8552 | 198/18723 | 4.26e-06 | 4.57e-05 | 122 |
| GO:003134616 | Esophagus | ESCC | positive regulation of cell projection organization | 201/8552 | 353/18723 | 1.19e-05 | 1.11e-04 | 201 |
| GO:0042026110 | Esophagus | ESCC | protein refolding | 20/8552 | 23/18723 | 4.97e-05 | 3.86e-04 | 20 |
| Page: 1 2 3 4 5 6 7 8 9 |
| Pathway ID | Tissue | Disease Stage | Description | Gene Ratio | Bg Ratio | pvalue | p.adjust | qvalue | Count |
| Page: 1 |
Top |
Cell-cell communication analysis |
| Identification of potential cell-cell interactions between two cell types and their ligand-receptor pairs for different disease states |
| Ligand | Receptor | LRpair | Pathway | Tissue | Disease Stage |
| Page: 1 |
Top |
Single-cell gene regulatory network inference analysis |
| Find out the significant the regulons (TFs) and the target genes of each regulon across cell types for different disease states |
| TF | Cell Type | Tissue | Disease Stage | Target Gene | RSS | Regulon Activity |
| ∗The dot plots of a searched regulon are shown for all cell subpopulations in each disease state of each tissue based on the regulon specific score inferred using pySCENIC and by calculating the average expression. |
| Page: 1 |
Top |
Somatic mutation of malignant transformation related genes |
| Annotation of somatic variants for genes involved in malignant transformation |
| Hugo Symbol | Variant Class | Variant Classification | dbSNP RS | HGVSc | HGVSp | HGVSp Short | SWISSPROT | BIOTYPE | SIFT | PolyPhen | Tumor Sample Barcode | Tissue | Histology | Sex | Age | Stage | Therapy Types | Drugs | Outcome |
| FKBP1B | SNV | Missense_Mutation | novel | c.304N>A | p.Val102Met | p.V102M | P68106 | protein_coding | deleterious(0.02) | possibly_damaging(0.636) | TCGA-A5-A2K3-01 | Endometrium | uterine corpus endometrioid carcinoma | Female | >=65 | I/II | Chemotherapy | carboplatin | SD |
| FKBP1B | SNV | Missense_Mutation | c.40A>G | p.Arg14Gly | p.R14G | P68106 | protein_coding | tolerated(0.25) | benign(0.005) | TCGA-66-2795-01 | Lung | lung squamous cell carcinoma | Male | >=65 | III/IV | Unknown | Unknown | SD | |
| FKBP1B | SNV | Missense_Mutation | novel | c.196N>A | p.Gln66Lys | p.Q66K | P68106 | protein_coding | tolerated(0.22) | benign(0.046) | TCGA-D6-6516-01 | Oral cavity | head & neck squamous cell carcinoma | Male | >=65 | I/II | Unknown | Unknown | SD |
| Page: 1 |
Top |
Related drugs of malignant transformation related genes |
| Identification of chemicals and drugs interact with genes involved in malignant transfromation |
| (DGIdb 4.0) |
| Entrez ID | Symbol | Category | Interaction Types | Drug Claim Name | Drug Name | PMIDs |
| Page: 1 |

Copyright 2023-Present -The University of Texas Health Science Center at Houston |